4819
Analysing the Influence of an Actively Detuned 64-channel Receive Array on SAR
Paul Mcelhinney1 and Shajan Gunamony1
1Center for Cognitive Neuroimaging, Glasgow University, Glasgow, United Kingdom
1Center for Cognitive Neuroimaging, Glasgow University, Glasgow, United Kingdom
Synopsis
We have generated a numerical model of a 64-channel receive array at 7T and analysed its influence on SAR on an 8-channel transmit array. Simulations were conducted using a finite integration technique in CST Microwave Studio to create a model of the combined Tx/Rx system on both our phantom and the Duke human body model. Each receive element was actively detuned and implemented within our 8 channel transmit array model to provide us with an improved model from which we found that there was a negligible effect on the B1+ field and a reduction in the SAR of ~20%.
Introduction
Electromagnetic simulation for the characterisation of specific absorption rate (SAR) is an important step in the development of custom coil designs, both for safety considerations and for pTx sequence development [1]. High-density 7T receive arrays have been shown to significantly improve parallel imaging performance, and up to 128-channel receive arrays have been presented [2-4]. The validation process assumes the receive array, which is present within the transmit field, to be transparent and a safety factor is accounted to manage this uncertainty [5]. In this work, we have generated a numerical model of a 64-channel receive array and analysed its influence on SAR on an 8-channel transmit array [6].Methods
The aim of this work is to model an actively detuned 64-channel receive array, incorporate it within a transmit array and investigate the influence on SAR. The equivalent circuit of a single receive element is shown in figure 1. The 3D model of the loop is made of rectangular loops with 0.2 mm thick; 2mm wide conductor strips. This circuit was used as the baseline model for each of the 64 elements in the array. Each receive element was tuned and matched using the CST circuit simulator. The matched S-parameters can also be seen in figure 1.To simulate the actively detuned receive array, an inductor in series with a resistor, to represent the PIN diode, is added in parallel to the blocking capacitor (C3). The equivalent circuit of a single element of an actively detuned receive array and the corresponding high impedance on the Smith chart is shown in figure 2.
This template was then repeated over the 64 channel helmet array and replicated for each individual loop using the CAD model of the inner helmet to create a conformal 3D model of all the receive loops. These individual coils were laid out in 7 rows, each offset with the next and overlapped with its neighbour. From the crown of the helmet there are 2 loops, followed by 7 then 14, 16, 14, 7 and finally 4 loops at the lower posterior portion. Each loop is laterally offset from its neighbour to ensure that there are no short circuits in the model between the loops. The model is demonstrated in figure 3. Note that the individual overlaps were not optimized because the transmit condition in which the receive array is actively detuned is being simulated.
Once this model had been created it was imported into our 8-channel transmit mode as a subproject, which allowed us to simulate the entire system with both transmit and receive elements. Each coil element in the receive array was individually tuned to 297.2 MHz using the tuning capacitor, before we removed this port from the system and replaced it with a fixed value lumped element in order to reduce the number of ports simulated from 160 to 96. The receive array was then detuned using the matching circuit and a transient simulation was performed. This was done for both our head and shoulders phantom and the Duke human body model.
Results
A comparison between the peak B1+ values showed a negligible difference is the field distribution overall, but a slight improvement in the field was noted. The peak value of the B1+ field was 2.5 µT in the model with the addition of the receive array compared with a slightly lower value of 2.4 µT in the model without the receive array. An axial slice showing this field distribution is demonstrated in figure 4. The SAR has reduced in the Duke model, where the difference in peak value is 2.9 W/kg in the original compared with 2.34 W/kg in the new model with the receive array. This is for a total power simulated of 8 W (1 W/channel). The SAR distribution has changed only very slightly as is seen in figure 5.Discussion
The purpose of these simulations is to provide a foundation for safety validation of our coil model, especially when we are considering pTx operation and the creation of virtual observation points for online SAR predictions at the scanner. These preliminary investigations demonstrate that we can include our full receive array by building on individually detuned coil elements to model both transmit and receive components simultaneously for SAR evaluation without having to fully decouple the receive array. We did see that the peak B1+ field at the isocentre increased in the model with the receive array, which was unexpected. However, both the SAR and the power losses in the phantom decreased. The losses in the phantom without the receive array were 5.2 W compared to 5 W for the model with the receive array, so the reason for this apparent increase may be attributed to a slightly better tuning of the transmit array, which is necessitated by the change in the mesh when including the large number of receive elements. We expect that this model can be refined further and improvements made by removing the detuning circuit from the CST circuit co-simulation, thereby reducing the number of ports and calculation time and improving the accuracy our SAR predictions for safety and sequence developmentAcknowledgements
No acknowledgement found.References
[1] Mikhail Kozlov, et al., “Fast MRI coil analysis based on 3-D electromagnetic and RF circuit co-simulation,” Journal of Magnetic Resonance, Volume 200, Issue 1, 2009, Pages 147-152.
[2] Mareyam A et al., “A 64-Channel 7T array coil for accelerated brain MRI,” ISMRM 2020
[3] Shajan G et al., “A 16-channel transmit 96-channel receive head coil for NexGen 7T scanner,” ISMRM 2021
[4] Grueber et al., “128-Channel head coil array for Cortical Imaging at 7 Tesla,” ISMRM 2021
[5]. Hoffmann J, et al. Safety Testing and Operational Procedures for Self-Developed Radiofrequency Coils. NMR Biomed (2016) 29(9):1131–44. doi:10.1002/nbm.3290
[6] S. N. Williams et al., “A Nested Eight-Channel Transmit Array With Open-Face Concept for Human Brain Imaging at 7 Tesla,” Front. Phys., vol. 0, 2021, doi: 10.3389/fphy.2021.701330.
Figures
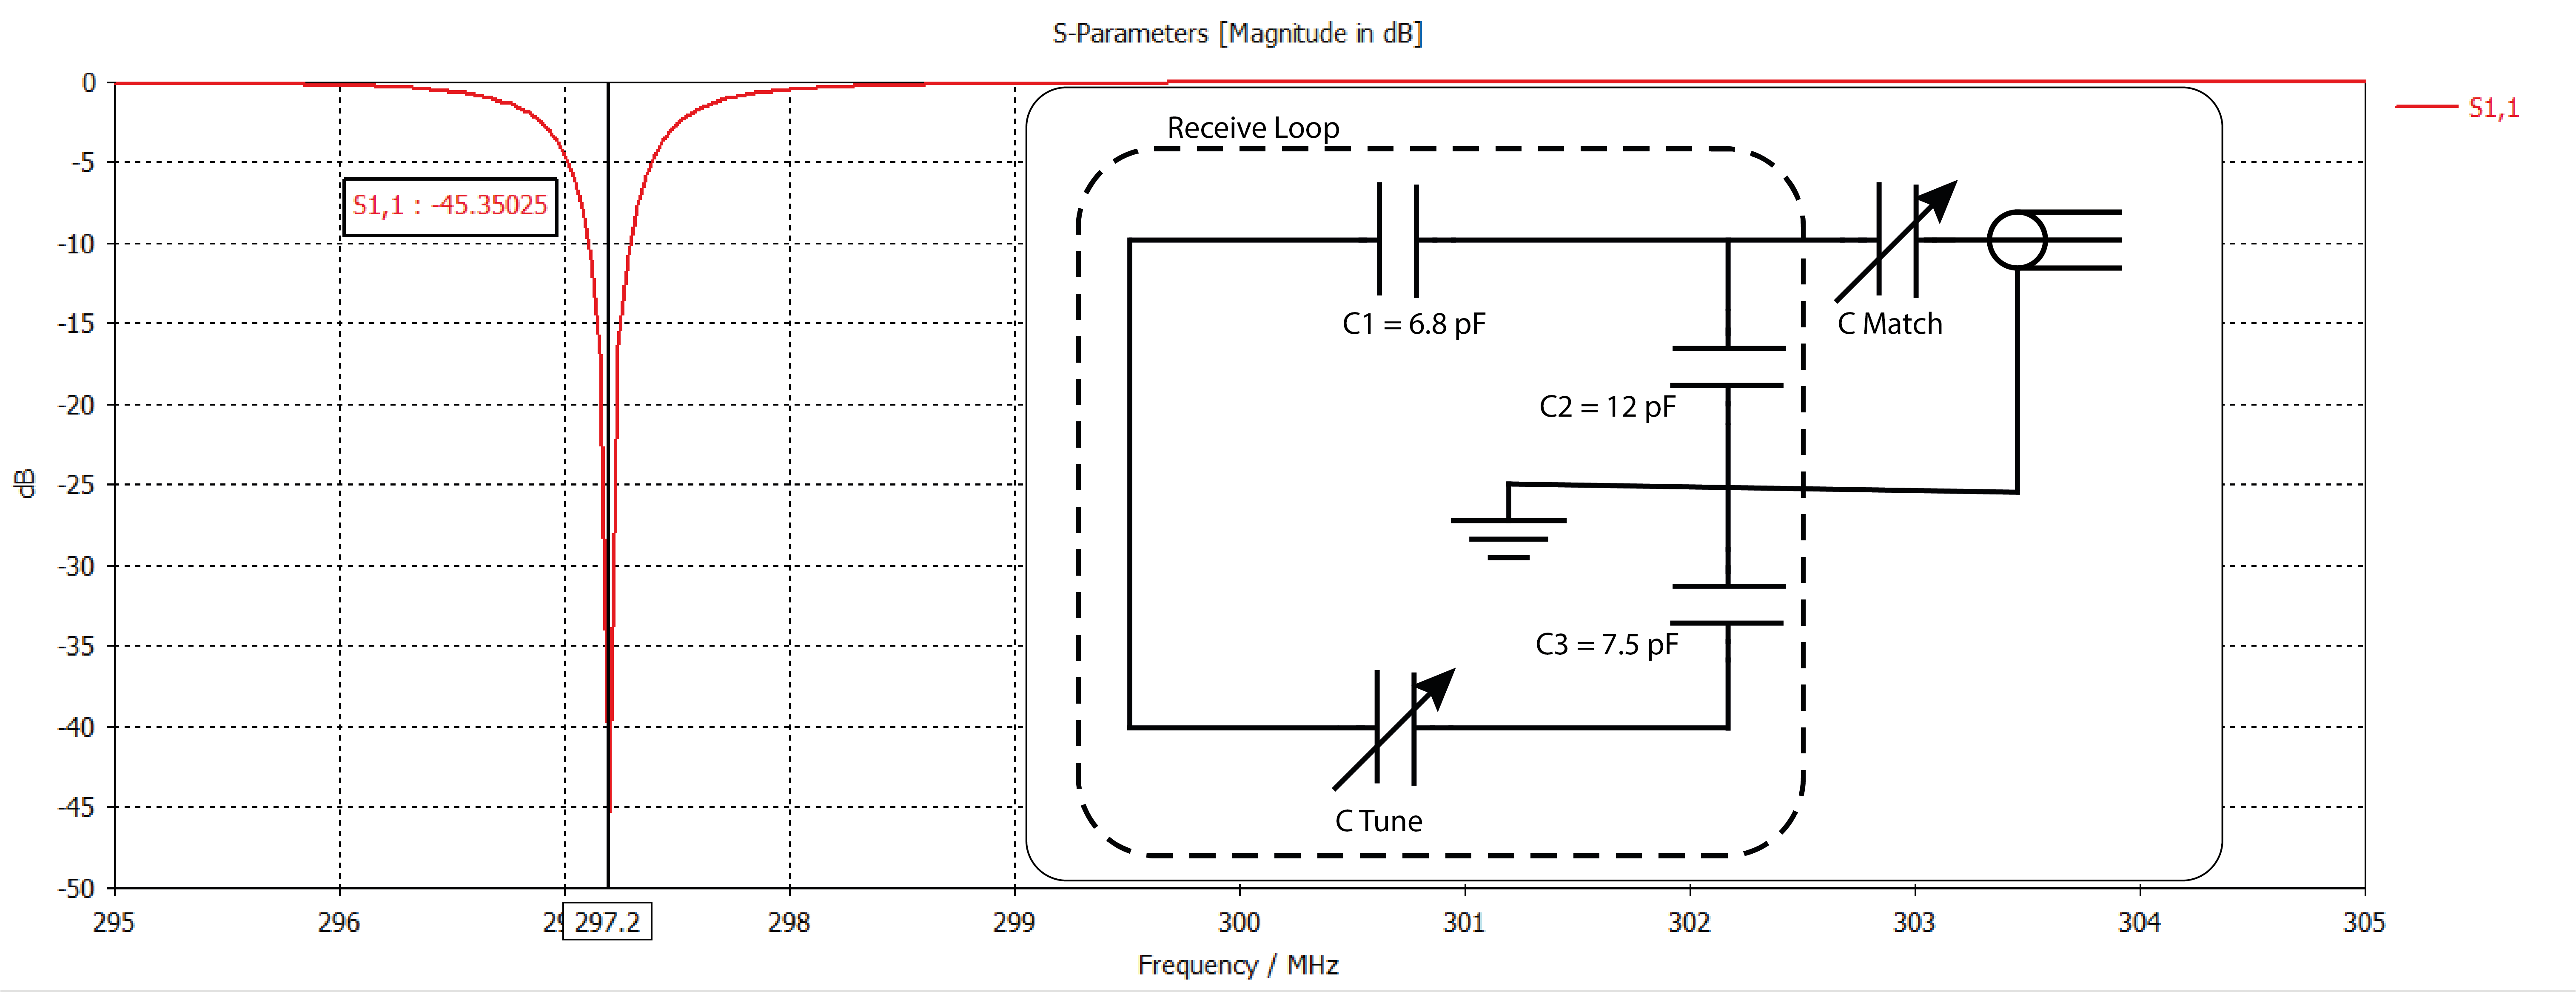
Circuit schematic showing the tuning and matching circuit, with the tuned condition shown in an S-parameter plot.
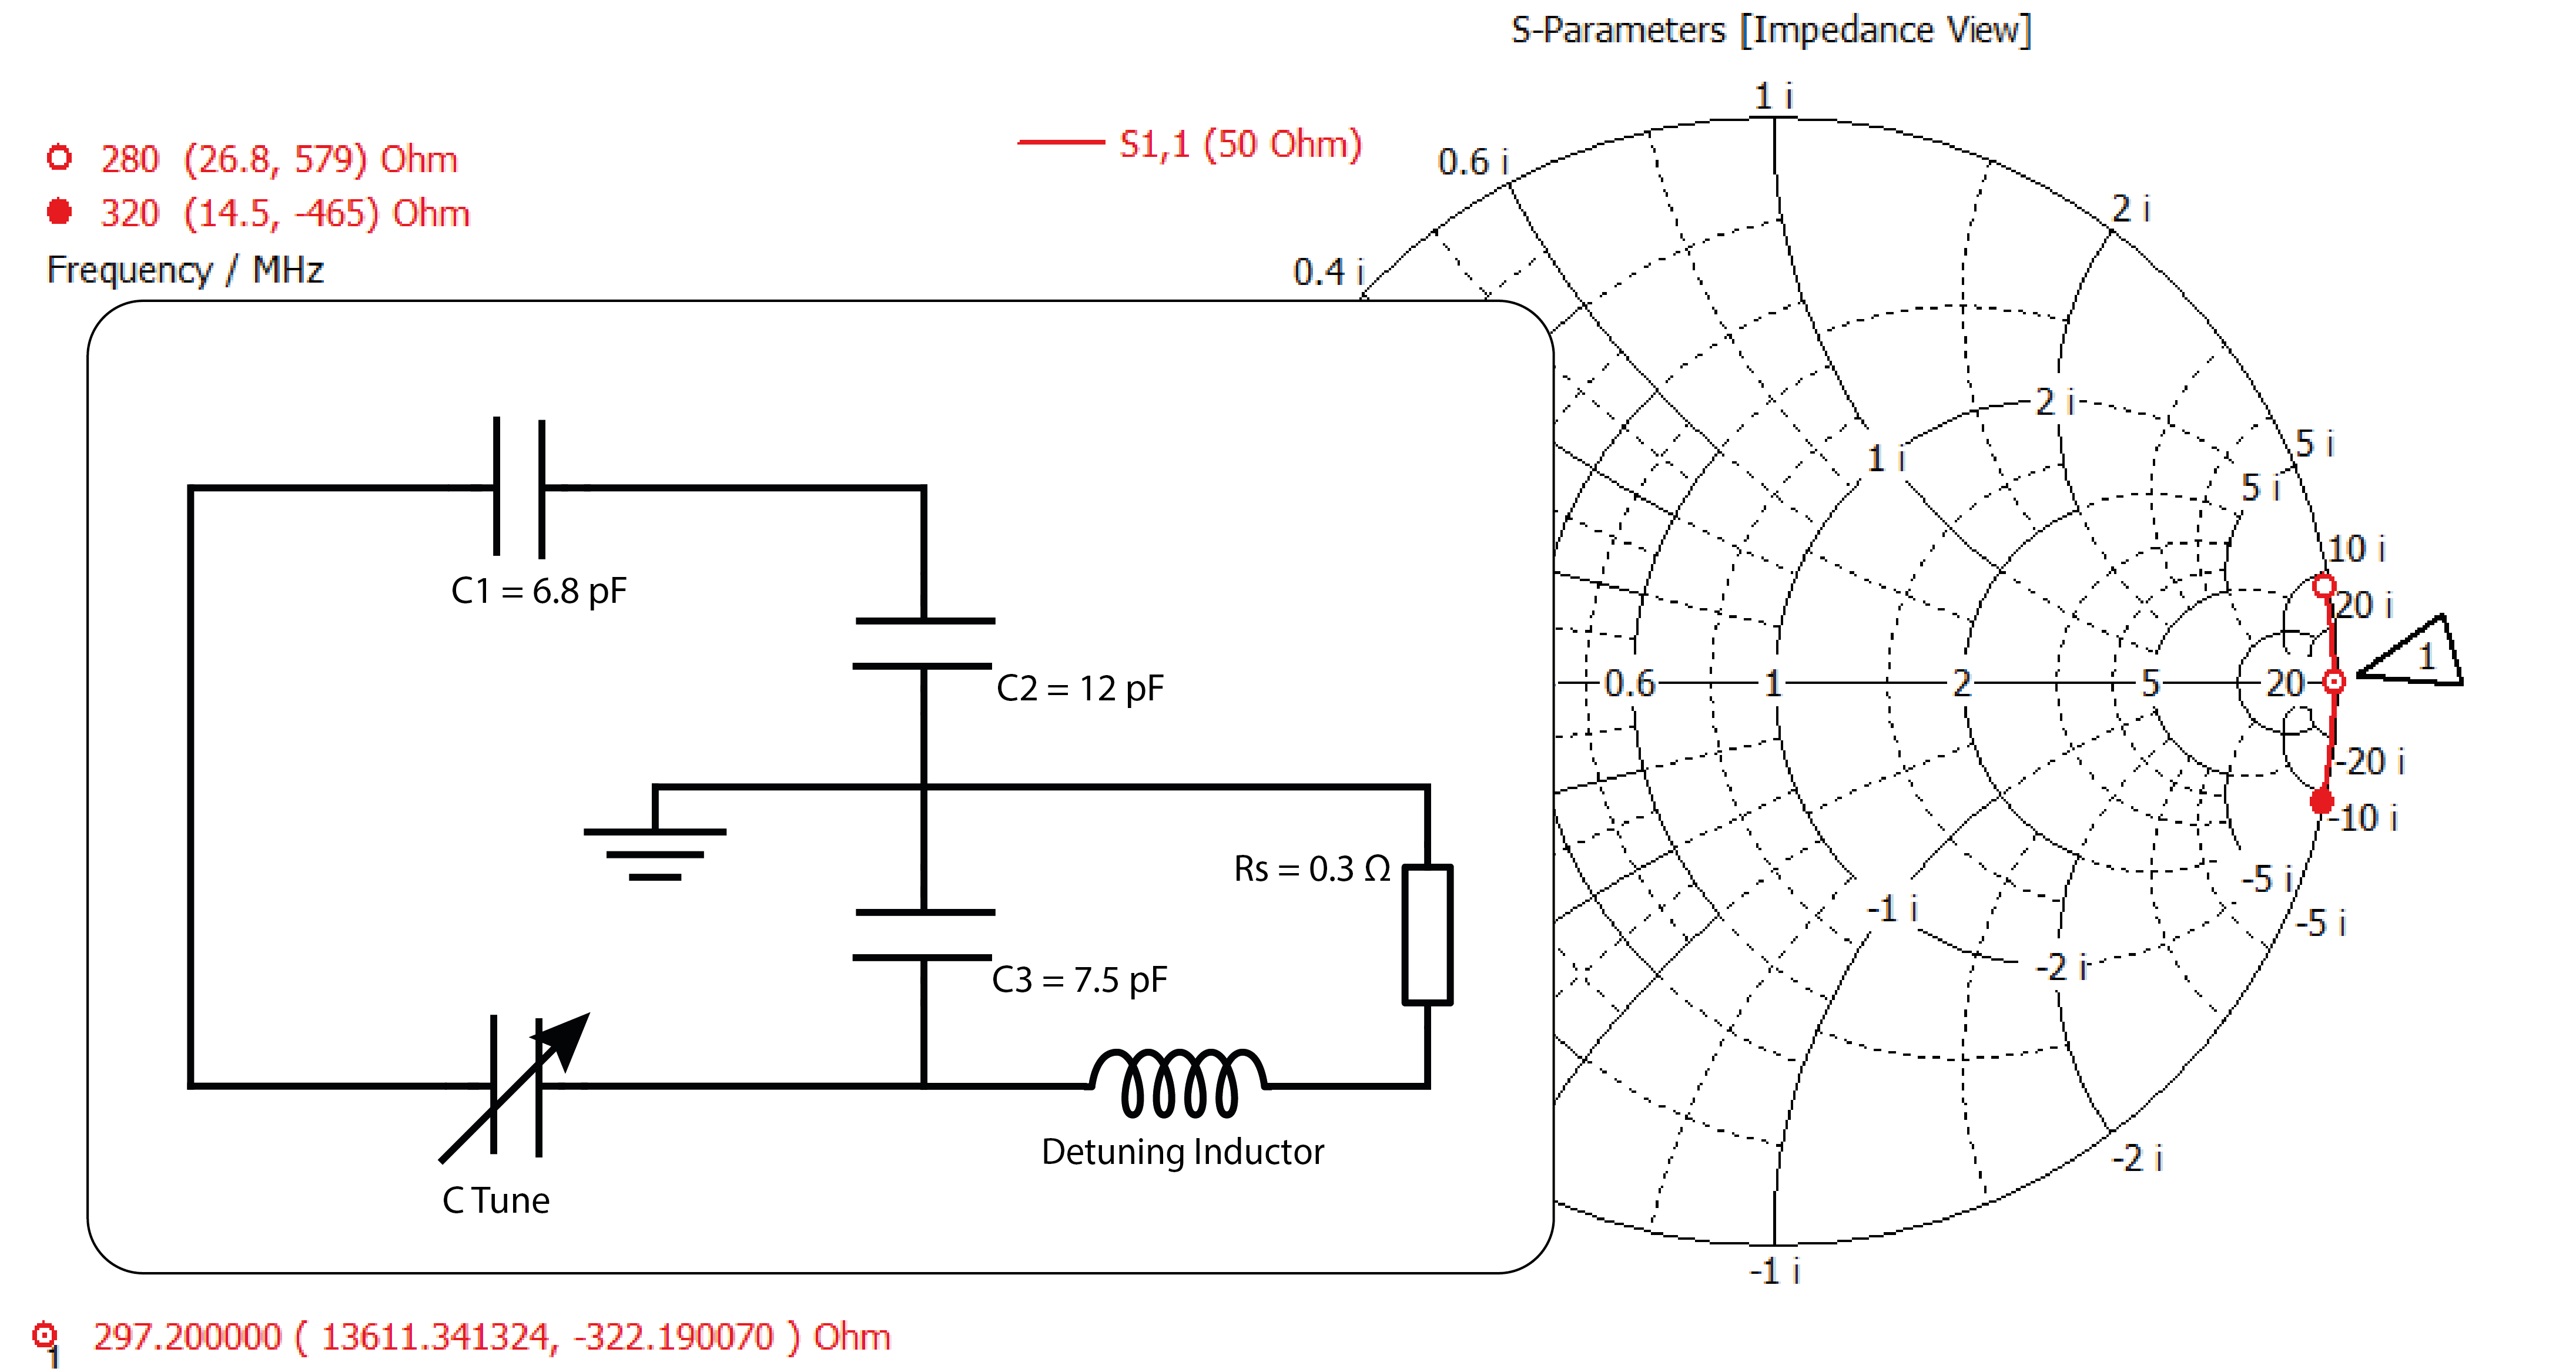
Circuit schematic showing the detuned, with the open circuit condition shown in a Smith chart.
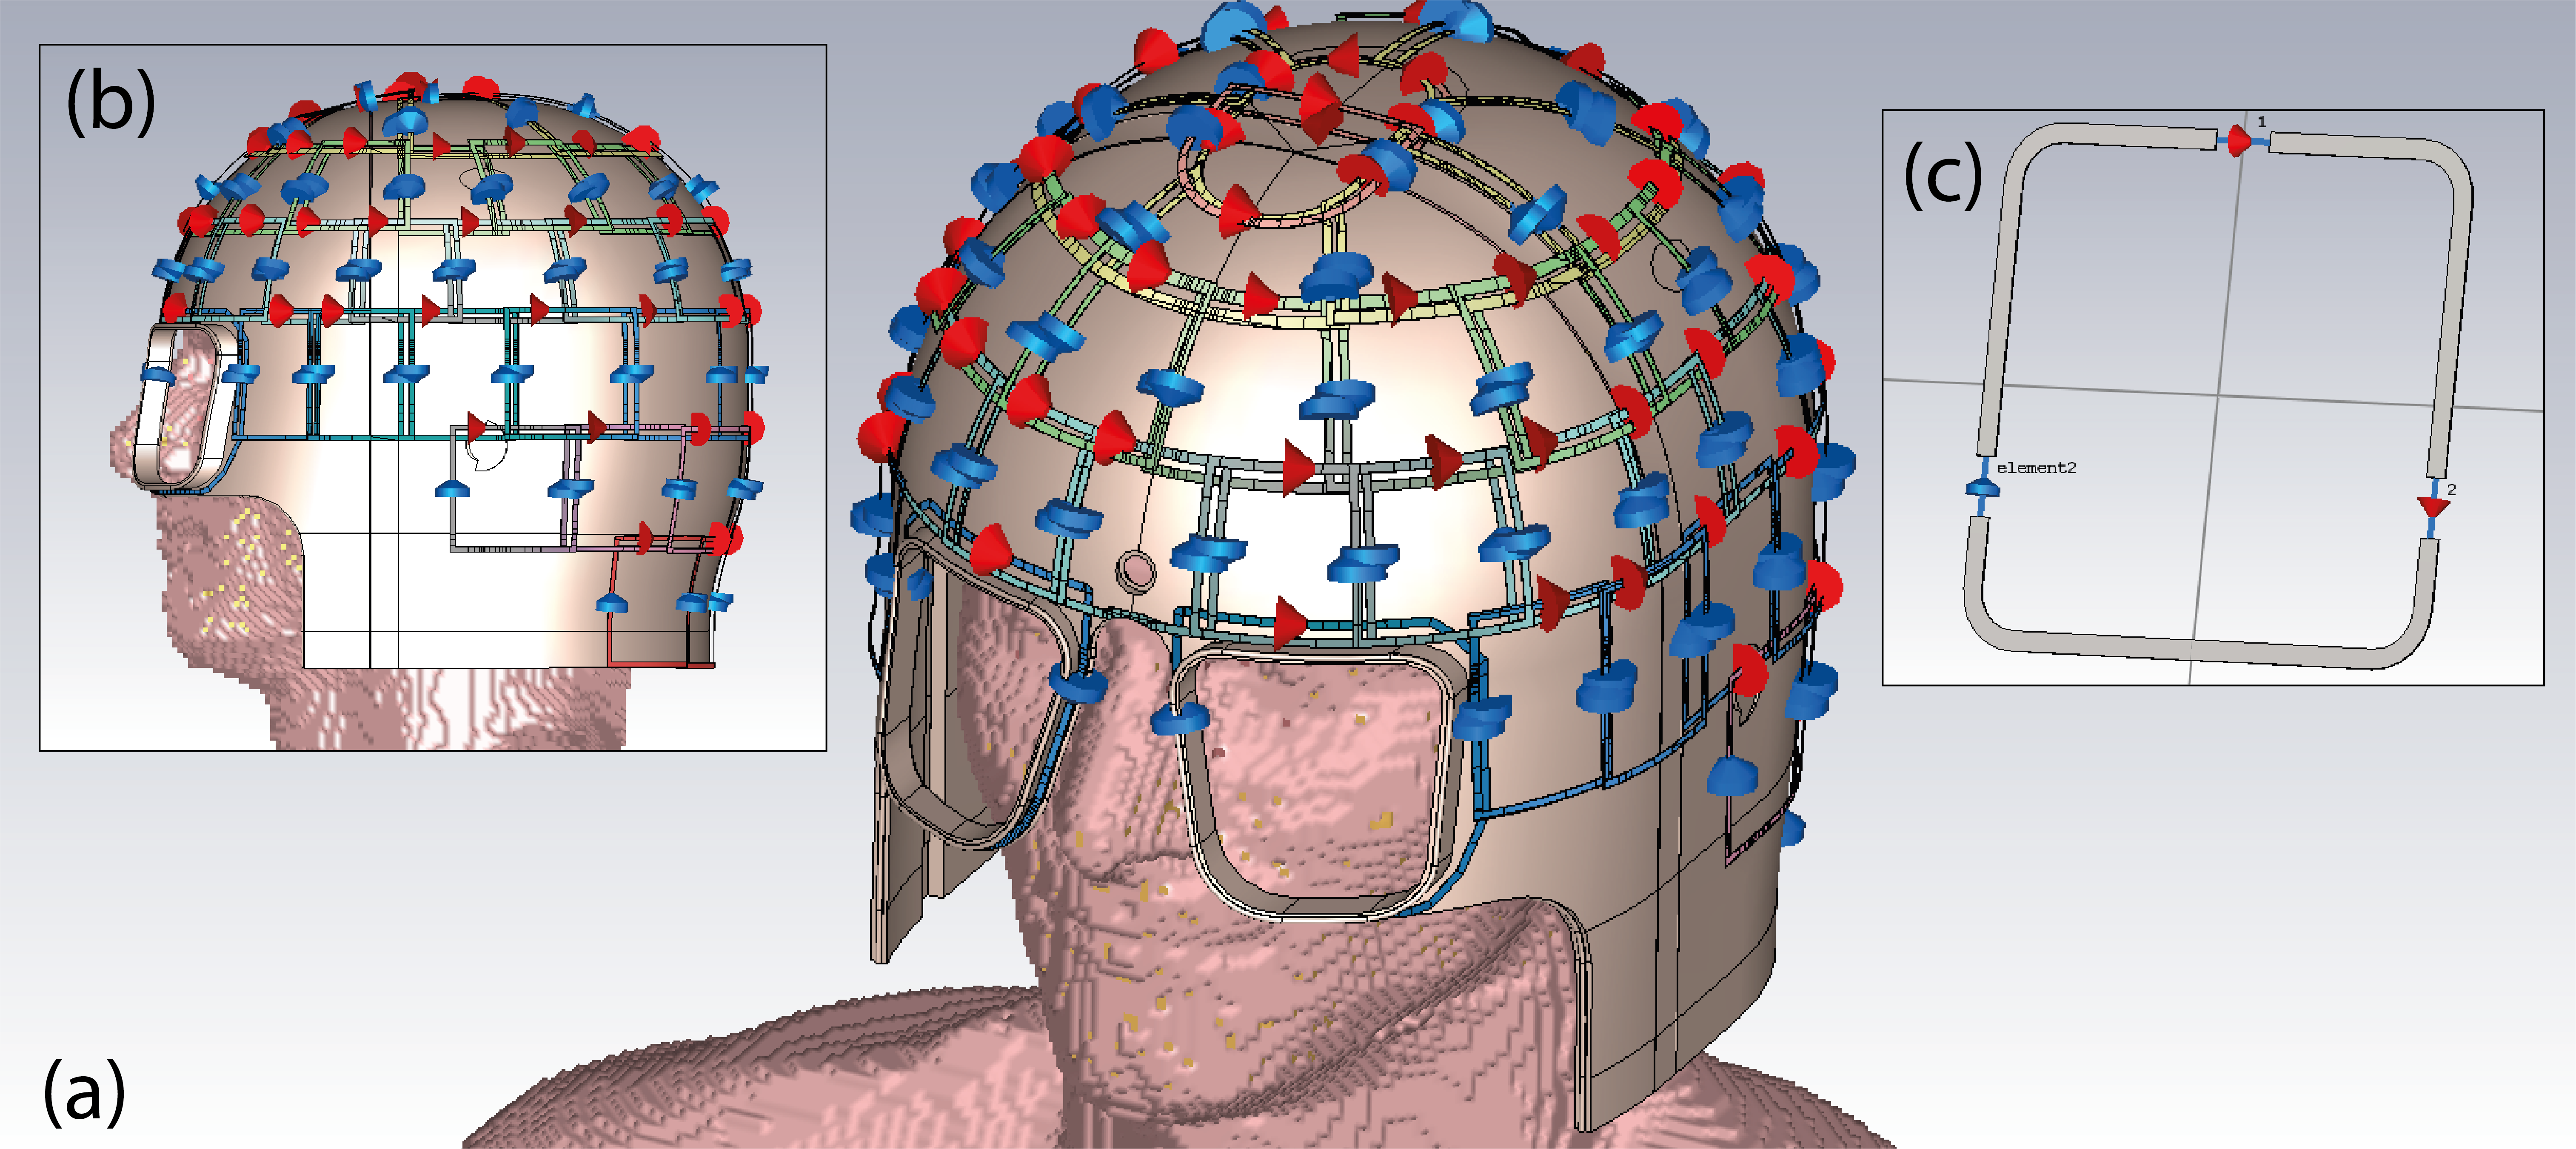
Computer CAD model demonstrating the receive coil array with ports and lumped elements (a, b) and the single loop element (c).
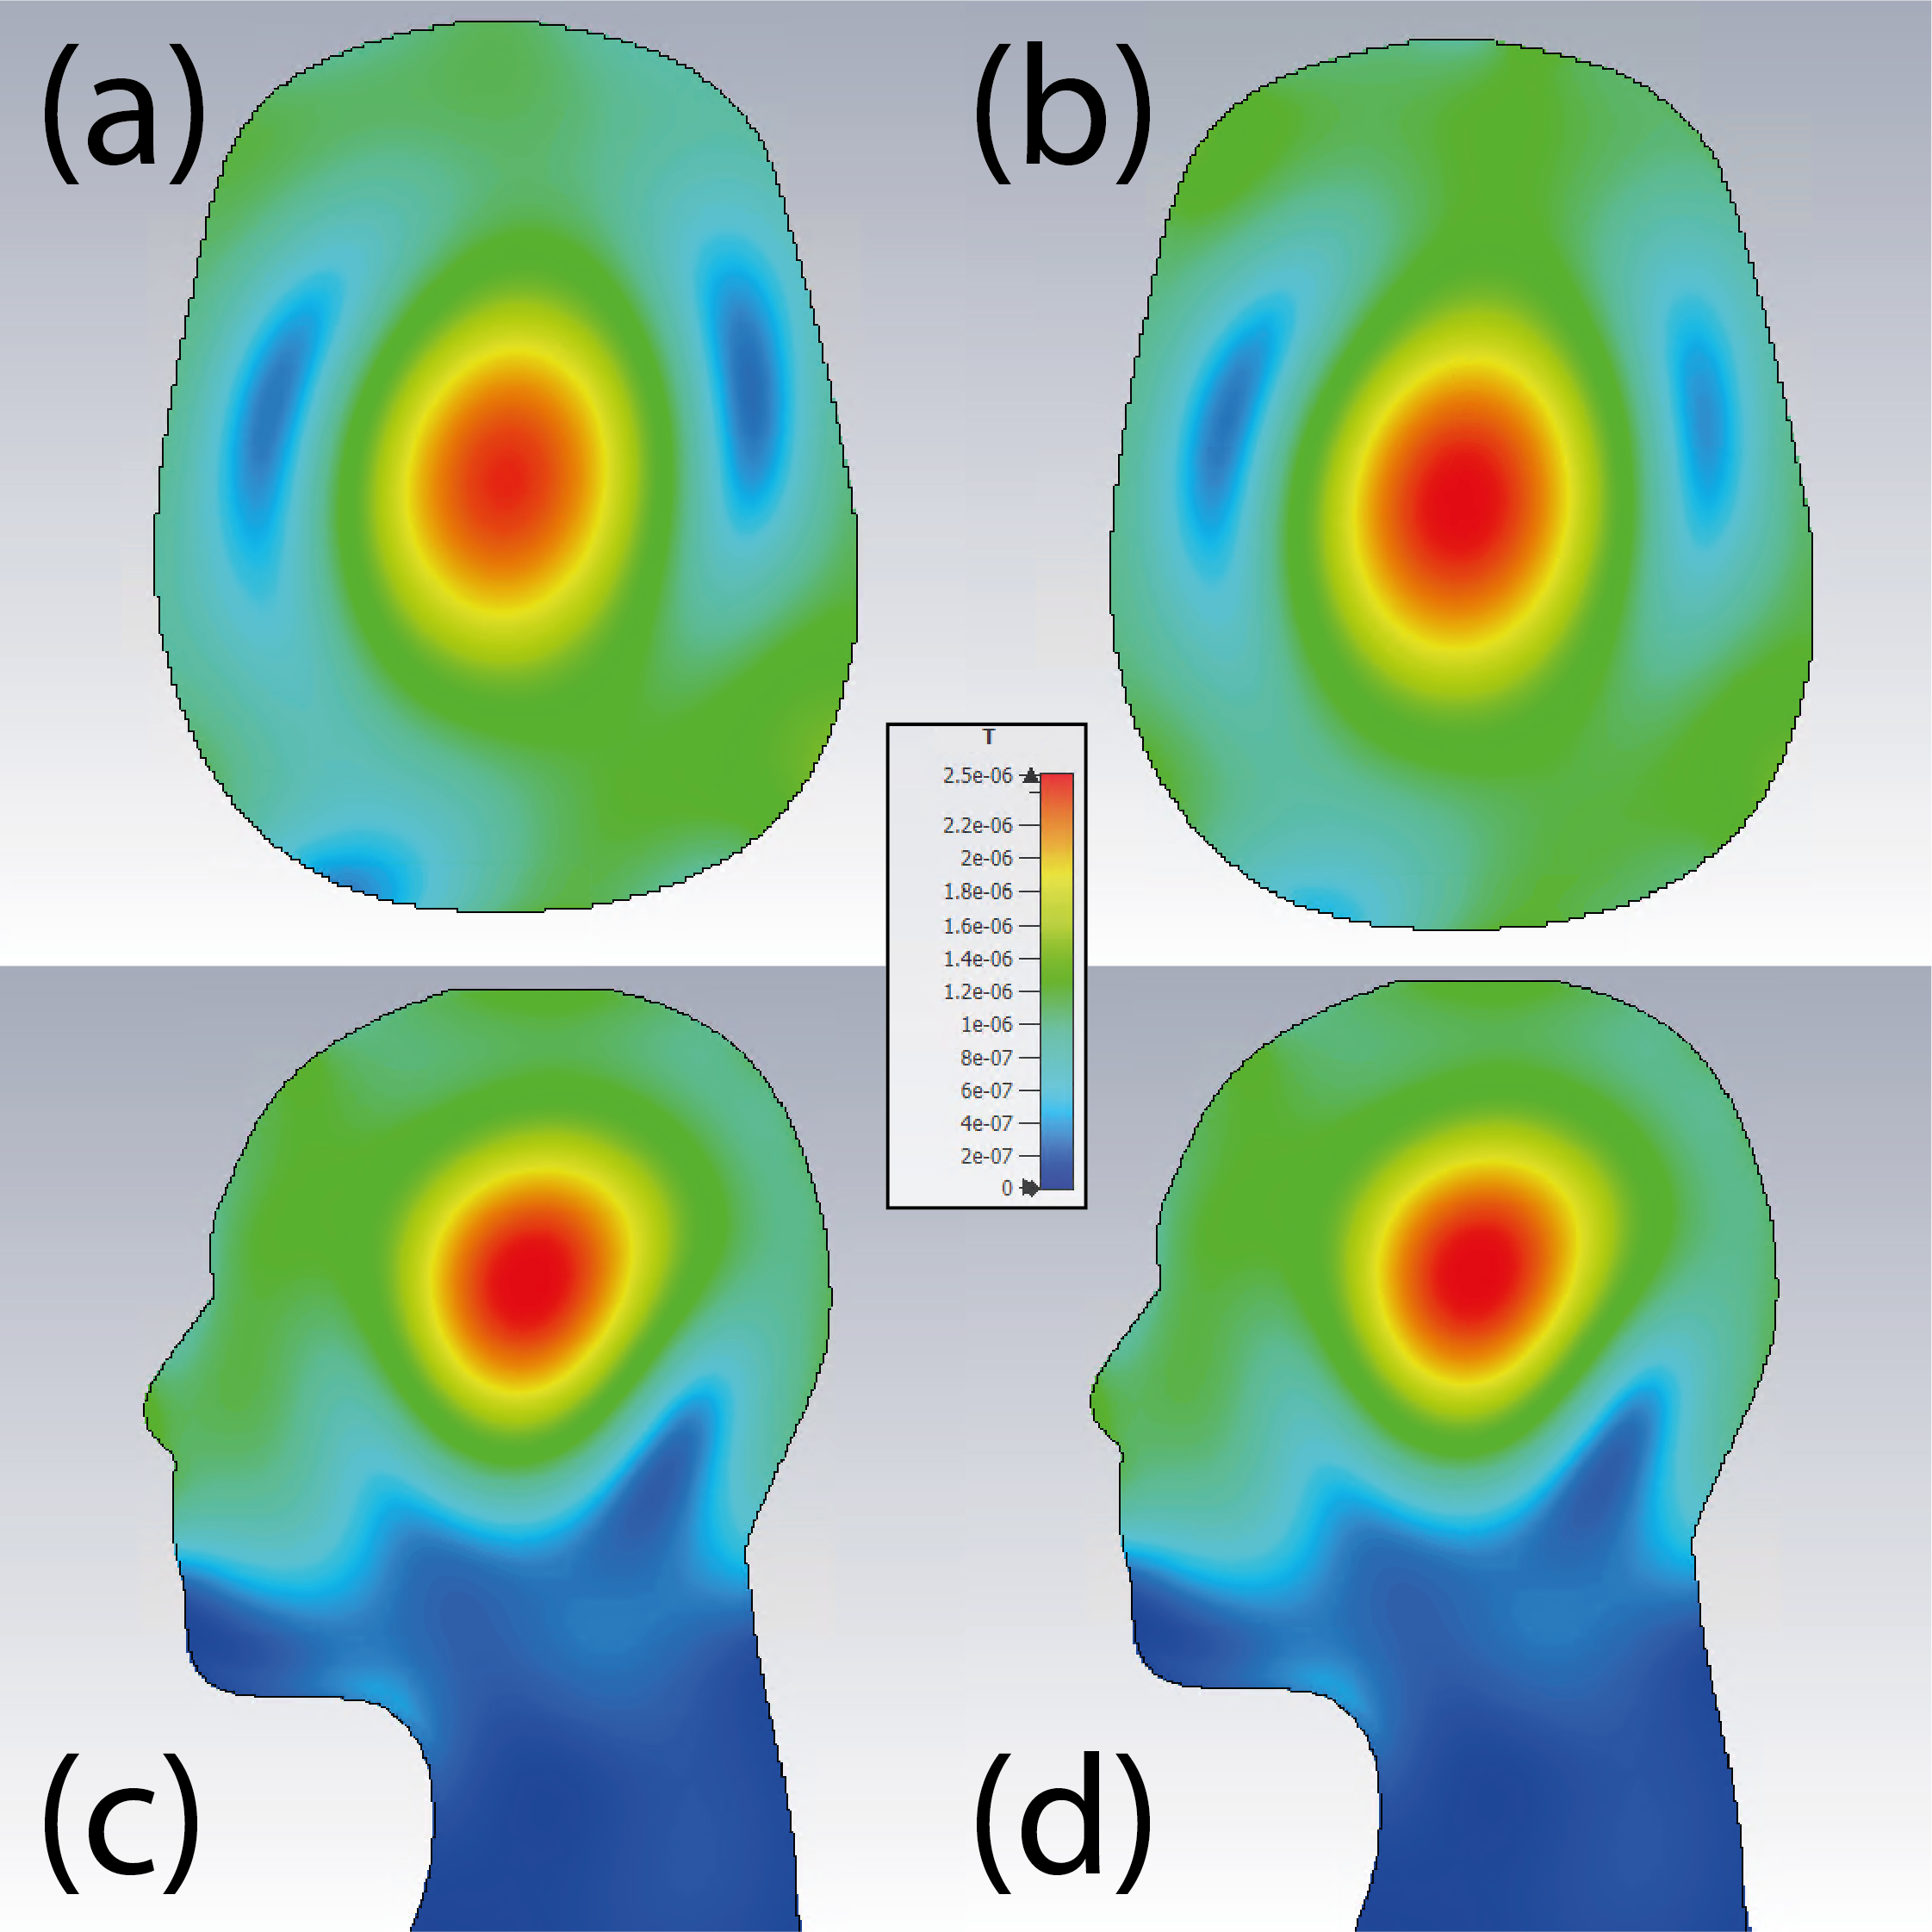
B1+ plots showing the axial and sagittal slice at isocentre, demonstrating the simulation with (b, d) and without (a, c) the receive array for 8 W excitation.
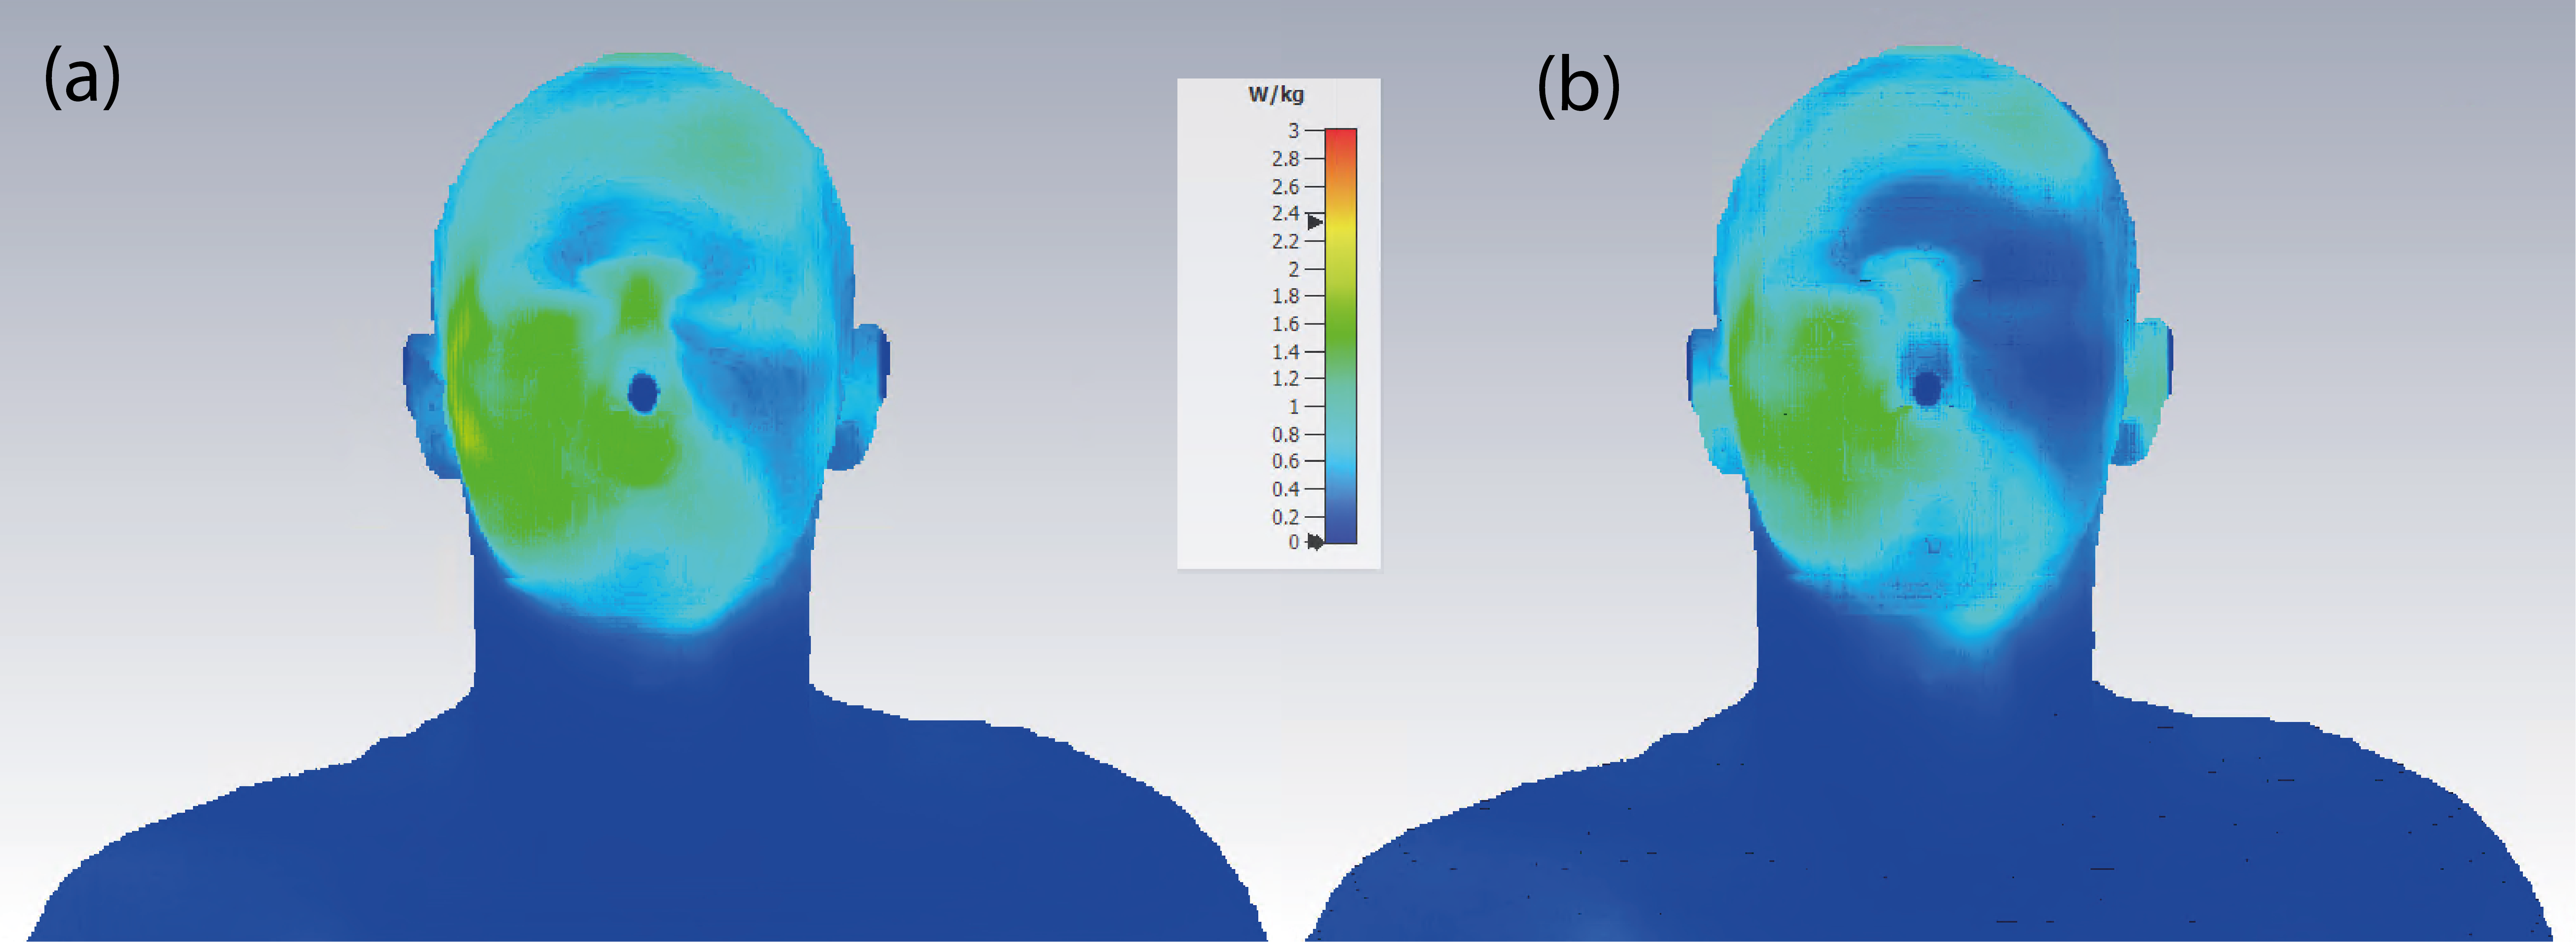
A comparison of the SAR both with (b) and without (a) the receive array in place for 8 W excitation.
DOI: https://doi.org/10.58530/2022/4819