4815
A 3D-FiLM-cGAN Architecture for the Synthesis of Cerebral Blood Flow Maps1mediri GmbH, Heidelberg, Germany, 2Universität Bremen, Bremen, Germany, 3Fraunhofer MEVIS, Bremen, Germany, 4Darmstadt University of Applied Sciences, Darmstadt, Germany, 5Amsterdam University Medical Center, Amsterdam, Netherlands
Synopsis
The presented neural network with 3D-FiLM-cGAN architecture synthesizes cerebral blood flow maps from T1-weighted input images. Acquisition- and subject-specific metadata such as sex, arterial spin labeling (ASL) method and readout techniques were fed into the neural network as auxiliary input. The multi-vendor database including different ASL sequence types was created from ADNI data which were preprocessed in ExploreASL and transformed to MNI standard space. A subset of data from a single vendor (GE) were used for supervised training exemplarily and compared to CBF from acquired ASL data.
Introduction
In an overall aging population, an increasing number of people suffer from dementia [1, 2]. Arterial spin labeling (ASL)-MRI offers a non-invasive imaging method for the analysis of cerebral blood flow (CBF) changes as an early biomarker of dementia [3]. Common methodological problems of ASL-MRI are heterogeneous acquisition protocols, acquisition time and image quality [4, 5]. To deliver diagnosis support tools, researchers have developed machine learning (ML) based applications to improve image quality, generate standard references or even to replace certain acquisitions by image synthesis [6]. Building a database suitable for ML approaches, however, requires profound knowledge of ASL-MRI and its protocol and hardware specific variations. Here, a neural network (NN) with a 3D-FiLM-cGAN architecture was developed to synthesize qualitative CBF maps based on the T1-weighted (T1w) MRI data as well as acquisition- and subject-specific metadata. The resulting generator model can be used to synthesise CBF data, which could help to provide additional information where ASL data were missing, to create reference data or to build up synthetic CBF databases [7].Methods
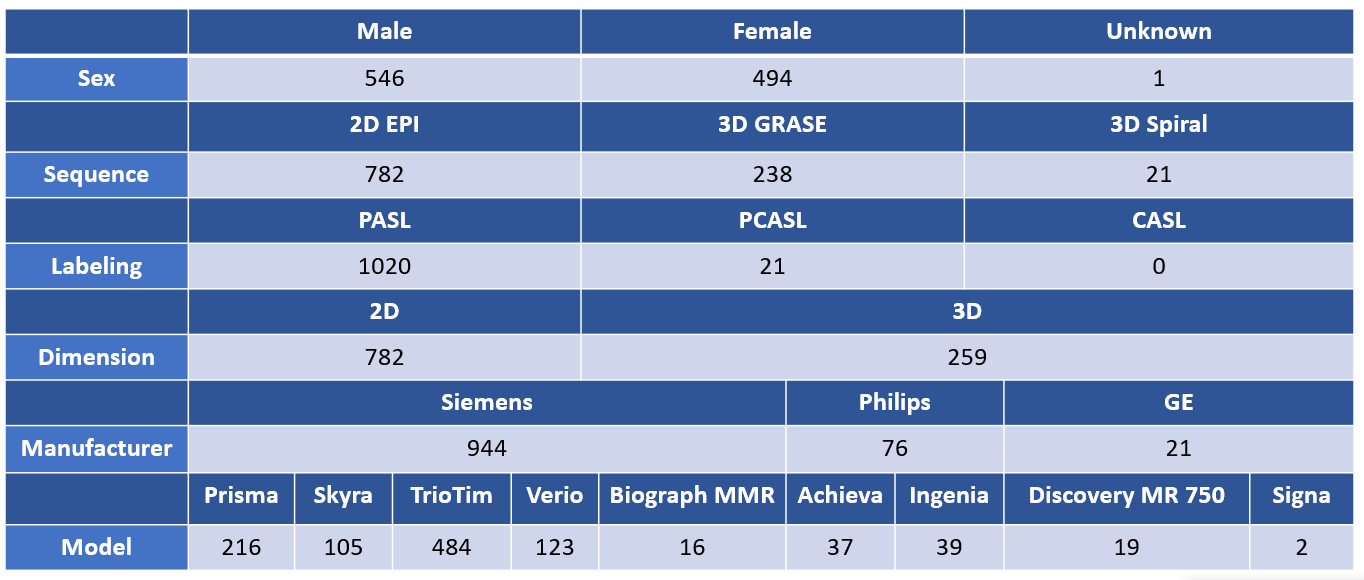
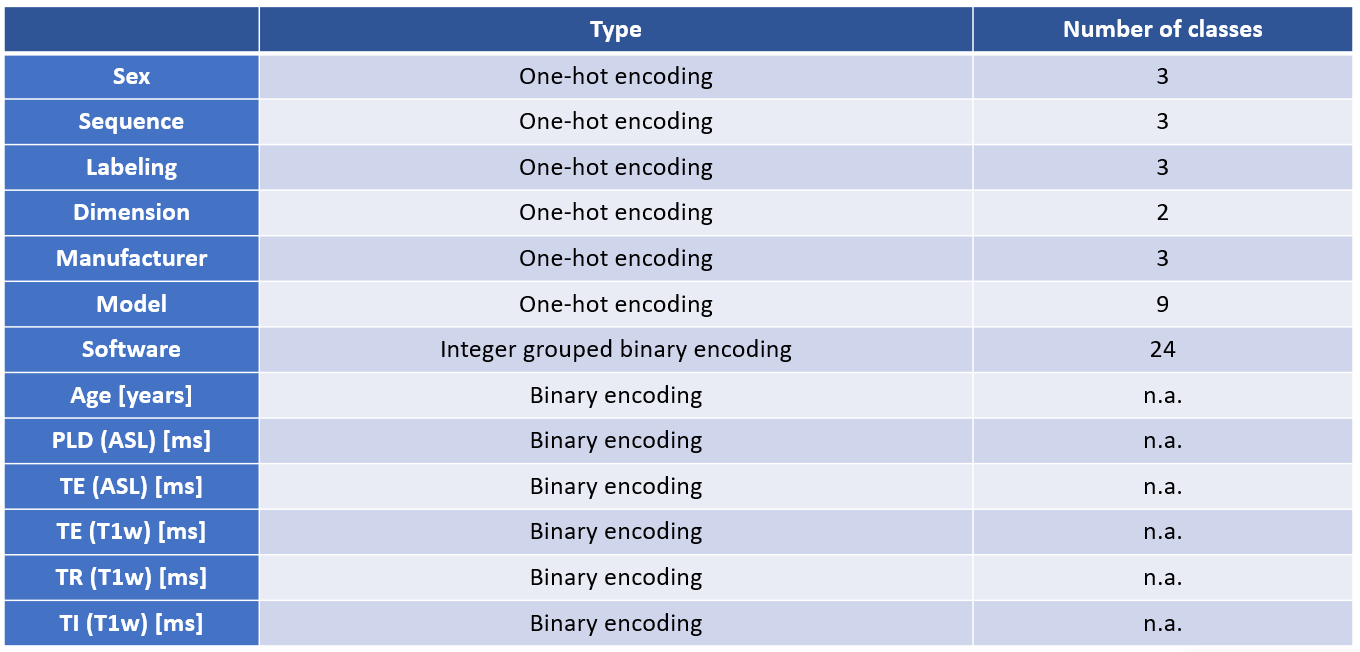
Data of 484 subjects with in total 1041 images from ADNI-GO, -2, and -3 were collected for the ML database. To reduce vendor induced image variability the presented NN was trained and tested on 21 datasets acquired with two systems (Discovery MR750 and Signa Premier, GE Healthcare, Milwaukee, WI, USA). Subjects’ average age was 76.5 years for a male to female ratio of 12:9. Data were grouped per session yielding 16 sessions for training, 4 sessions for validation and a single session for testing. Details of the database are depicted in Table 1. The resulting database includes data from clinically normal, mild cognitive impairment and dementia subjects. Data were preprocessed using the image processing framework ExploreASL [8]. Resulting MNI standard space T1w images and CBF maps were brainmasked and normalized.The presented 3D-FiLM-cGAN is inspired by two architectures for image segmentation tasks. In the so-called Vox2Vox-3D-cGAN [9] the generator is replaced by a modified 3D-FiLM-U-Net to allow metadata input [10, 11]. Due to hardware limitations the number of filters in the generator is reduced to 16. As shown in Table 1 and 2 thirteen relevant features from metadata were selected and encoded for additional input to the FiLM layer. Four FiLM layers were inserted in total, two in the first and second level of the contracting path and two at the end of the expansive path of the 3D generator U-Net. Training was performed on a 16 GB NVIDIA Tesla T4 graphics card. The Adam optimizer started with an initial learning rate of 0.001 (decay 5% every second epoch) [12]. Different combinations of loss functions for generator (MSE, dice) and discriminator (MSE) were tested. The resulting total loss controls the optimizer. Monitoring of different metrics suggested to terminate the training after 50 epochs.Results
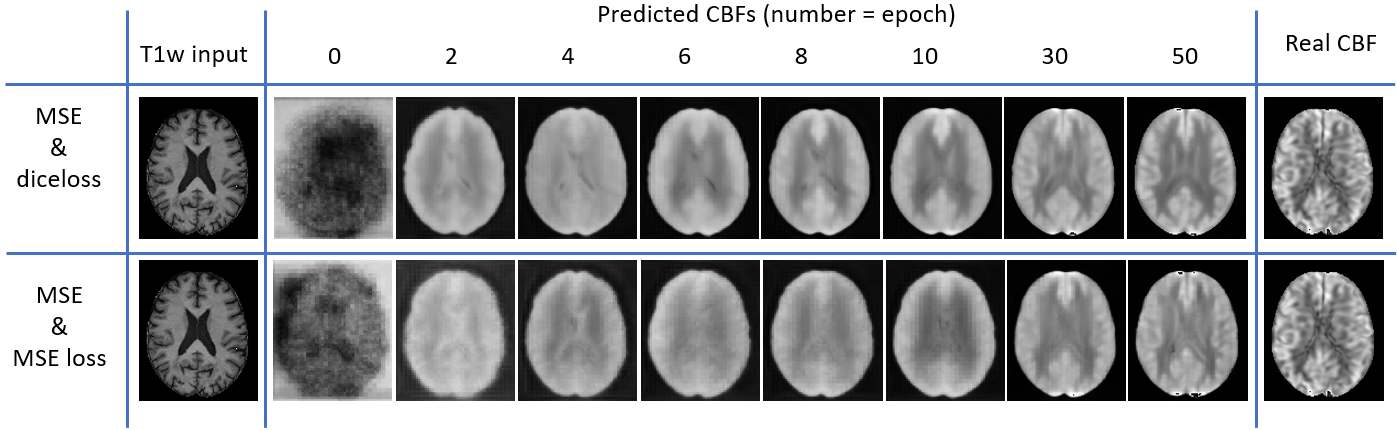
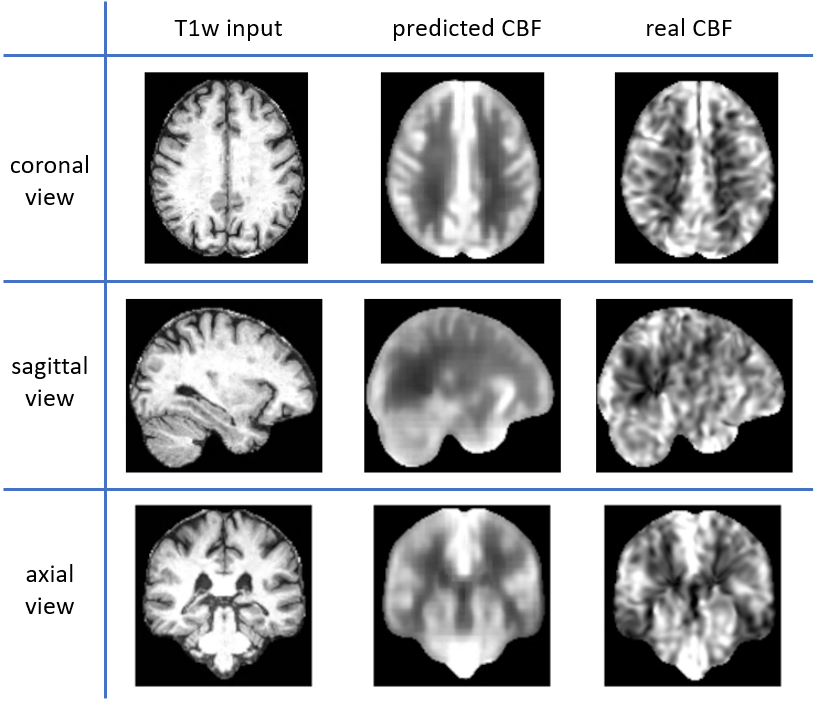
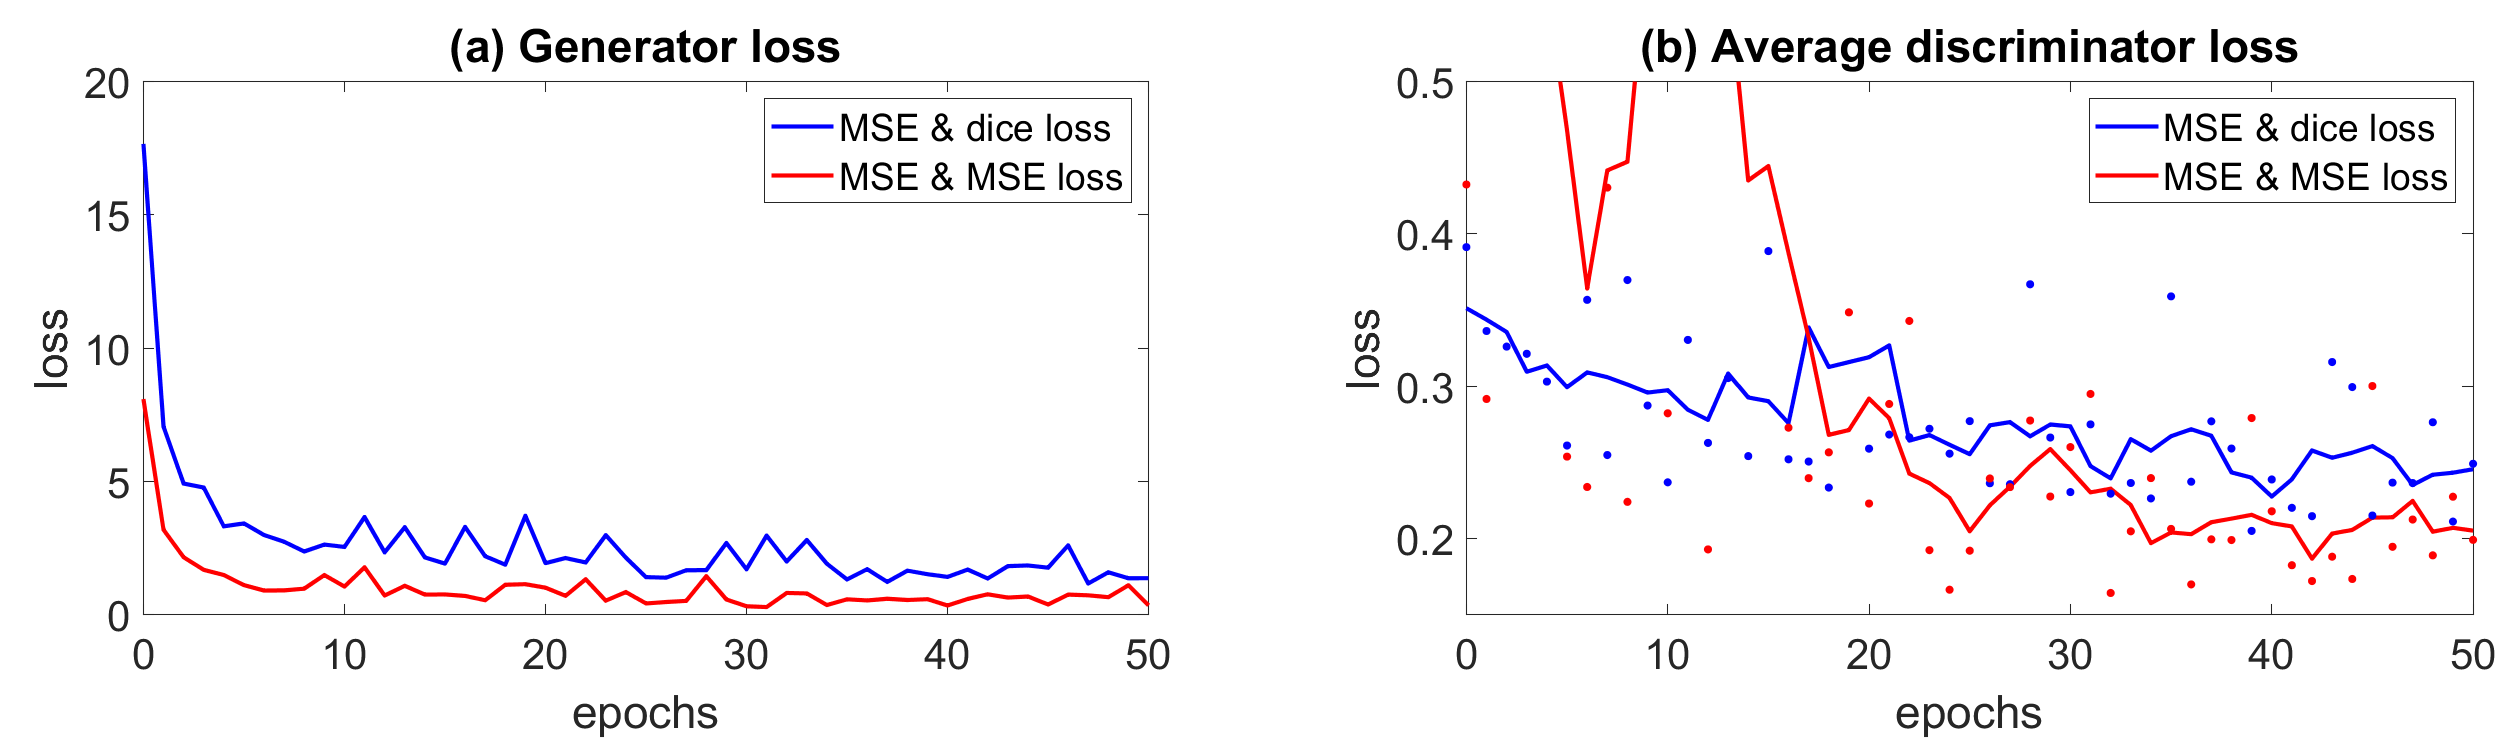
The visual comparison of the predicted and real CBF (ground truth) is shown in Figure 1. The development of the prediction over the training epochs depicts that typical T1w structures e.g. the ventricular system change in contrast as gray and white matter regions do. After 30 epochs more details appear in the prediction that correspond to CBF patterns in the ground truth. An overview across the complete volume is displayed in Figure 2. Figure 3 summarizes the monitoring of the training. Figure 1a shows the evolution of the total loss: MSE + dice loss (blue) and MSE + MSE (red). Using only MSE loss functions lead to a less stable convergence of the discriminator (Figure 1b).Discussion
Our findings show that the 3D-FiLM-cGAN can reliably predict synthetic CBF maps from T1w input images. Even though the amount of input data is limited, the results are promising to support the diagnostic decision process in cases where ASL measurements were corrupted or not available. Moreover, CBF has very high physiological variability, including its dependency on age, sex, and brain structure. Therefore, an individualized reference CBF image could help clinicians to identify abnormal CBF regions in an earlier stage. These findings suggest establishing more comprehensive databases that allow generation of more generalisable synthetic models based on this architecture. Having such general models to synthesise CBF maps will help to complete existing databases where CBF data are missing.Acknowledgements
This work is part of the Eurostars Project ASPIRE 01QE2026A, funded by the BMBF (Germany), Innovate UK, and the Netherlands Enterprise Agency. Data used in preparation of this abstract were obtained from the Alzheimer’s Disease Neuroimaging Initiative (ADNI) database (adni.loni.usc.edu). A complete listing of ADNI investigators can be found at: http://adni.loni.usc.edu/wp-content/uploads/how_to_apply/ADNI_Acknowledgement_List.pdfReferences
[1] L. Jönsson, W. Anders et al., The cost of dementia in Europe, Pharmacoeconomics 2009.
[2] Alzheimer Europe, Cost of illness and burden of dementia in Europe - Prognosis to 2030, accessed 2021-11-10, online resource: https://www.alzheimer-europe.org/Research/European-Collaboration-on-Dementia/Cost-of-dementia/Prognosis-to-2030
[3] D. Alsop et al., Recommended implementation of arterial spin‐labeled perfusion MRI for clinical applications: A consensus of the ISMRM perfusion study group and the European consortium for ASL in dementia, Magnetic resonance in medicine, 2015
[4] J.C. Ferré et al., Arterial spin labeling (ASL) perfusion: techniques and clinical use, Diagnostic and interventional imaging, 2013
[5] M. Grade et al., A neuroradiologist’s guide to arterial spin labeling MRI in clinical practice, Neuroradiology, 2015
[6] B. Yu et al., 3D cGAN based cross-modality MR image synthesis for brain tumor segmentation, 15th International Symposium on Biomedical Imaging, IEEE, 2018
[7] F. Li, A new VAE-GAN model to synthesize arterial spin labeling images from structural MRI, Displays, 2021
[8] H. J. Mutsaerts, ExploreASL: an image processing pipeline for multi-center ASL perfusion MRI studies, Neuroimage, 2020
[9] M. Cirillo et al., Vox2Vox: 3D-GAN for Brain Tumour Segmentation, arXiv, 2020
[10] E. Perez, FiLM: Visual Reasoning with a General Conditioning Layer, arXiv, 2018
[11] A. Lemay et al., Benefits of Linear Conditioning with Metadata for Image Segmentation, MIDL, 2021
[12] D.P. Kingma, B. Jimmy et al., Adam: A method for stochastic optimization, arXiv preprint, 2014
Figures