4814
Exploring the potential of StyleGAN projection for quantitative maps from diffusion-weighted MR images
Daniel Güllmar1, Wei-Chan Hsu1,2, Stefan Ropele3, and Jürgen R. Reichenbach1,2
1Institute of Diagnostic and Interventional Radiology, Medical Physics Group, Jena University Hospital, Jena, Germany, 2Michael Stifel Center Jena for Data-Driven and Simulation Science, Jena, Germany, 3Division of General Neurology, Medical University Graz, Graz, Austria
1Institute of Diagnostic and Interventional Radiology, Medical Physics Group, Jena University Hospital, Jena, Germany, 2Michael Stifel Center Jena for Data-Driven and Simulation Science, Jena, Germany, 3Division of General Neurology, Medical University Graz, Graz, Austria
Synopsis
Synthetic medical images can be generated with a StyleGAN and are indistinguishable from real data even by experts. However, the projection of real data via latent space onto a synthetic image shows clear deviations from the original (at least on the second image). This plays a major role especially when using GANs to perform tasks such as image correction (e.g. noise reduction), image interpolation or image interpretation by analyzing the latent space. Based on the results shown, it is highly recommended to perform an analysis of the projection accuracy before applying any of these applications.
Introduction
The implementation of StyleGAN (Stylegan2-with-ADA) shows what is currently state-of-the-art in the field of generative neural networks. This technique has already enabled to generate artificial medical imaging data that even experts cannot distinguish from real data. Very interesting and promising seems to be GAN inversion, where the objective is to generate a synthetic data set that resembles a real data set. Besides the fact that the projection into the latent-space offers the possibility to manipulate the data by a controlled change of attributes, it can be assumed that a direct inversion leads to a discrepancy between the real data set and the projected data set, which might has hidden features. Therefore, the aim of our study was to explore projection of data by comparing real images with their corresponding projected version including artificial modification and data showing pathological patterns. For this aim maps of fractional anisotropy were used.Material and Methods
Diffusion-weighted MR data were acquired using two diffusion-weighted echo planar imaging (EPI DWI) scans with reversed phase-encoding polarities. The DWI data were preprocessed using FSL [1,2]. Fractional anisotropy (FA) were obtained by fitting the data to the diffusion tensor model (Mrtrix3 [3]). FA maps of 408 DWI-datasets were rigidly aligned with an FA template in MNI space using Aladin from NiftyReg [4]. 79 (out of 408) datasets were taken from healthy subjects and the remaining data were acquired on MS patients. The model training was performed using 21 axial slices from each of the individual data sets summing up to 8568 training data samples. A StyleGAN2-ADA software implementation [5] was used to train the model with the following parameters: learning rate of 0.002 and 0.0023 for the generator and discriminator respectively, non-saturating logistic loss with R1 regularization and Adam optimizer with β1= 0, β2= 0.99, and ϵ= 10−8. The dataset was augmented by horizontal mirroring and geometric transformations dynamically during the training process. Training was carried out on a NVIDIA GPU for approximately 13 days. After training of 18.600 kimg a minimal FID of 3.87 was achieved. For the projection of real image data (axial FA maps), we used the following strategy. The goal of projection is to find an intermediate latent code w that can generate a target image. Thus, the projection is an optimizing process by minimizing the perceptual similarity distance using a pre-trained VGG16. A latent code z is randomly initialized and passed to the trained StyleGAN2 model to generate an image based on that latent code. The VGG16 embeddings from the generated and target image are used to calculate the perceptual distance, which is minimized to obtain the optimal intermediate latent code w. We used 1000 iterations for the estimation of the latent code for each individual dataset. The projection was estimated for regular unmodified samples taken from the training dataset, as well as from modified version of it (e.g. by adding gaussian noise, salt and pepper noise, inpainting, blurring). We also took a closer look at samples of patient with severe MS related lesion patterns.Results
Figure 1 shows exemplary results for the projection of target (real) images and their corresponding projection in combination with a color coded difference map. The difference maps are accompanied with the corresponding difference measures structural similarity index measure (SSIM) and mean squared error (MSE). Although the projected images appear very real and very similar to the corresponding original images, clear topological differences can be found especially in cortical areas by the difference images. However, the high values for SSIM (approx. 0.85) and the low values for MSE (on average < 0.0045) indicate a consistent quality when projecting real data with the trained GAN. Figure 2 shows the projection of a real data set in a similar setup as Figure 1. In addition, modifications were made to this data set and then the projection was repeated for the modified data set. The differences and associated distance measures shown were calculated between the projected and unmodified data sets. While the projection of the noisy data show a significantly greater distance from the original, the projections of the inpaintings and the blurred version show a numerically higher similarity to the original. Figure 3 shows two examples for the projection of real FA images of patients showing severe MS related lesions. Although the model was largely trained on patient data, the area containing lesions in the projection appears to have been reconstructed normally. In the difference images, there is a clear correspondence to the lesions present in the flair contrast. The calculated distance measures appear here as less informative to indicate a strong deviation between original and projection.Discussion
In this study, we investigated the projection of real data (2D axial FA layers) using a StyleGAN. Despite apparent strong similarity of the projections to the originals, discrepancies were evident. Of particular interest seems to be the fact that pathological patterns could not be correctly mapped in the data. While this opens up the potential of using this technique to detect pathologies, it raises the question of whether pathological patterns are represented in the GAN and whether it can really be used to perform image interpretation and analysis.Acknowledgements
This work was supported in parts by the German Research Foundation (RE1123/21-1, TI239/17-1, DE2616/1-1), the Austrian Science Fund (FWF3001-B27) and the Carl-Zeiss-Foundation (CZ-Project: Virtual Workshop).References
- Andersson, Jesper L. R., Stefan Skare, and John Ashburner. 2003. “How to Correct Susceptibility Distortions in Spin-Echo Echo-Planar Images: Application to Diffusion Tensor Imaging.” NeuroImage 20 (2): 870–88.
- Andersson, Jesper L. R., and Stamatios N. Sotiropoulos. 2016. “An Integrated Approach to Correction for Off-Resonance Effects and Subject Movement in Diffusion MR Imaging.” NeuroImage 125: 1063–78.
- Tournier, J-Donald, Robert Smith, David Raffelt, Rami Tabbara, Thijs Dhollander, Maximilian Pietsch, Daan Christiaens, Ben Jeurissen, Chun-Hung Yeh, and Alan Connelly. 2019. “MRtrix3: A Fast, Flexible and Open Software Framework for Medical Image Processing and Visualisation.” NeuroImage 202: 116137.
- Ourselin, S, A Roche, G Subsol, X Pennec, and N Ayache. 2001. “Reconstructing a 3d Structure from Serial Histological Sections.” Image Vis. Comput. 19 (1): 25–31.
- Karras T, Aittala M, Hellsten J, Laine S, Lehtinen J, Aila T. Training generative adversarial networks with limited data. arXiv preprint arXiv:2006.06676. 2020 Jun 11.
Figures
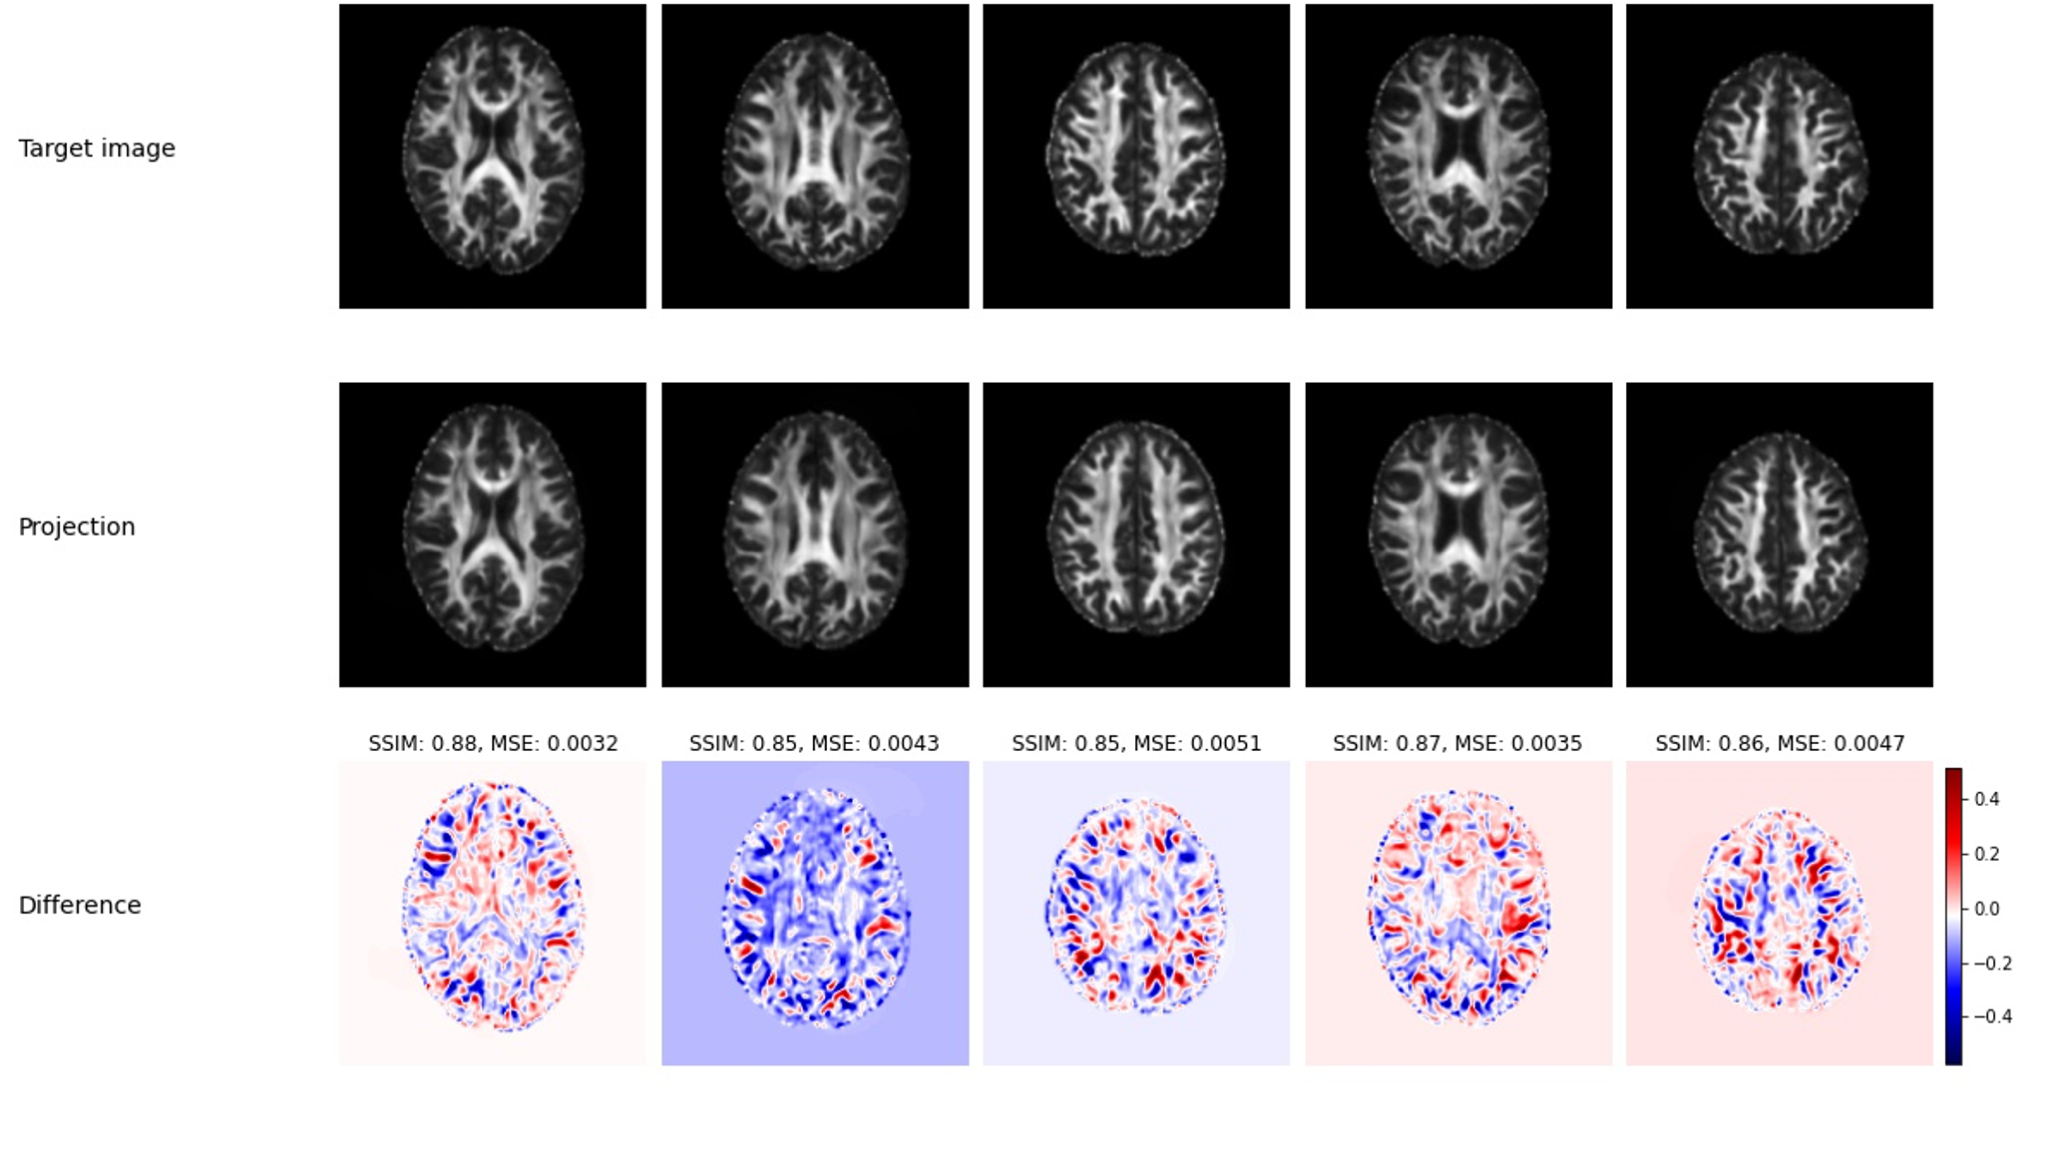
Fig. 1 Examples
of projected 2D FA axial images. The
upper row shows the original “target” images, which were taken from the real
data population. The middle row shows the corresponding projected images and
the third row displays the related differences in a blue-white-red colormap.
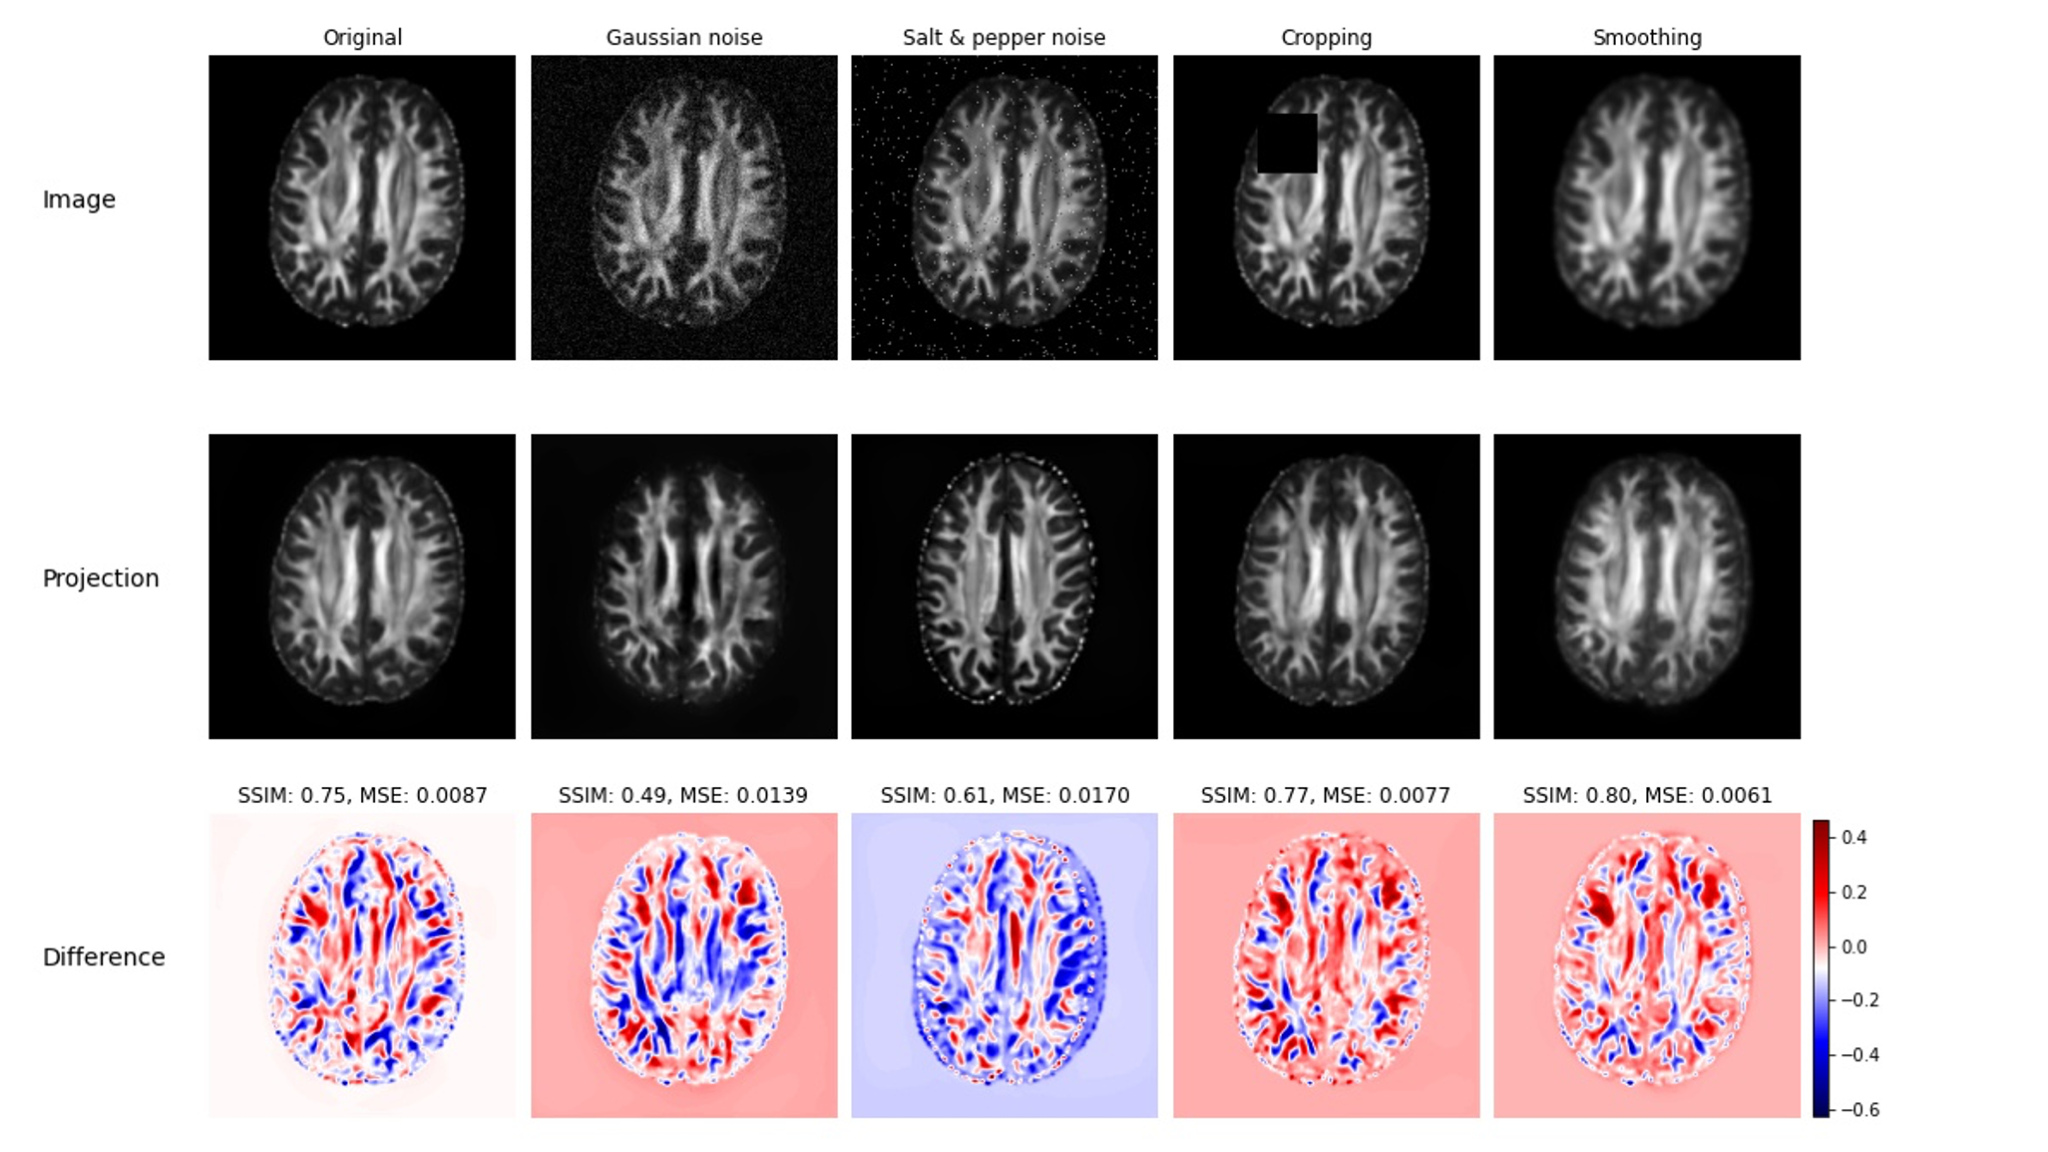
Fig. 2 The first row shows an original real data set and manipulated versions of it. The middle row shows the corresponding projected images and
the third row displays the related differences in a blue-white-red colormap. Image similarity measures and difference maps were computed between the projected image and the original (non-manipulated) image.

Fig. 3 Axial image of Flair contrast, original (target) FA map, projected version of the FA map and difference between the target and its projected version for two selected subjects (one per row). Red areas in the difference maps correspond at least patially with areas affected by lesions as indicated by the Flair image.
DOI: https://doi.org/10.58530/2022/4814