4813
Rapid myelin water fraction mapping through the combination of artificial neural network and under sampled mcDESPOT data1National Institute on Aging, Baltimore, MD, United States, 2Yale University, New Haven, CT, United States
Synopsis
The Myelin water fraction (MWF) measure provides a direct assessment of myelin content. The widely utilized method is the multicomponent analysis of T2 relaxation time and MWF is determined by the fraction of the fast-relaxing component. However, using either conventional or advanced methods, such as the BMC-mcDESPOT, requires prolonged acquisition and computation times, hampering their integration in clinical investigations. In this proof-of-concept work, we propose artificial neural network models to derive MWF maps from under sampled mcDESPOT data through two distinct approaches. This work opens the way to further developments for practical and rapid MWF imaging.
INTRODUCTION
Myelin is paramount for the normal function of the central nervous system, with loss or damage of the myelin sheets leading to various neurological conditions, e.g., multiple sclerosis and dementia(1-4). MRI mapping of myelin water fraction (MWF), a surrogate of myelin content, has provided important insights into brain maturation and neurodegeneration. However, traditional MWF mapping requires long acquisition times, complex image processing, and extensive computational power(5-9). Emerging evidence(10-15) shows that neural network (NN) models can drastically shorten the computational time and can be used to derive MR quantitative parameters from under sampled datasets. In this proof-of-concept work, we demonstrate that high-quality MWF maps can be derived directly from mcDESPOT data or from conventional relaxation times and proton density maps calculated from mcDESPOT data for both fully and under sampled datasets. The reduction in the acquisition and computation times as well as in implementation complexity opens the way to practical MWF mapping and holds promise to accelerate clinical research of myelination patterns in neurodevelopment and neurodegeneration.METHODS
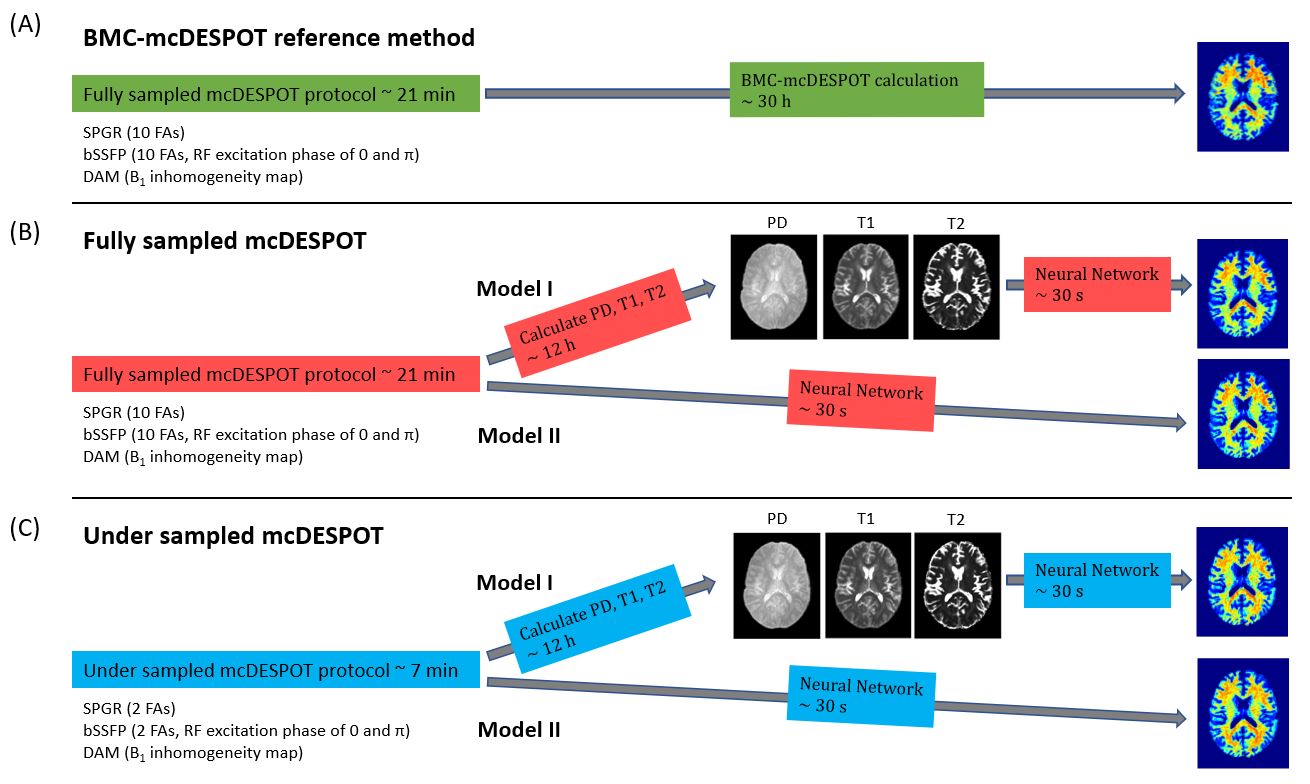
MRI19 participants have undergone our BMC-mcDESPOT protocol (9, 16, 17). Briefly, this protocol consisted of ten 3D SPGR images acquired with ten different flip angles (FAs), and ten 3D bSSFP images acquired with different FAs each acquired with RF excitation phase increments of 0° or 180° (17). B1 inhomogeneity correction was performed using the DAM (18) from two fast spin-echo images acquired with FAs of 45° and 90° (17).
For each participant, whole-brain PD and T1 maps were generated from the SPGR and DAM datasets using DESPOT1 (19), a whole-brain T2 map was generated from the bSSFP and DAM datasets using DESPOT2 (20), and a whole-brain MWF map was generated from the SPGR, bSSFP, and DAM datasets using BMC-mcDESPOT (9, 16, 17, 21).
NN structure, training, and testing
NN structure: We implemented two NN models. Model I (Fig.1 (B)): the T1, T2, and PD maps derived from mcDESPOT data were used as inputs. Model II (Fig.1 (C)): 10 SPGR, 20 bSSFP and 2 DAM images or 2 SPGR, 4 bSSFP and 2 DAM images were used as inputs for fully or under sampled mcDESPOT data, respectively. Between the input and output layers are 32, 64, 128, 256, 512, 256, 128, 64, and 32 fully connected neurons with leaky rectified linear unit (ReLU) activation in between. The model optimizer is Adam, and the loss function is the mean absolute error (MAE) function. The learning rate is initially set to 0.0001 and decreased after each epoch along with gradient clipping setting maximum gradient values to be 0.0001. These measurements greatly stabilized the networks and ensured model convergence of as little as 5 epochs. All codes are implemented in PyTorch version 1.9.0.
NN training: 19 participants’ derived PD, T1 and T2 maps or raw SPGR, bSSFP and DAM data were vectorized and used as training features. BMC-mcDESPOT derived MWF maps were used as training targets for all models.
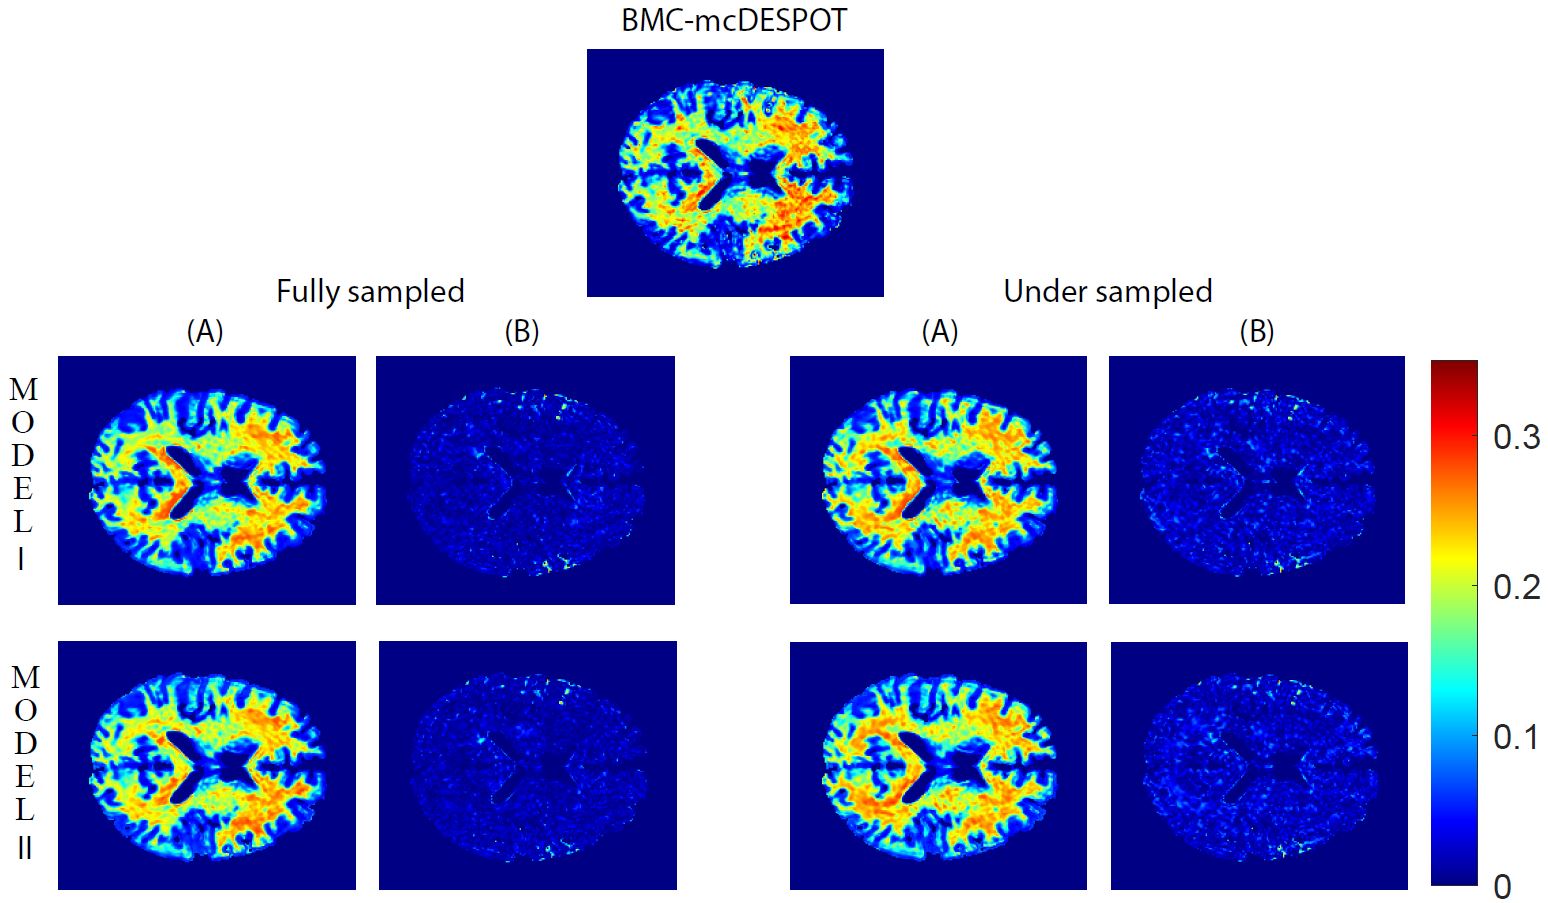
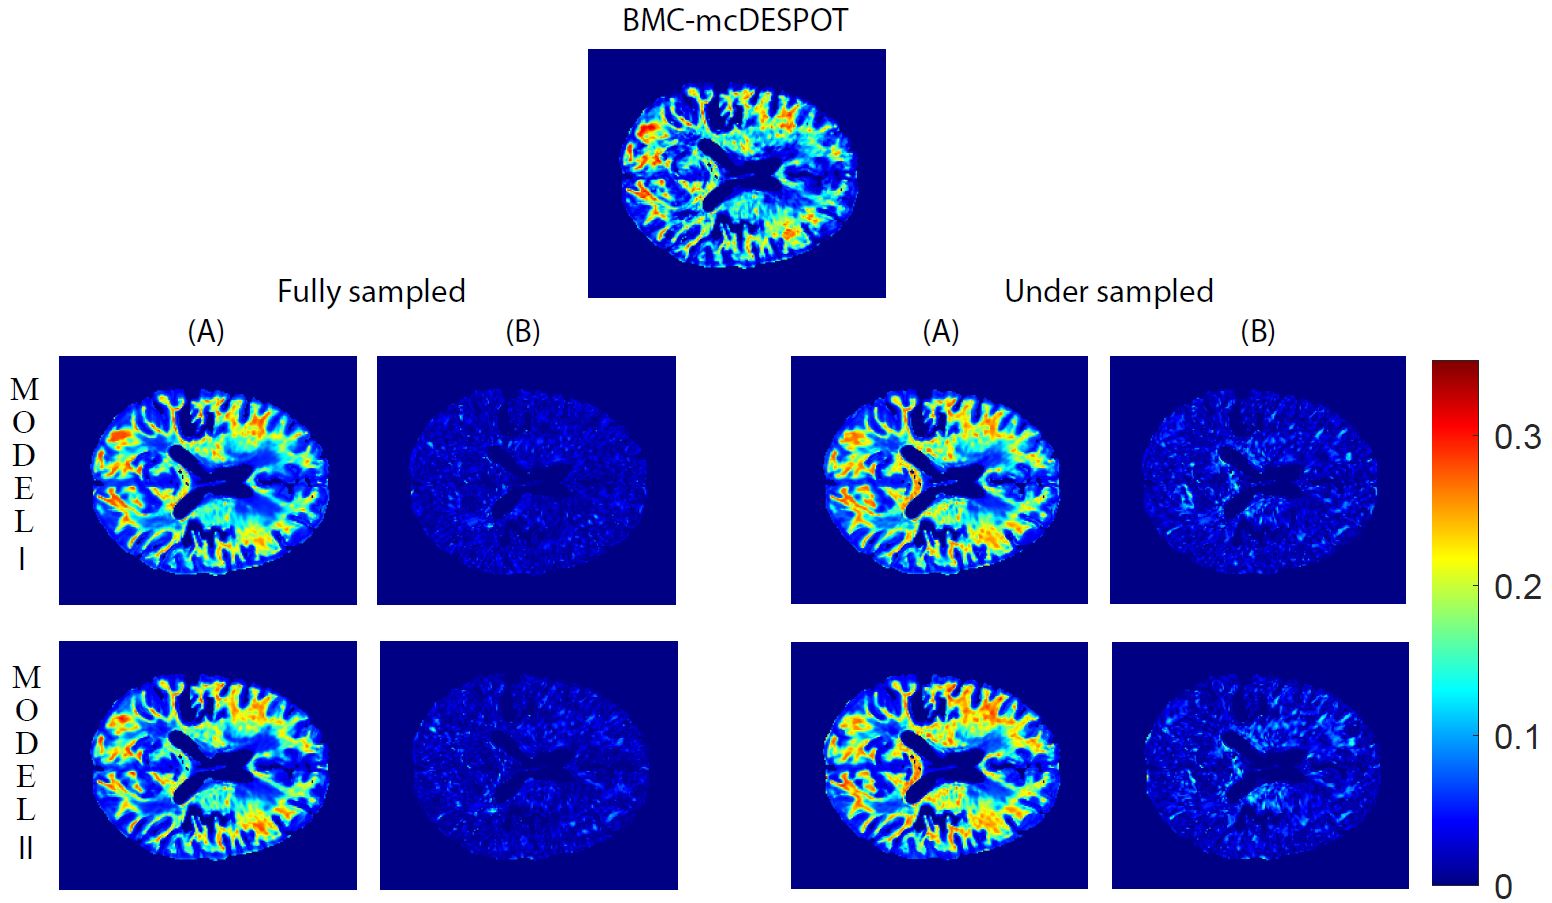
NN testing: A normal and a mild cognitively impaired (MCI) participants were used for testing. To assess the performance of NN, for each participant, absolute difference maps were calculated from the BMC-mcDESPOT reference MWF map and corresponding NN-MWF maps.
RESULTS & DISCUSSION
Compared to the 30 h of reference BMC-mcDESPOT calculation, whole-brain MWF maps can be generated in 12 h for Model I or 30 s for Model II. In Model I, T1, T2 and PD maps are calculated beforehand, then MWF is derived from those three values. Model II directly calculates MWF from raw mcDESPOT data. Fig. 2 and 3 (A) show one representative MWF axial slice using NN models from the normal or MCI subjects, respectively. Visual inspections show excellent agreement between NN calculation and BMC-mcDESPOT reference map. This is further highlighted in the corresponding absolute difference maps in Fig. 2 and 3 (B) indicating marginal differences in most cerebral white matter regions. More interestingly, MWF maps constructed using under sampled mcDESPOT data also exhibit similar regional MWF values and patterns. Especially MWF maps calculated using Model I show more robustness to under sampling providing high-quality MWF map with only 7 min of acquisition time. Model II combined with under sampling provides the most rapid MWF mapping for as little as 7 min of acquisition and 30 s of reconstruction. This rapid approach comes with the price of overestimation in some regions but important features, such as demyelination in the MCI participant, are still clearly shown.In this work, as a proof-of-concept, MWF maps are calculated from two different approaches using NN models. These two approaches give the maximum feasibility when the acquisition length or computation time is limited, while providing high quality whole brain MWF maps.
CONCLUSIONS
We demonstrated the feasibility of MWF mapping using NN through two distinct models. This work opens a way to further developments for rapid and practical MWF determination in a real clinic investigation timeframe.Acknowledgements
This work was supported by the Intramural Research Program of the National Institute on Aging of the National Institutes of Health.References
1. Laule C, Vavasour IM, Moore GR, Oger J, Li DK, Paty DW, et al. Water content and myelin water fraction in multiple sclerosis. A T2 relaxation study. J Neurol. 2004;251(3):284-93.
2. Laule C, Leung E, Lis DK, Traboulsee AL, Paty DW, MacKay AL, et al. Myelin water imaging in multiple sclerosis: quantitative correlations with histopathology. Mult Scler. 2006;12(6):747-53.
3. Bouhrara M, Reiter D, Bergeron C, Zukley L, Ferrucci L, Resnick S, et al. Evidence of demyelination in mild cognitive impairment and dementia using a direct and specific magnetic resonance imaging measure of myelin content. Alzheimer's & Dementia. 2018;14(8):998-1004.
4. Dean DC, Iii, Jerskey BA, Chen K, et al. Brain differences in infants at differential genetic risk for late-onset alzheimer disease: A cross-sectional imaging study. JAMA Neurology. 2014;71(1):11-22.
5. MacKay A, Whittall K, Adler J, Li D, Paty D, Graeb D. In vivo visualization of myelin water in brain by magnetic resonance. Magn Reson Med. 1994;31(6):673-7.
6. Whittall KP, MacKay AL, Graeb DA, Nugent RA, Li DK, Paty DW. In vivo measurement of T2 distributions and water contents in normal human brain. Magn Reson Med. 1997;37(1):34-43.
7. Prasloski T, Rauscher A, MacKay AL, Hodgson M, Vavasour IM, Laule C, et al. Rapid whole cerebrum myelin water imaging using a 3D GRASE sequence. Neuroimage. 2012;63(1):533-9.
8. MacKay AL, Laule C. Magnetic Resonance of Myelin Water: An in vivo Marker for Myelin. Brain Plasticity. 2016;2(1):71-91.
9. Bouhrara M, Spencer RG. Rapid simultaneous high-resolution mapping of myelin water fraction and relaxation times in human brain using BMC-mcDESPOT. Neuroimage. 2017;147:800-11.
10. Drenthen GS, Backes WH, Jansen JFA. Estimating myelin-water content from anatomical and diffusion images using spatially undersampled myelin-water imaging through machine learning. NeuroImage. 2021;226:117626.
11. Ganzetti M, Wenderoth N, Mantini D. Whole brain myelin mapping using T1- and T2-weighted MR imaging data. Front Hum Neurosci. 2014;8:671.
12. Lee J, Lee D, Choi JY, Shin D, Shin HG, Lee J. Artificial neural network for myelin water imaging. Magn Reson Med. 2020;83(5):1875-83.
13. Jung S, Lee H, Ryu K, Song JE, Park M, Moon WJ, et al. Artificial neural network for multi-echo gradient echo-based myelin water fraction estimation. Magn Reson Med. 2021;85(1):380-9.
14. Liu H, Xiang QS, Tam R, Dvorak AV, MacKay AL, Kolind SH, et al. Myelin water imaging data analysis in less than one minute. Neuroimage. 2020;210:116551.
15. Liu H, Joseph TS, Xiang QS, Tam R, Kozlowski P, Li DKB, et al. A data-driven T2 relaxation analysis approach for myelin water imaging: Spectrum analysis for multiple exponentials via experimental condition oriented simulation (SAME-ECOS). Magn Reson Med. 2021.
16. Bouhrara M, Spencer RG. Improved determination of the myelin water fraction in human brain using magnetic resonance imaging through Bayesian analysis of mcDESPOT. Neuroimage. 2016;127:456-71.
17. Qian W, Khattar N, Cortina LE, Spencer RG, Bouhrara M. Nonlinear associations of neurite density and myelin content with age revealed using multicomponent diffusion and relaxometry magnetic resonance imaging. NeuroImage. 2020;223:117369.
18. Deoni SC. Correction of main and transmit magnetic field (B0 and B1) inhomogeneity effects in multicomponent-driven equilibrium single-pulse observation of T1 and T2. Magn Reson Med. 2011;65(4):1021-35.
19. Deoni SC, Peters TM, Rutt BK. High-resolution T1 and T2 mapping of the brain in a clinically acceptable time with DESPOT1 and DESPOT2. Magn Reson Med. 2005;53(1):237-41.
20. Deoni SC. Transverse relaxation time (T2) mapping in the brain with off-resonance correction using phase-cycled steady-state free precession imaging. Journal of magnetic resonance imaging: JMRI. 2009;30(2):411-7.
21. Bouhrara M, Spencer RG. Incorporation of nonzero echo times in the SPGR and bSSFP signal models used in mcDESPOT. Magn Reson Med. 2015;74(5):1227-35.
Figures