4805
Prediction of new diffusion MRI data is feasible using robust machine learning algorithms for multi-shell HARDI in a clinical setting1Neuroscience, University of Calgary, Calgary, AB, Canada, 2Radiology, University of Calgary, Calgary, AB, Canada, 3Clinical Neurosciences, University of Calgary, Calgary, AB, Canada
Synopsis
High Angular Resolution Diffusion Imaging (HARDI) is a promising method for the analysis of microstructural changes. However, HARDI acquisition is time-consuming and therefore impractical in clinical settings. We developed 2 neural networks for predicting non-acquired diffusion datasets based on diffusion MRI: Multi-layer Perceptron (MLP) and Convolutional Neural Network (CNN). Through systemic training and evaluation with healthy public data and local MS patient MRI, we found that both the MLP and CNN models could predict high b-value from low b-value data that allowed the assessment of Neurite Orientation Dispersion and Density Imaging (NODDI) outcomes. Neural networks can make NODDI clinically viable.
Introduction
Multiple Sclerosis (MS) is a complex disease of the central nervous system characterized by different types of pathologies including inflammatory demyelination and neurodegeneration1. Accurate measurement in vivo requires advanced imaging techniques. Magnetic Resonance Imaging (MRI) methods like High Angular Resolution Diffusion Imaging (HARDI) can describe microstructural tissue properties previously inaccessible to conventional assessment techniques2,3. In particular, HARDI modeling through Neurite Orientation Dispersion and Density Imaging (NODDI) has shown the potential to accurately estimate neurite density index and orientation dispersion in MS patients4-6. Unfortunately, HARDI analyses are impractical in clinical settings because they require the acquisition of multiple copies of diffusion MRI, which is time-consuming and expensive7,8,9. Machine learning using neural networks can predict HARDI-based microstructural outcomes from insufficient datasets9,10, however, no study has predicted HARDI data using clinically feasible MS patient data, and none has used predicted datasets to calculate NODDI measures. The goal of this study was to address these gaps by developing novel neural network models able to predict new diffusion MRI thereby making NODDI practical for clinical use.Methods
3T MRI scans with multi-b-value acquisitions from 7 healthy subjects in the Human Connectome Project (HCP) WU-Minn cohort were used to develop the neural networks. For further testing, 2 b-value diffusion MRI datasets acquired at a 3T scanner from 6 relapse-remitting MS patients from a clinical study were used. The development focused on 2 networks: a Multi-layer Perceptron (MLP) and a Convolutional Neural Network (CNN). Both were trained to predict b=2000 s/mm2 data from b=1000 s/mm2 data using a single HCP subject, with individual voxel values as input. The voxels were randomly split into 3 datasets: training (70%), validation (15%), and testing (15%). The best hyperparameter settings for a neural network (e.g., # of neurons per layer, type of activating function) were determined using a limited grid-search method that systematically refined the performances of the MLP and CNN. Subsequently, the finalized MLP and CNN architectures were trained 3 different times on 1, 3, and 5 HCP subjects (the 2nd to 6th) respectively using the same data split scheme as noted above for further validation. The trained models were then used to predict the b=2000 s/mm2 data for the 7th HCP subject for final testing. Using either original or predicted b=2000 s/mm2 data alongside the original b=1000 s/mm2 data, Neurite Density Index (NDI) and Orientation Dispersion Index (ODI) maps were calculated. This process was repeated using 1, 3, and 5 MS subjects respectively from the clinical MS data for additional training, and the 6th MS subject for final testing and NODDI outcome calculation.The similarity of NODDI metrics based on predicted versus the original diffusion MRI data was assessed using the Peak-signal-to-noise Ratio (PSNR) and Structural Similarity Index (SSIM). Then, the PSNR and SSIM metrics derived from CNN-assisted and MLP-assisted NODDI outcomes were compared using a Student’s t-test (p < 0.05 as significant).
Results
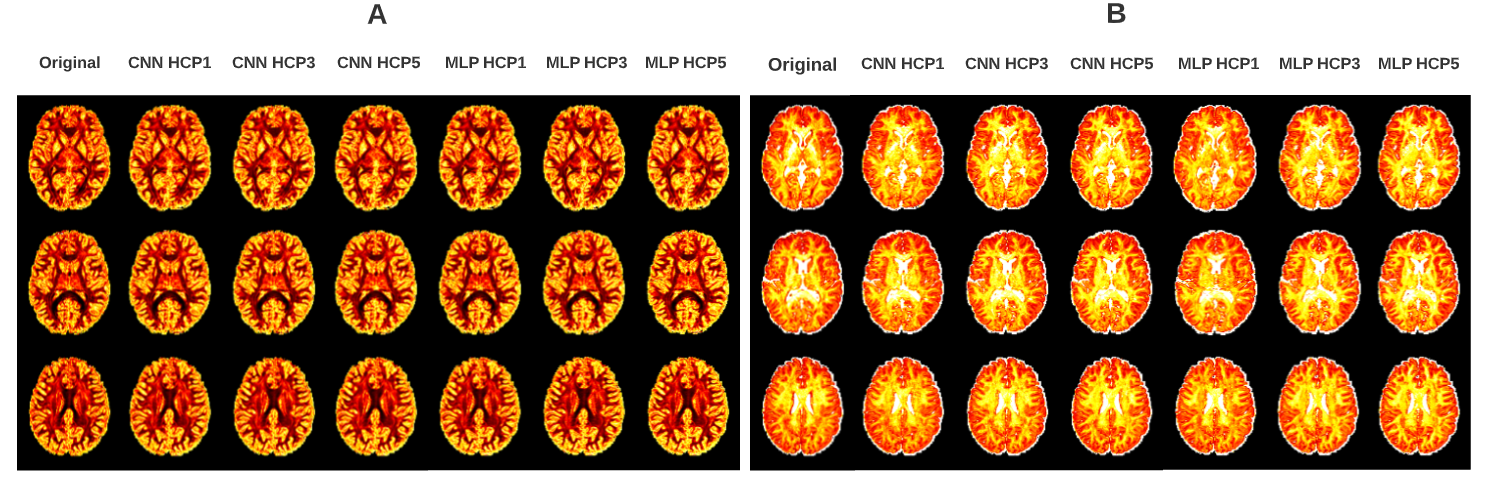
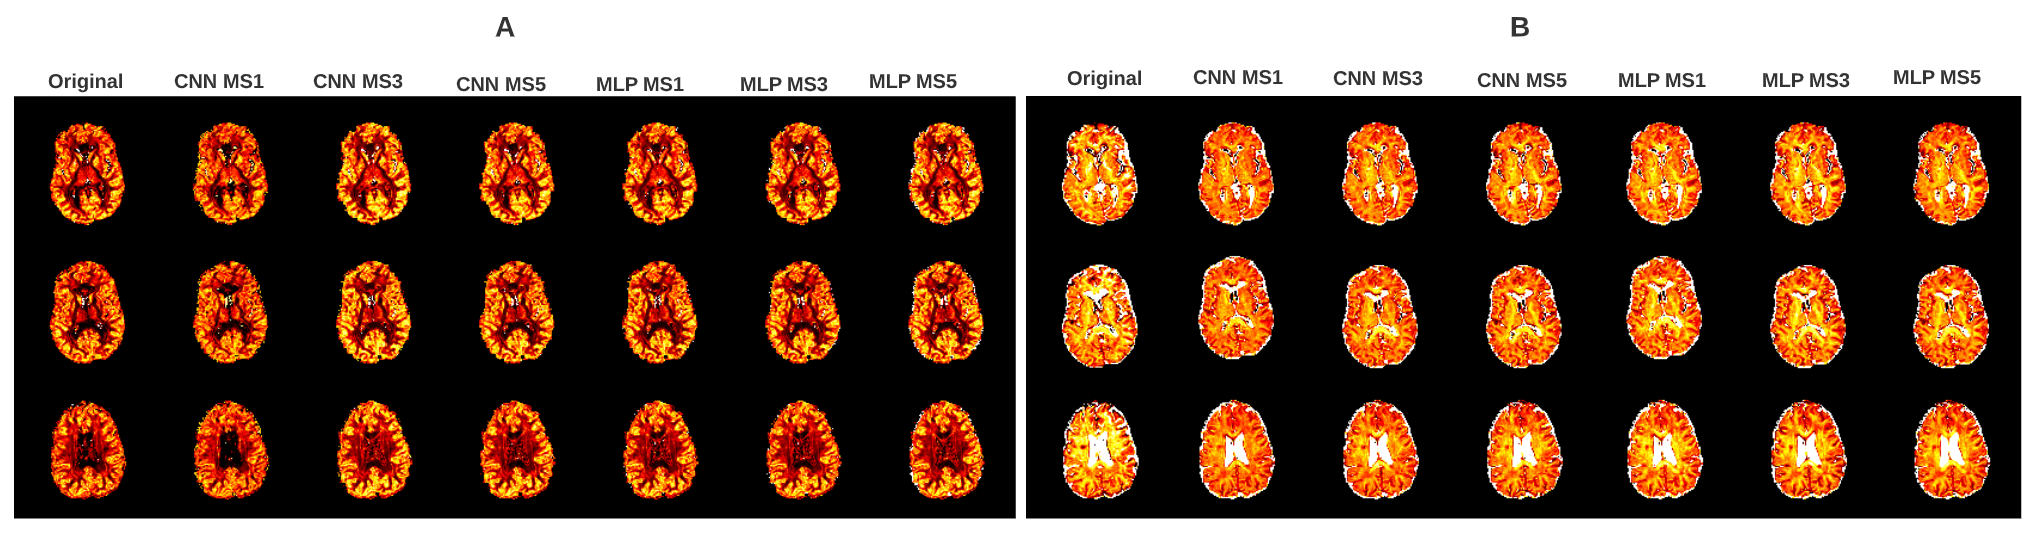
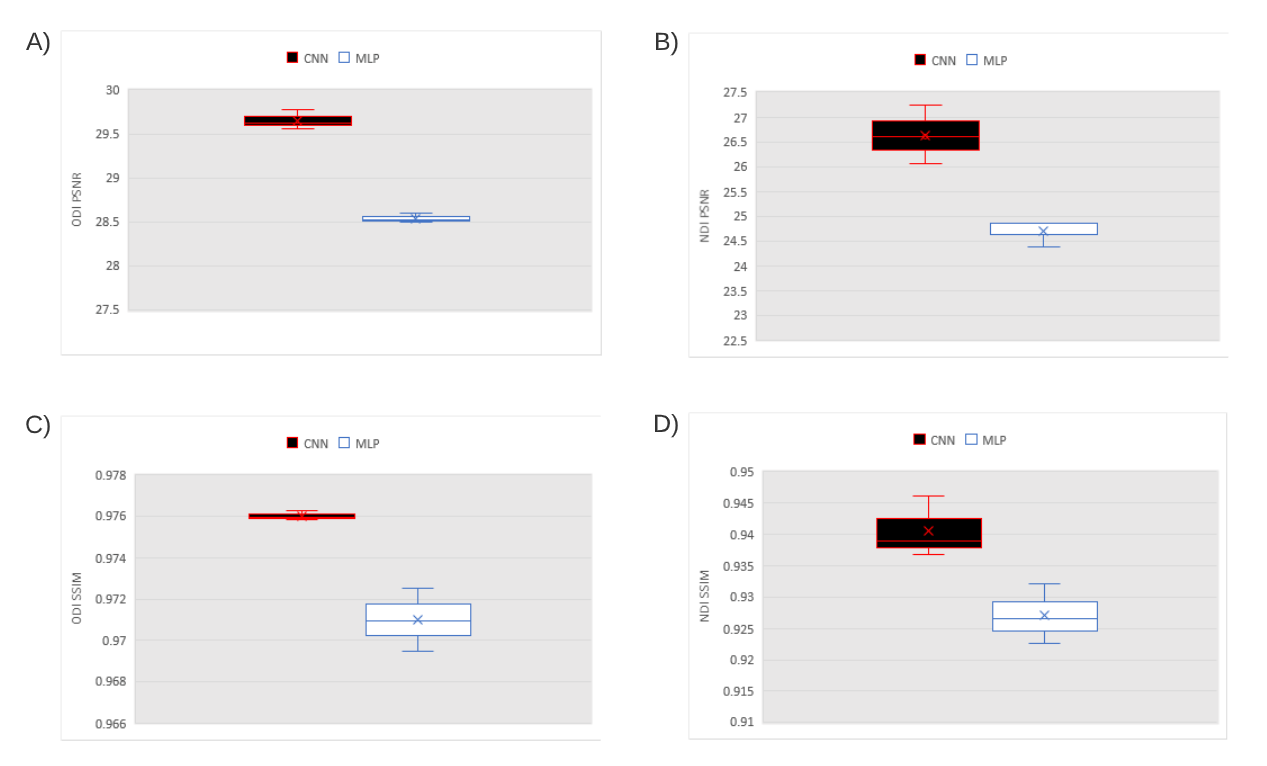
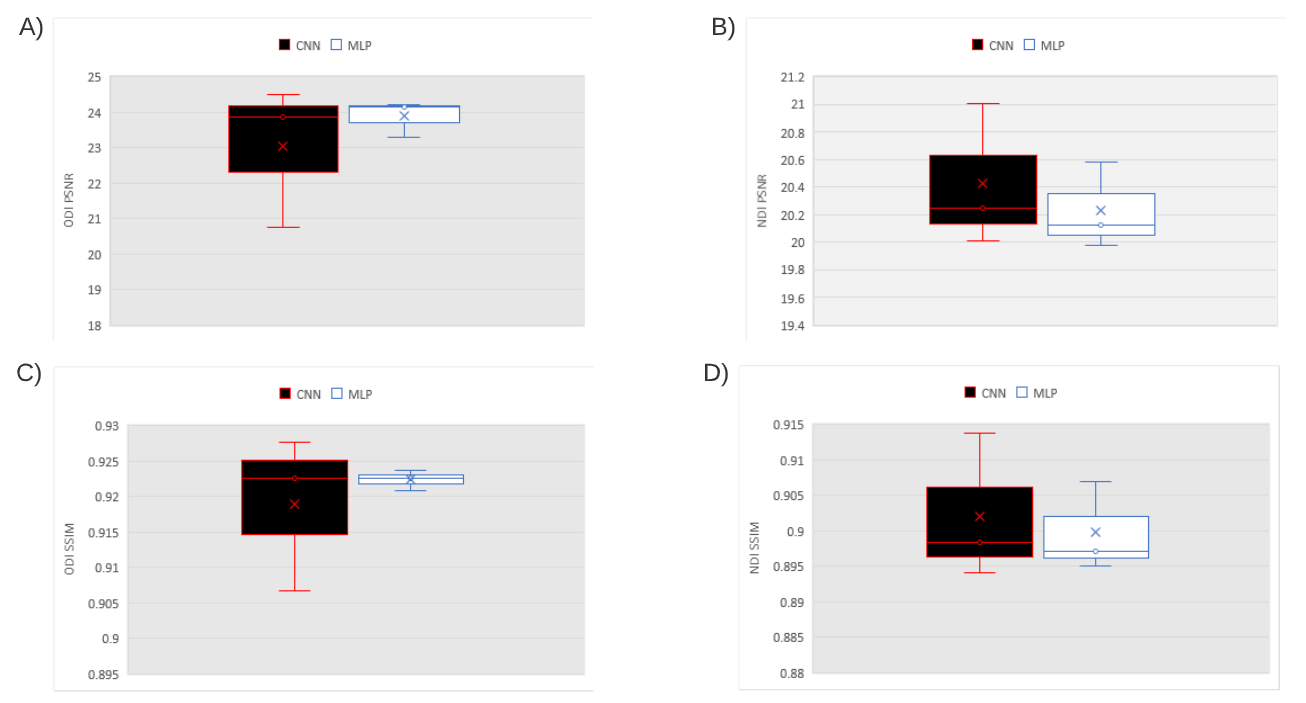
The NODDI maps looked similar visually between datasets used in the calculation (Fig.1-2). The PSNR of the CNN-assisted HCP outcomes was significantly higher than the MLP-assisted PSNR for both ODI (29.65509 versus 28.54072, p=0.000464) and NDI (26.63102 versus 24.70246, p=0.007083). Likewise, the SSIM of the CNN-assisted HCP outcomes was significantly higher than the MLP-assisted SSIM for both ODI ((0.976029 versus 0.971002, p= 0.0.011421) and NDI (0.940632 versus 0.927102, p=0.000719) (Fig.3). In testing MS patient data, the PSNR of CNN-assisted outcomes was not significantly higher than MLP-assisted for either ODI (23.0426 versus 23.8937, p=0.297083) or NDI (20.42433 versus 20.22836, p=0.119349). The SSIM of CNN-assisted outcomes was also not significantly higher than MLP-assisted for ODI (0.919021 versus 0.922392, p=0.330735) or NDI (0.902122 versus 0.899769, p=0.207084) (Fig.4).Discussion
Both the CNN-assisted and MLP-assisted HCP NODDI maps showed the expected distribution of outcome values in brain white matter and grey matter11 and they all appeared visually similar to the original data outcomes. The quality of the outcomes did not change dramatically when additional training subjects were used, suggesting the stability of the models even based on voxel values from a single subject. The subsequent findings on PSNR and SSIM may indicate that while both models can accurately generate NODDI maps, the CNN may be better than the MLP for predicting healthy subject outcomes. The CNN-assisted and MLP-assisted NODDI maps in MS were similar to the original maps, although there were regions that appeared brighter in maps using the predicted data. Additionally, the quality of the CNN-assisted maps improved with additional training subjects whereas the quality of the MLP-assisted outcomes did not. Both metrics were similar to the PSNR and SSIM obtained in previous studies10,12, suggesting that our neural network-assisted NODDI was able to generate accurate microstructural outcomes for the MS subject.Conclusion
With the assistance of robust neural network models, advanced microstructural analysis such as NODDI is feasible based on clinical diffusion MRI. This approach can not only reduce the cost and burden of the health care system, but also patient discomfort, and therefore can have a broad range of applications. Future work should aim to expand the usage of the neural network-assisted HARDI techniques by assessing the predicted datasets with different types of diffusion models.Acknowledgements
We would like to thank the MS Society of Canada, Natural Sciences Engineering Council of Canada, and Canadian Institutes of Health Research for funding.References
1: Huang WJ, Chen W, Zhang X. Multiple sclerosis: Pathology, diagnosis, and treatments (Review). Exp Ther Med. 2017;13(6):3163-3166.
2 Rovaris M, Gass A, Bammer R, Hickman SJ, Ciccarelli O, Miller DH, Filippi M. Diffusion MRI in multiple sclerosis. Neurology. 2005;65(10):1526-1532.
3: Descoteaux M. High Angular Resolution Diffusion Imaging (HARDI). Wiley Encyclopedia of Electrical and Electronics Engineering. 2015. Doi: 10.1002/047134608X.W8258
4: Timmers I, Roebroeck A, Bastiani M, Jansma B, Rubio-Gozalbo E, Zhang H. Assessing Microstructural Substrates of White Matter Abnormalities: A Comparative Study Using DTI and NODDI. PLoS One. 2016;11(12):e0167884.
5: Collorone S, Cawley N, Grussu F, Prados F, Tona F, Calvi A, Kanber B, Schneider T, Kipp L, Zhang H, Alexander DC, Thompson AJ, Toosy A, Wheeler-Kingshott CAG, Ciccarelli O. Reduced neurite density in the brain and cervical spinal cord in relapsing-remitting multiple sclerosis: A NODDI study. Mult Scler. 2020;26(13):1647-1657.
6: Spanò B, Giulietti G, Pisani V, Morreale M, Tuzzi E, Nocentini U, Francia A, Caltagirone C, Bozzali M, Cercignani M. Disruption of neurite morphology parallels MS progression. Neurol Neuroimmunol Neuroinflamm. 2018;5(6):e502.
7: Zhang H, Schneider T, Wheeler-Kingshott CA, Alexander DC. NODDI: practical in vivo neurite orientation dispersion and density imaging of the human brain. NeuroImage. 2012;61(4):1000-1016.
8: Kamiya K, Hori M, Aoki S. NODDI in clinical research. J Neurosci Methods. 2020;346:108908.
9: Golkov V, Dosovitskiy A, Sperl J, Menzel M, Czisch M, Samann O, Brox T, Cremers D. q-Space Deep Learning: Twelve-Fold Shorter and Model-Free Diffusion MRI Scans. IEEE Trans Med Imaging. 2016;35(5):1344-1351.
10: Tian Q, Bilgic B, Fan Q, Liao C, Ngamsombat C, Hu Y, Witzel T, Setsompop K, Polimeni J, Huang S. DeepDTI: High-fidelity six-direction diffusion tensor imaging using deep learning. Neuroimage. 2020;219: 117017.
11: Tamanti A, Pisani AI, De Luca A, Pizzini FB, Castellaro M, Zuco C, Marastoni D, Cresenczo F, Scalfari A, Bertoldo A, Pitteri M, Magliozzi R, Calabrese M. Evaluation of NODDI indexes in white and gray matter for the characterization of MS clinical features: pathological phenotypes, EDSS and disease duration. ECTRIMS Online Library. 2018;228672:P829.
12: Gibbons EK, Hodgson KK, Chaudhari AS, Richards LG, Majersik JJ, Adluru G, Dibella E. Simultaneous NODDI GFA parameter map generation from subsampled q-space imaging using deep learning. Magn Reson Med. 2019;81(4):2399-2411.
Figures