4803
Hypergraph learning-based convolutional neural network for classification of brain functional connectome1Department of Radiology, Cincinnati Children's Hospital Medical Center, Cincinnati, OH, United States, 2Imaging Research Center, Cincinnati Children's Hospital Medical Center, Cincinnati, OH, United States, 3Department of Biomedical Engineering, Tulane University, New Orleans, LA, United States, 4Department of Radiology, University of Cincinnati College of Medicine, Cincinnati, OH, United States, 5Center for Prevention of Neurodevelopmental Disorders, Cincinnati Children's Hospital Medical Center, Cincinnati, OH, United States, 6Department of Pediatrics, University of Cincinnati College of Medicine, Cincinnati, OH, United States
Synopsis
The human brain is a highly interconnected network where local activation patterns are organized to cope with diverse environmental demands. We developed a hypergraph learning based convolutional neural network model to capture higher order relationships between brain regions and learn representative features for brain connectome classification. The model was applied to a large scale resting state fMRI cohort, containing hundreds of healthy developing adolescents, age 8 to 22. The proposed model is able to classify different age groups with a balanced accuracy of 86.8%.
Introduction
Modern imaging techniques, and in particular functional magnetic resonance imaging (fMRI),1 provide an opportunity to study brain organization and development noninvasively. The human brain is a highly interconnected network where local activation patterns are organized to cope with diverse environmental demands.2 Recently, traditional graph structure has been used to construct brain functional connectome (functional connectivity network (FCN)), which might reveal the brain functional behavior through different activation patterns.3Graph theory based method has been successfully applied to characterize brain FCNs with applications to prediction of mental health disorders and neurodevelopment outcomes.4-7 More recently, hypergraph structure was utilized to construct the brain FCNs to incorporate the high-order relationships between individual regions.8,9 In our recent work, a hypergraph learning framework has been proposed to improve the discriminative power of the constructed FCNs with weighted hyperedges.10 In this study, we incorporate the hypergraph structure to the conventional graph convolutional network (GCN) and propose a hypergraph learning based neural network (HGCN) to classify FCNs, which considers the higher order relationships in the network and the well-acknowledged performance of deep learning models for representation learning.
Methods
We begin by introducing basic notions in hypergraph theory. A hypergraph $$$\mathcal{G}=(\mathcal{V},\mathcal{E},\textbf{w})$$$ includes a vertex set $$$\mathcal{V}=\{v_1,v_2,\cdots,v_N\}$$$, a hyperedge set $$$\mathcal{E}=\{e_1,e_2,\cdots,e_M\}$$$ , and a hyperedge weight vector $$$\textbf{w}=(w(e_1),w(e_2),\cdots, w(e_M))^{T}\in\mathbb{R}^M$$$ . The hypergraph $$$\mathcal{G}$$$ can be denoted by an incidence matrix $$$\textbf{H}=[H_{ij}]\in \mathbb{R}^{N\times M}$$$ with entries$$ H_{ij}={\begin{cases}1 & \text{if} \quad v_i\in e_j\\0 & \text{otherwise}.\\\end{cases} }$$
The vertex degree and hyperedge degree are defined as the weighted sum of the hyperedge that passes a given node and the sum of the vertices within a hyperedge, respectively, denoted in matrix form as $$$\textbf{D}_v$$$ and $$$\textbf{D}_e$$$. The similarity matrix of a hypergraph is defined by $$$\textbf{S}=\textbf{H}\textbf{W}\textbf{D}_e^{-1}\textbf{H}^{T}$$$ , where $$$\textbf{W}$$$ denotes the diagonal matrix of hyperedge weights.10 The hypergraph Laplacian matrix is defined by $$$\textbf{L}=\textbf{D}_v-\textbf{S}$$$.
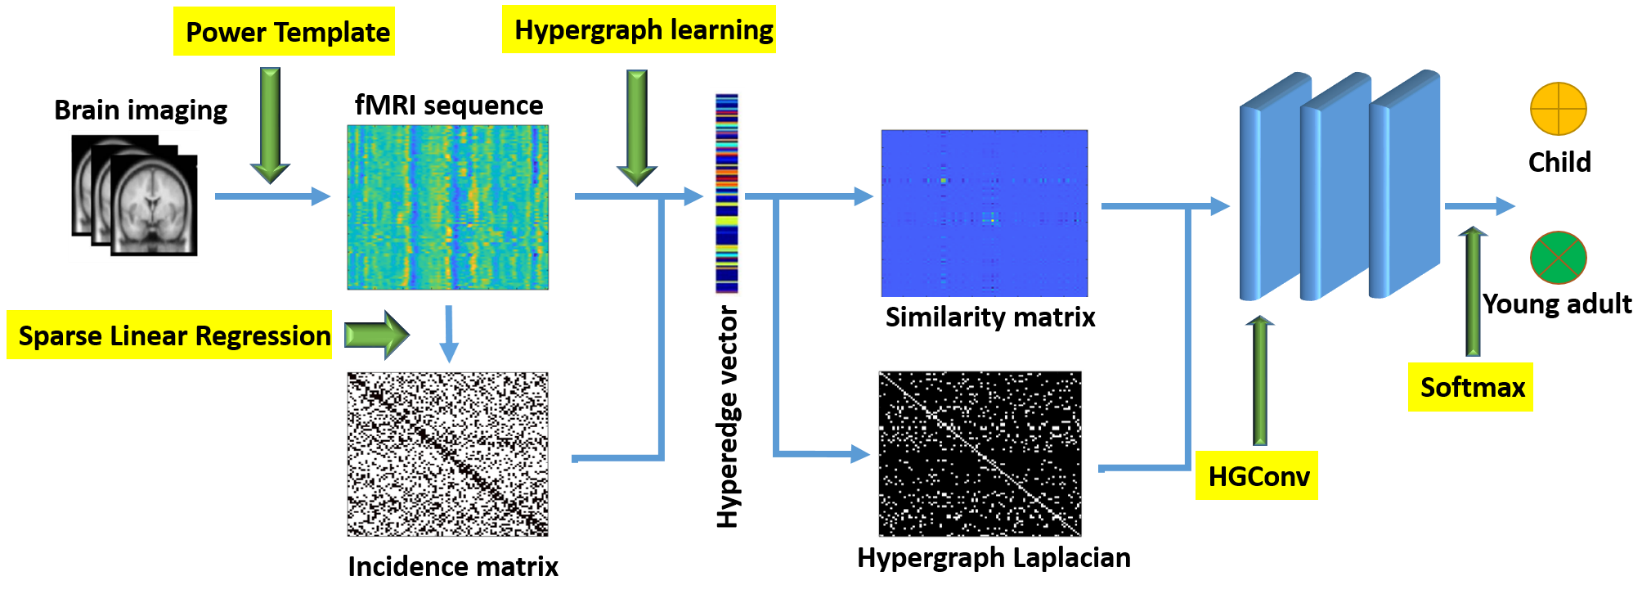
In our proposed framework, the incidence matrix $$$\textbf{H}$$$ was constructed using the sparse linear regression $$\min_{{\alpha}_i}\;\frac{1}{2}\lVert\textbf{x}_i-\textbf{A}_i{\alpha}_i\rVert_{2}^{2}+\rho\lVert{\alpha}_i\rVert_1,$$ where $$$\textbf{A}_i=\left(\textbf{x}_1,\cdots,\textbf{x}_{i-1},\textbf{x}_{i+1},\cdots,\textbf{x}_N\right)$$$ is the time sequential data on all the vertices except the $$$i$$$-th one. $$${\alpha}_i$$$ reflects the neighborhood information towards centroid node $$$i$$$. $$$\rho$$$ is the regularization parameter controlling the sparsity. We then employ hypergraph learning to estimate hyperedge weights by minimizing the smoothness of the input data, which is quantified by the Laplacian quadratic form:
$$\begin{aligned}\min_{\textbf{w}} \; & \text{tr}(\textbf{X}^T\textbf{L}\textbf{X})+\delta\lVert\textbf{w}\rVert_{2}^{2}\\\textrm{s.t.} \; & \textbf{w}\succeq0\\ &\lVert\textbf{w}\rVert_{1}=1, \\\end{aligned}$$
where $$$\textbf{X}$$$ is the data matrix, and $$$\delta$$$ is a positive regulator controlling the hyperedge weight distribution. The two constraints enforce the learned weights are positive and non-trivial. Similar to the classical GCN,11 we can perform hypergraph Fourier transform by replacing graph Laplacian matrix with the learned hypergraph Laplacian.12 Approximated with the first order Chebyshev polynomial and using change of parameters, the hypergraph convolution layer is formulated:
$$ \textbf{X}^{(l+1)}=\sigma(\textbf{D}_v^{-\frac{1}{2}}\textbf{H}\textbf{W}\textbf{D}_e^{-1}\textbf{H}^{T}\textbf{D}_v^{-\frac{1}{2}}\textbf{X}^{(l)}\Theta^{(l)}),$$
where $$$ \textbf{X}^{(l)}$$$ is the input at $$$l$$$ -th layer $$$(\textbf{X}^{(0)}=\textbf{X})$$$, and $$$\sigma$$$ denotes the Rectified Linear Unit (ReLU) function.
We validated our proposed model on resting state fMRI data collected from the Philadelphia Neurodevelopmental Cohort (PNC), a large scale collaborative study between the Brain Behavior Laboratory at the University of Pennsylvania and the Center for Applied Genomics at the Children’s Hospital of Philadelphia.13 Subjects were scanned on a 3T Siemens Trio scanner with parameters: slice thickness = 3 mm, 64 slices, TR=3 s, TE=32 ms, flip angle=90◦ , matrix = 64×64, FOV=192 mm.
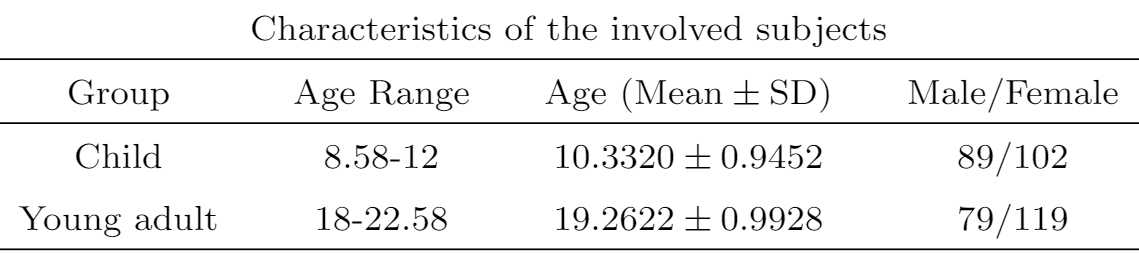
We followed a standard pipeline to preprocess the data using SPM1214, consisting of motion correction, spatial normalization to standard MNI space (adult template) and spatial smoothing with a 3 mm FWHM Gaussian kernel. We applied regression to remove the effect of motion (6 parameters), followed by a band-pass filter in 0.01Hz to 0.1Hz frequency range. The imaging data were further parcellated into 264 brain regions according to Power template.15 For classification, we divide the subjects in two groups as in Table 1.
Results
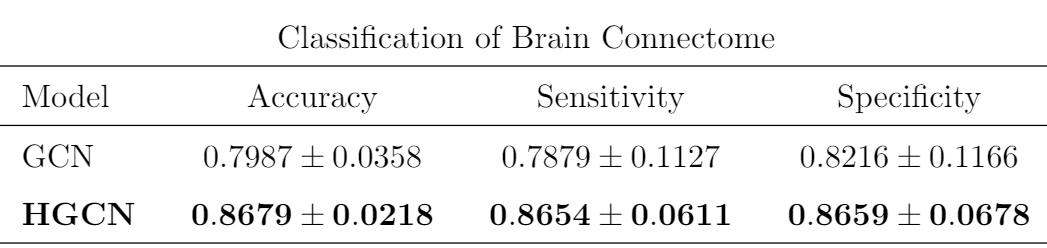
We built a three-layer HGCN to perform graph classification as in Figure 1. The model takes hypergraph similarity matrix as input and hypergraph Laplacian matrix to perform convolution. A k-nearest neighborhood (KNN) algorithm is enforced on the graph to control sparsity.16 The hyper-parameters including number of channels, learning rate, weight decay are tuned based on cross-entropy loss. A Softmax layer is used to output the label. For comparison, we also conducted the classification task with GCN11, where the brain FCNs are constructed based on Pearson correlation.Table 2 shows that the proposed HGCN outperforms conventional GCN model. Our model can classify subjects into the appropriate age groups using their FCNs with a mean balanced accuracy of 86.8%.
Discussion and conclusion
In this work, we developed a HGCN and applied it to a large neuroimaging dataset with resting state fMRI data. We demonstrated the superiority of our proposed method over conventional GCN by incorporating higher order relationships contained in the graph structure and the discriminative information from the hyperedge weights. We validated the effectiveness of our proposed method to predict a given subject’s age using resting state fMRI data. Our future directions include applying this method to meaningful clinical problems and to improve the accuracy of prognostic models for mental health and neurodevelopmental outcomes.Acknowledgements
This work was supported by the National Institutes of Health [R01-EB029944, R01-EB030582, R01-NS094200 and R01-NS096037]. The funders played no role in the design, analysis, or presentation of the findings.References
1. Belliveau, J. W., et al. "Functional mapping of the human visual cortex by magnetic resonance imaging." Science 254.5032 (1991): 716-719.
2. Park H-J, Friston KJS. Structural and functional brain networks: from connections to cognition. 2013;342(6158):1238411
3. Greene, Abigail S., et al. "Task-induced brain state manipulation improves prediction of individual traits." Nature communications 9.1 (2018): 1-13.
4. Manelis, Anna, et al. "Anticipation-related brain connectivity in bipolar and unipolar depression: a graph theory approach." Brain 139.9 (2016): 2554-2566.
5. Wang, Junqi, et al. "Integration of network topological features and graph Fourier transform for fMRI data analysis." 2018 IEEE 15th International Symposium on Biomedical Imaging (ISBI 2018). IEEE, 2018.
6. Giedd, Jay N., et al. "Brain development during childhood and adolescence: a longitudinal MRI study." Nature neuroscience 2.10 (1999): 861-863.
7. Farahani, Farzad V., Waldemar Karwowski, and Nichole R. Lighthall. "Application of graph theory for identifying connectivity patterns in human brain networks: a systematic review." frontiers in Neuroscience 13 (2019): 585.
8. Jie, Biao, et al. "Hyper-connectivity of functional networks for brain disease diagnosis." Medical image analysis 32 (2016): 84-100.
9. Li, Yang, et al. "Multimodal hyper-connectivity of functional networks using functionally-weighted LASSO for MCI classification." Medical image analysis 52 (2019): 80-96.
10. Xiao, Li, et al. "Multi-hypergraph learning-based brain functional connectivity analysis in fMRI data." IEEE transactions on medical imaging 39.5 (2019): 1746-1758.
11. Kipf, Thomas N., and Max Welling. "Semi-supervised classification with graph convolutional networks." arXiv preprint arXiv:1609.02907 (2016).
12. Feng, Yifan, et al. "Hypergraph neural networks." Proceedings of the AAAI Conference on Artificial Intelligence. Vol. 33. No. 01. 2019.
13. Satterthwaite, Theodore D., et al. "The Philadelphia Neurodevelopmental Cohort: A publicly available resource for the study of normal and abnormal brain development in youth." Neuroimage 124 (2016): 1115-1119.
14. Ashburner, John, et al. "SPM12 manual." Wellcome Trust Centre for Neuroimaging, London, UK 2464 (2014).
15. Power, Jonathan D., et al. "Functional network organization of the human brain." Neuron 72.4 (2011): 665-678.
16. Qu, Gang, et al. "Ensemble manifold regularized multi-modal graph convolutional network for cognitive ability prediction." IEEE Transactions on Biomedical Engineering (2021).
Figures