4802
Optimal experimental design of MR Fingerprinting for simultaneous quantification of T1, T2, and ADC1Biomedical Engineering, Case Western Reserve University, Cleveland, OH, United States, 2Radiology, Case Western Reserve University, Cleveland, OH, United States
Synopsis
The MRF framework has been recently investigated to estimate T1, T2 and apparent diffusion coefficient (ADC) from a single scan with b-tensor encoding schemes. However, the current human-designed experiment protocol for multi-dimensional MRF is still subject to limited measurement accuracy. Here we propose to adapt the Cramer-Rao Bounds to optimize multi-dimensional MRF scan for simultaneous quantification of relaxation and diffusion. The optimization framework explores all possible combinations of MRF sequence parameters, including flip angles, TRs, b-values, and preparation modules to seek the optimal tissue parameter encoding scheme. The optimized sequence simultaneously improves the measurement precision of T1, T2 and ADC.
Introduction
The MR Fingerprinting (MRF) technique enables simultaneous quantification of multiple tissue properties1. The MRF framework has been recently investigated to estimate T1, T2 and apparent diffusion coefficient (ADC) from a single scan with b-tensor encoding schemes2. However, the current human-designed experiment protocol for multi-dimensional MRF is still subject to long acquisition time and limited measurement accuracy. Previous studies have investigated the optimal experimental designs using Cramer-Rao Bounds criterion for T1 and T2 quantification3,4. Here we propose to adapt the criterion to optimize multi-dimensional MRF scans for simultaneous quantification of relaxation and diffusion. The optimization framework seeks the optimal combinations of MRF sequence parameters, including flip angles, TRs, b-values, and preparation modules, and significantly improves the precision of T1, T2 and ADC measurements.Methods
Cramer-Rao Lower bound (CRB)CRB gives a lower bound on the variance of an unbiased estimator for the parameters of interest $$$θ$$$. Based upon a previous study that has adapted CRB to the basic MRF framework for T1 and T2 quantification3, the bounds on the tissue properties of tissue type $$$k$$$ to be minimized are the diagonal entries of its CRB matrix:$$V(θ_k)=I^{-1}(θ_k)$$, where $$$I(θ)$$$ is the Fisher information matrix. Assuming the MRF signals are contaminated with normally distributed Gaussian noise σ:$$I(θ)=\frac{1}{σ^2}Σ_{n = 1}^NJ_n'(θ)J_n(θ)$$ and $$$J_n(θ)=[\frac{\partial{m_n}}{\partial{T1}},\frac{\partial{m_n}}{\partial{T2}},\frac{\partial{m_n}}{\partial{ADC}}]$$$ Where $$$m_n$$$ is the n-th acquired magnetization signal governed by the Bloch equations.
Signal Model of multi-dimensional MRF
A multi-dimensional MRF scan for simultaneous quantification of T1,T2 and ADC2 was based on the MRF-FISP scan with a series of psudo-randomized flip angles and TRs. In addition, the sequence contains multiple preparation modules, including T1 preparation with various TI times, T2 preparation with various TE times, and diffusion preparation with various b-values. The modules were implemented for each of 48 readout periods. The signal model of magnetization of the r-th spin at n-th readout is: $$ M_r[n]=G(β_r)R(T1,T2,TR_n)W(ADC,b_n)Q(α_n)M_r[n-1]+M_0b(T1,TR_n)$$ where $$$G(β_r)$$$, $$$R(T1,T2,TR_n)$$$, $$$W(ADC,b_n)$$$, $$$Q(α_n)$$$, and $$$b(T1,TR_n)$$$ model phase twist of $$$β_r$$$ by spoiler gradients, spin relaxation in $$$TR_n$$$, diffusion weighting by b-value $$$b_n$$$, RF excitation with flip angle $$$α_n$$$, and longitudinal relaxation in $$$TR_n$$$, respectively. The signal acquired at the n-th time point is: $$m_n=∑_rPR(T1,T2,TE_n)Q(α_n)M_r[n-1]$$ where $$$P$$$ is a projection matrix that extracts the transverse magnetization. Magnetization depends upon tissue properties $$$θ=[T1,T2,ADC]$$$ and sequence parameters $$$TR_n$$$, $$$α_n$$$, $$$b_n$$$ to be optimized.
The preparation parameters to be optimized includes the TI, TE, b-value, and location and type of preparation modules. Simultaneously optimizing module ordering with other preparation parameters is challenging, since changing the location and type of preparation modules changes the overall signal model structure. Thus, we integrated the preparation signal models into the MRF-FISP signal model. Specifically, the preparation modules were divided into multiple segments, with each treated as a single MRF-FISP time point. Indeed, the preparation parameters can be represented in terms of $$$TR_n$$$, $$$α_n$$$, $$$b_n$$$ (Figure 1).
Such a strategy enables any non-T1 preparation module to interchange between T2 preparation, diffusion preparation, or “no preparation” (Figure 1). Therefore, we can optimize the module ordering along with other preparation parameters on a semi-continuous optimization landscape.
Optimization
We optimized for a sequence of 576 TRs (12 preparation modules) using the sequential quadratic programming algorithm to minimize the CRB matrix. The algorithm is initialized using a human-designed multi-dimensional MRF sequence (Figure 2) to optimize for of three representative tissues: $$$θ_{GM}=[1400,60,700e-6]$$$, $$$θ_{WM}=[800,40,850e-6]$$$, $$$θ_{CSF}=[3000,2000,3000e-6]$$$. Optimization constraints for sequence parameters are shown in Table 1.
Validation
The optimized sequence obtained from the proposed optimization framework was evaluated using simulations. A 3-tissue digital brain phantom5 containing segmented WM, GM, CSF masks was used to simulate a series of MRF images, which were obtained using ground truth tissue properties in the previous section following Bloch equations. Various levels of Gaussian white noise were added in k-space of each image. The images were then reconstructed into MRF maps via dictionary matching.
Results
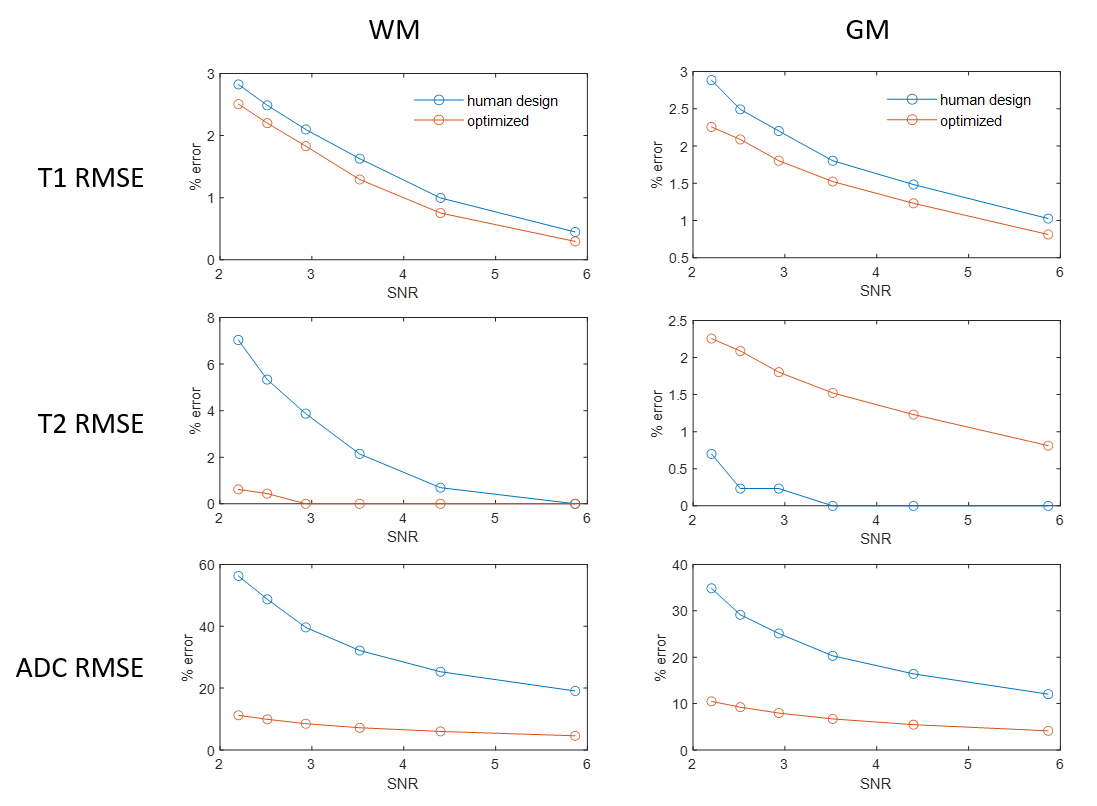
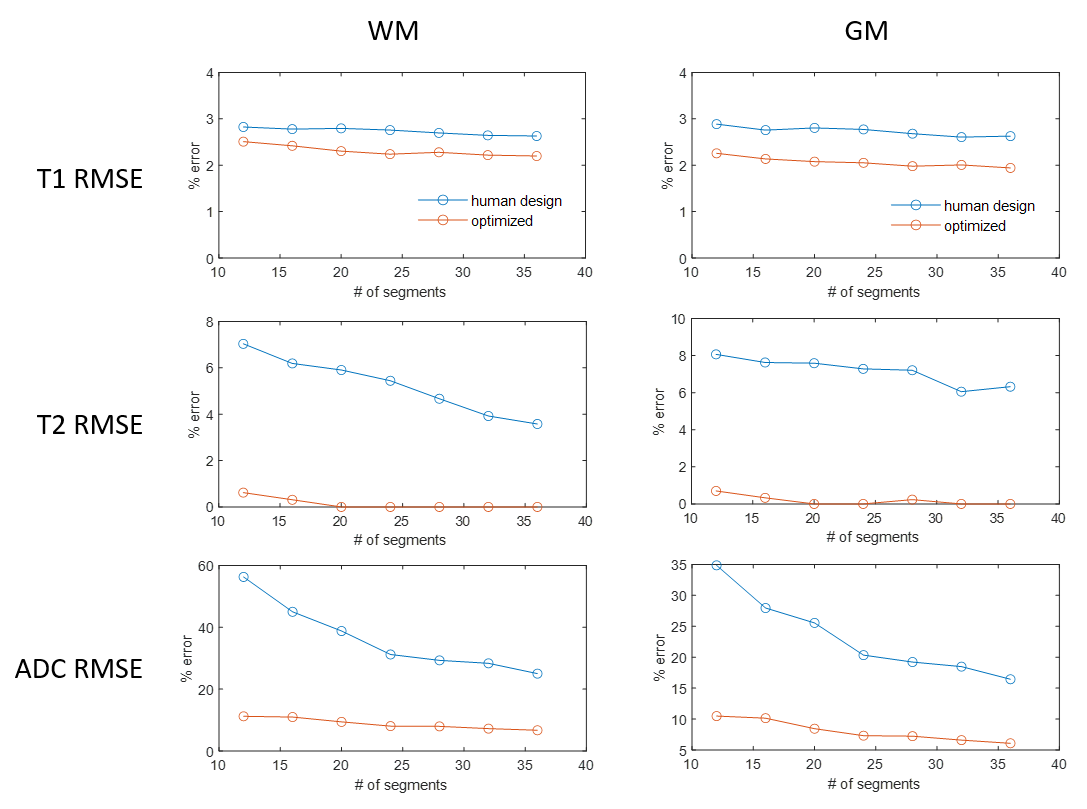
As Figure 2 shows, the human-designed sequence consists of low flip angles in sinusoidal patterns and constant TRs with a long TR at the end of each acquisition segments, resulting in a scan time of 9.9 sec; in the optimized sequence, flip angles and TRs are often saturated to the maximum or minimum alternately, similar to the pattern observed in Zhao et al3, achieving a duration of 8.6 sec. Such a strategy enables higher overall magnetization level as compared to the human-design.Figure 3 shows the percentage RMSE of white matter and gray matter regions in the MRF maps simulated with different levels of Gaussian noise at a fixed sequence length (576 images), Figure 4 shows simulation with sequences concatenated to different length at SNR=2.2. SNR is defined as $$$SNR=\frac{rms(m_{WM})}{σ}$$$, where mWM denotes the WM signal simulated using the human-designed sequence. In both simulations, the optimized sequence shows improved T1 and T2 performance, and significantly higher precision in ADC in similar scan times.
Conclusion
We proposed a CRB-based optimization framework for sequence design of multi-dimensional MRF to achieve increased precision. This optimization paradigm enables flexible searching of optimal sequence parameters on a semi-continuous landscape. It could be extended for sequence designs with higher degrees of freedom and incorporated with other error source models besides Gaussian noise.Acknowledgements
The authors would like to acknowledge funding from Siemens Healthineers and NIH grant EB026764-01 and NS109439-01.References
1. Ma D, Gulani V, Seiberlich N, et al. Magnetic Resonance Fingerprinting. Nature. 2013;495(7440):187-192.
2. Afzali M, Mueller L, Sakaie K, et al. MR Fingerprinting with B-tensor encoding scheme for simultaneous measure of relaxation and microstructure diffusion. 29th Proc Intl Soc Mag Reson Med. 2021:p3439.
3. Zhao B, Haldar JP, Liao C, et al. Optimal experiment design for magnetic resonance fingerprinting: Cramér-rao bound meets spin dynamics. IEEE Trans Med Imaging. 2019;38(3):844-861. doi:10.1109/TMI.2018.2873704
4. Coelho S, Pozo JM, Jespersen SN, Frangi AF. Optimal Experimental Design for Biophysical Modelling in Multidimensional Diffusion MRI. Lect Notes Comput Sci (including Subser Lect Notes Artif Intell Lect Notes Bioinformatics). 2019;11766 LNCS:617-625. doi:10.1007/978-3-030-32248-9_69
5. BIC - The McConnell Brain Imaging Centre: ICBM 152 N Lin 2009. http://www.bic.mni.mcgill.ca/ServicesAtlases/ICBM152NLin2009. Accessed April 8, 2020.
Figures

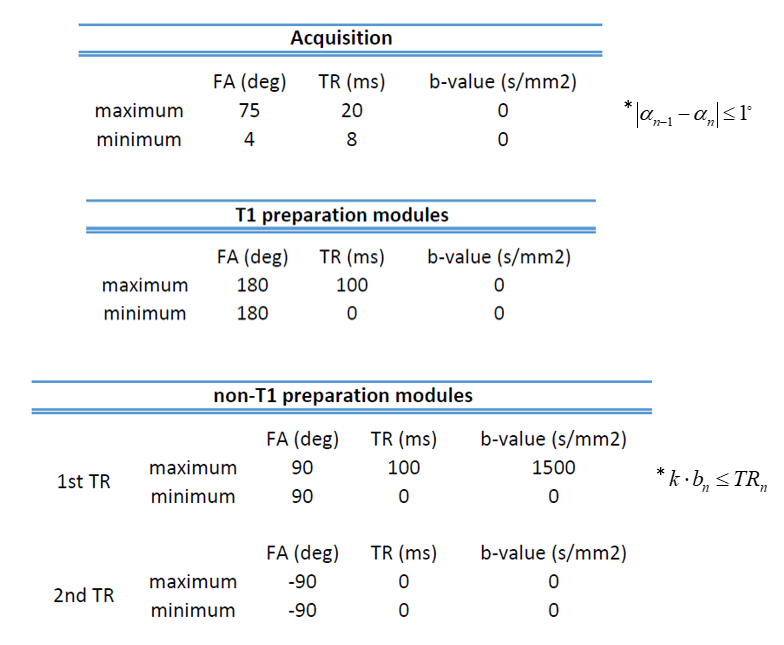
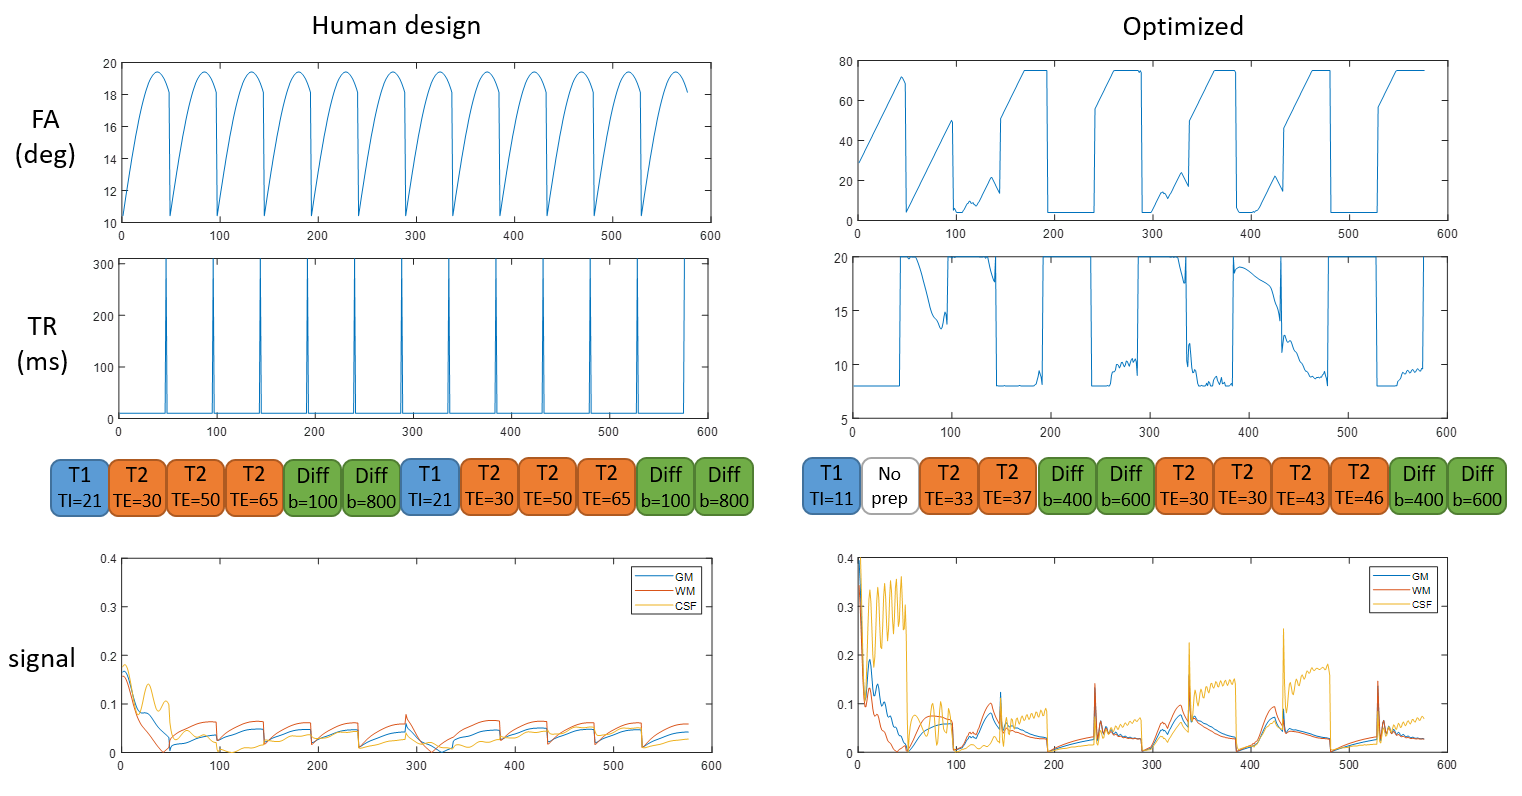
Figure 2: Sequence pattern of the human-designed and the optimized sequence. In the acquisition segments, the human-design shows sinusoidal FA patterns and constant TR with spikes right before the preparations to restore magnetization. FA and TR of the optimized sequence yield saturated and alternating patterns. In preparation modules, one T2-prep transforms to “no prep” (the 7th module was manually set to non-T1 prep in the optimization). The resulting signal evolutions of WM, GM, and CSF from the optimized sequence shows higher magnetization level than the human-design.