4791
Data driven whole-brain cardiac signal regression from highly accelerated fMRI acquisitions1Research Center for Motor Control and Neuroplasticity, KU Leuven, Leuven, Belgium, 2IRCCS San Camillo Hospital, Venice, Italy, 3Department of Data Analysis, Faculty of Psychology and Educational Sciences, Ghent University, Ghent, Belgium
Synopsis
Cardiac pulsation is a physiological confound of fMRI analysis pipelines and so accurate mapping of cardiac contributions to the BOLD signal is highly warranted. To overcome cardiac aliasing associated with the limited temporal resolution in fMRI, we developed a data-driven methodology to spatially and temporally resolve cardiac contributions from the BOLD signal itself (i.e without the need of processing external physiological recordings such as PPU/ECG signals). This is achieved by combining simultaneous multi-slice imaging and a dedicated hyper-sampling decomposition scheme.
The proposed methodology is fully data driven and it does not make specific assumptions on the shape of cardiac pulsation.
INTRODUCTION
Cardiac pulsation1,2,3 is a physiological confound of functional magnetic resonance imaging ($$$fMRI$$$) time-series that introduces spurious fluctuations often mistaken for blood-oxygenation-level-dependent ($$$BOLD$$$) contrast4. The introduction of simultaneous multi-slice ($$$SMS$$$)5 imaging has reduced the changes associated with cardiac aliasing. However, the need for whole-brain coverage plus parallel imaging constraints have so far limited the shortest possible repetition time ($$$TR$$$) to just over 500ms, which is in turn not sufficiently short to resolve cardiac pulsation beyond 60 beats per minute ($$$BPM$$$).While each anatomical location in the brain is sampled once every $$$TR$$$ seconds, the time between consecutive radio-frequency ($$$RF$$$) excitations is considerably shorter and thus adequate to resolve cardiac pulsation6-7. In this study, we show that it is feasible to temporally and spatially resolve cardiac waveforms at each voxel location. This is achieved by combining a hyper-sampling decomposition scheme with highly accelerated $$$SMS$$$ data. The proposed methodology has been developed on a sub-cohort of 302 subjects selected as part of the Human Connectome Project ($$$HCP$$$) database8 and has shown to be a promising tool for accurate mapping of cardiac activity in $$$fMRI$$$.
METHODS
Data acquisitionWe rely on a subset of 302 cases from the $$$HCP$$$ database8. Imaging was performed on Siemens 3T Skyra scanner and consists of resting state $$$fMRI$$$ data acquired with a multiband factor $$$MB=8$$$ at 2mm isotropic resolution and a $$$TR=0.72$$$ seconds. In total, $$$Z=72$$$ slices were acquired for a total number of 1200 frames ($$$NV$$$). Further details in9,10.
Data processing
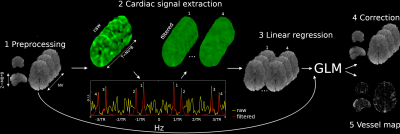
We aim at the extraction of a cardiac regressor from the $$$fMRI$$$ time-series. After data pre-processing (Figure1, step1), the 4D fMRI dataset is processed to extract a cardiac signal regressor (step2). A Generalized Linear Model ($$$GLM$$$) allows the construction of a voxel-wise cardiac regressor (step 3). Finally, cardiac pulsation is regressed out from the $$$fMRI$$$ time-series (step 4) and a vessel (=correlation) map, between the regressor and the pre-processed $$$fMRI$$$ data is computed (step 5). In what follows, a more detailed description of step 2 is provided.
Cardiac signal extraction (step 2)
As first step, a single non spatially resolved cardiac waveform per $$$fMRI$$$ dataset resembling physiological recordings is extracted using the "happy" toolbox7.
If we label with $$$B=\frac{Z}{MB}$$$ the number of $$$RF$$$ excitations per imaging volume, the pre-processed data is re-formatted along the third (slice) and fourth (temporal) dimensions resulting in a hybrid dataset of size $$$MB \times T$$$ (with $$$T=NV \times B$$$) sampled at an effective temporal resolution $$$TS=\frac{TR}{B}=0.08$$$ seconds. Note that some level of processing to remove the effect of the anatomy is required prior to re-formatting7. To resolve cardiac pulsation, the temporal Fourier transform of the hybrid dataset is computed (step 2, bottom). When a group of voxels comprising vessels and/or arteries are sampled successively in time, a cardiac peak (peak number 1 of Figure1) emerges from the background noise. Although efforts were made to reduce spikes of temporal adjacent slices, each slice samples different parts of the brain and so some level of spurious fluctuations is introduced. More specifically, since in $$$fMRI$$$ the same anatomical locations are sampled successively every $$$TR$$$ seconds, spurious fluctuations are semi-periodic in $$$\frac{1}{TR}$$$. Thus, in addition to the super resolved cardiac peak number 1, three cardiac replica (peaks number 2, 3 and 4) can be observed. These are placed symmetrically with respect to frequencies $$$\frac{1}{TR}$$$ and $$$\frac{3}{TR}$$$. The four cardiac peaks are isolated using a bank of pass-band filters centred based on the information retrieved from the cardiac trace returned by happy (step 2, top right). The extracted cardiac components are then re-formatted to match the spatial and temporal resolution of the original $$$fMRI$$$ grid.
Validation
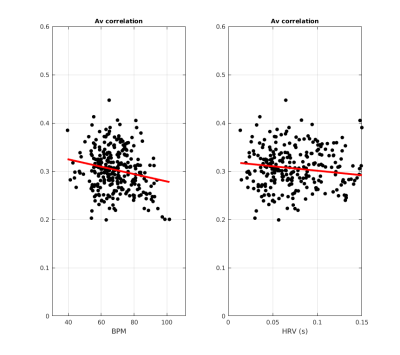
Vessel maps are retrieved by considering the 95th percentile value from the voxel intensity distribution of the correlation maps. The performance of the method is evaluated by extracting the average correlation scores within these regions across subjects. In particular, we investigate whether a relationship between these correlation scores and the average $$$BPM$$$ exists. The same procedure is repeated for the heart-rate-variability ($$$HRV$$$).
RESULTS
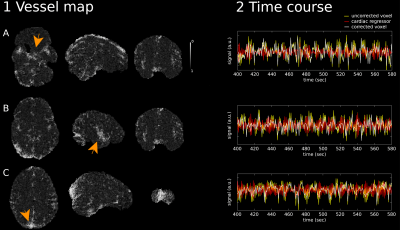
The correlation between the $$$fMRI$$$ data and the cardiac signal regressor is maximum in proximity to vessels and brain arteries (Figure2, left). This includes (although not restricted to) (A) the circle of Willis, (B) the middle cerebral artery and (C) the sagittal sinus areas. Figure2 (right) suggests that the application of the proposed methodology reduces high-frequency variations due to cardiac aliasing.Mean ± standard deviation of the correlation scores across subjects was $$$0.30 ± 0.04$$$ within the vessel maps. There was a significant ($$$p<0.05$$$) negative relationship between correlation scores against average $$$BPM$$$ ($$$-0.0014*BPM + 0.3978$$$, Figure 3, left) and $$$HRV$$$ ($$$-0.1970*HRV + 0.3206$$$, Figure 3, right).
DISCUSSION AND CONCLUSION
In this study, we show that a hyper-sampling decomposition scheme combined with highly accelerated $$$SMS$$$ data can be employed to spatio-temporally resolve cardiac waveforms in $$$fMRI$$$. Future work will be oriented towards a direct comparison against conventional model-based methods such as RETROICOR11.The proposed methodology is fully data driven, it does not make specific assumptions on the shape of cardiac pulsation, and it can be employed to retrospectively correct $$$fMRI$$$ data when physiological recordings are not available.
Acknowledgements
MM was funded by
Research Foundation Flanders (FWO) (postdoctoral fellowship 1211820N to MM). This study was supported by a Ministry of Health
Operating Grant to San Camillo IRCCS Venice and by GR-2019-12368960 from the Italian Ministry of Health to GP.
Data used in the preparation of this work were obtaineàd from the MGH-USC Human Connectome Project (HCP) database (https://ida.loni.usc.edu/login.jsp). The HCP project (Principal Investigators : Bruce Rosen, M.D., Ph.D., Martinos Center at Massachusetts General Hospital; Arthur W. Toga, Ph.D., University of Southern California, Van J. Weeden, MD, Martinos Center at Massachusetts General Hospital) is supported by the National Institute of Dental and Craniofacial Research (NIDCR), the National Institute of Mental Health (NIMH) and the National Institute of Neurological Disorders and Stroke (NINDS). Collectively, the HCP is the result of efforts of co-investigators from the University of Southern California, Martinos Center for Biomedical Imaging at Massachusetts General Hospital (MGH), Washington University, and the University of Minnesota. HCP data are disseminated by the Laboratory of Neuro Imaging at the University of Southern California.
References
1. Krüger G, Glover GH. Physiological noise in oxygenation - sensitive magnetic resonance imaging. Magn Reson Med 2001;46(4):631–637.
2. Triantafyllou C, Hoge RD, Krueger G, et al. Comparison of physiological noise at 1.5T, 3T and 7T and optimization off MRI acquisition parameters. Neuroimage 2005;26(1):243–250.
3. Liu CSJ, Miki A, Hulvershorn J, et al. Spatial and temporal characteristics of physiological noise in fMRI at 3T. Acad. Radiol 2006;13(3):313–323.
4. Ogawa S, Lee TM, Kay AR, et al. Brain magnetic resonance imaging with contrast dependent on blood oxygenation. PNAS 1990;87(24):9868–9872.
5. Larkman DJ, Hajnal JV, Herlihy AH, et al. Use of multicoil arrays for separation of signal from multiple slices simultaneously excited. J. Magn. Reson. Imaging 2001;13(2):313–317.
6. Voss HU. Hypersampling of pseudo-periodic signals by analytic phase projection. Comput. Biol. Med. 2018;98:159–167.
7. Aslan S, Hocke L, Schwarz N, et al. Extraction of the cardiac waveform from simultaneous multislice fMRI data using slice sorted averaging and a deep learning reconstruction filter. Neuroimage 2019;198:303–316.
8. Van Essen DC, Smith SM, Barch DM, et al. The WU-Minn human connectome project: an overview. Neuroimage 2013;80:62–79.
9. Uğurbil K, Xu J, Auerbach EJ, et al. Pushing spatial and temporal resolution for functional and diffusion MRI in the Human Connectome Project. Neuroimage 2013;80:80–104.
10. Glasser MF, Sotiropoulos SN, Wilson JA, et al. The minimal preprocessing pipelines for the Human Connectome Project. Neuroimage 2013;80:105–124.
11. Glover GH, Li TQ, Ress D. Image-based method for retrospective correction of physiological motion effects in fMRI: RETROICOR. Magn Reson Med 2000;44(1):162–167.
Figures


Figure2: Performance of the proposed approach in one representative case. Left: Correlation/Vessel map between the pre-processed fMRI data and the cardiac signal regressor in the (A) circle of Willis, (B) middle cerebral artery and (C) sagittal sinus. Right: 3 minutes extract of fMRI recordings from the pre-processed data (yellow), the calculated cardiac signal regressor (red) and the corrected voxel time-series (white). The spatial location of the selected voxels is indicated by the orange arrows.
