4788
Identification of Hemodynamic Biomarkers for Bicuspid Aortic Valve induced Aortic Dilation using Machine Learning1Biomedical Imaging Center, School of Engineering, Pontificia Universidad Católica de Chile, Santiago, Chile, 2Electrical Engineering Department, School of Engineering, Pontificia Universidad Católica de Chile, Santiago, Chile, 3Millennium Nucleus for Cardiovascular Magnetic Resonance, Santiago, Chile, 4School of Biomedical Engineering, Universidad de Valparaíso, Valparaíso, Chile, 5Department of Cardiology, Hospital Universitari Vall d’Hebron, Vall d’Hebron Institut de Recerca (VHIR), Universitat Autònoma de Barcelona, Barcelona, Spain, 6Deparment of Computer Science, Pontificia Universidad Católica de Chile, Santiago, Chile, 7Radiology Department, School of Medicine, Pontificia Universidad Católica de Chile, Santiago, Chile
Synopsis
Several studies have demonstrated the existence of altered hemodynamics in bicuspid aortic valve (BAV) patients. The objective of this study was to identify which hemodynamic parameters allow an accurate classification between BAV patients with dilated and non-dilated ascending aorta using machine learning (ML) algorithms.
Introduction
The bicuspid aortic valve (BAV) is the most common congenital cardiac defect1. A significant number of patients present aortic dilation, which is associated with complications, such as aortic dissection or rupture2. Recent reports highlighted the presence of abnormal flow conditions in these patients3-6 and that several hemodynamic descriptors predict aneurysms evolution7,8. Given the large number of possible hemodynamic descriptors retrieved from 4D flow CMR, there is a need for the identification of a limited number of them to refine disease monitoring and improve patient risk stratification. This study aimed to identify a clinically meaningful subset of hemodynamic biomarkers for BAV patients that better relate to aortic dilation. For that purpose, we applied machine learning algorithms to recognize healthy volunteers and BAV patients with and without ascending aorta dilation, identifying a few hemodynamic parameters related to aortic dilation in BAV patients.Methods
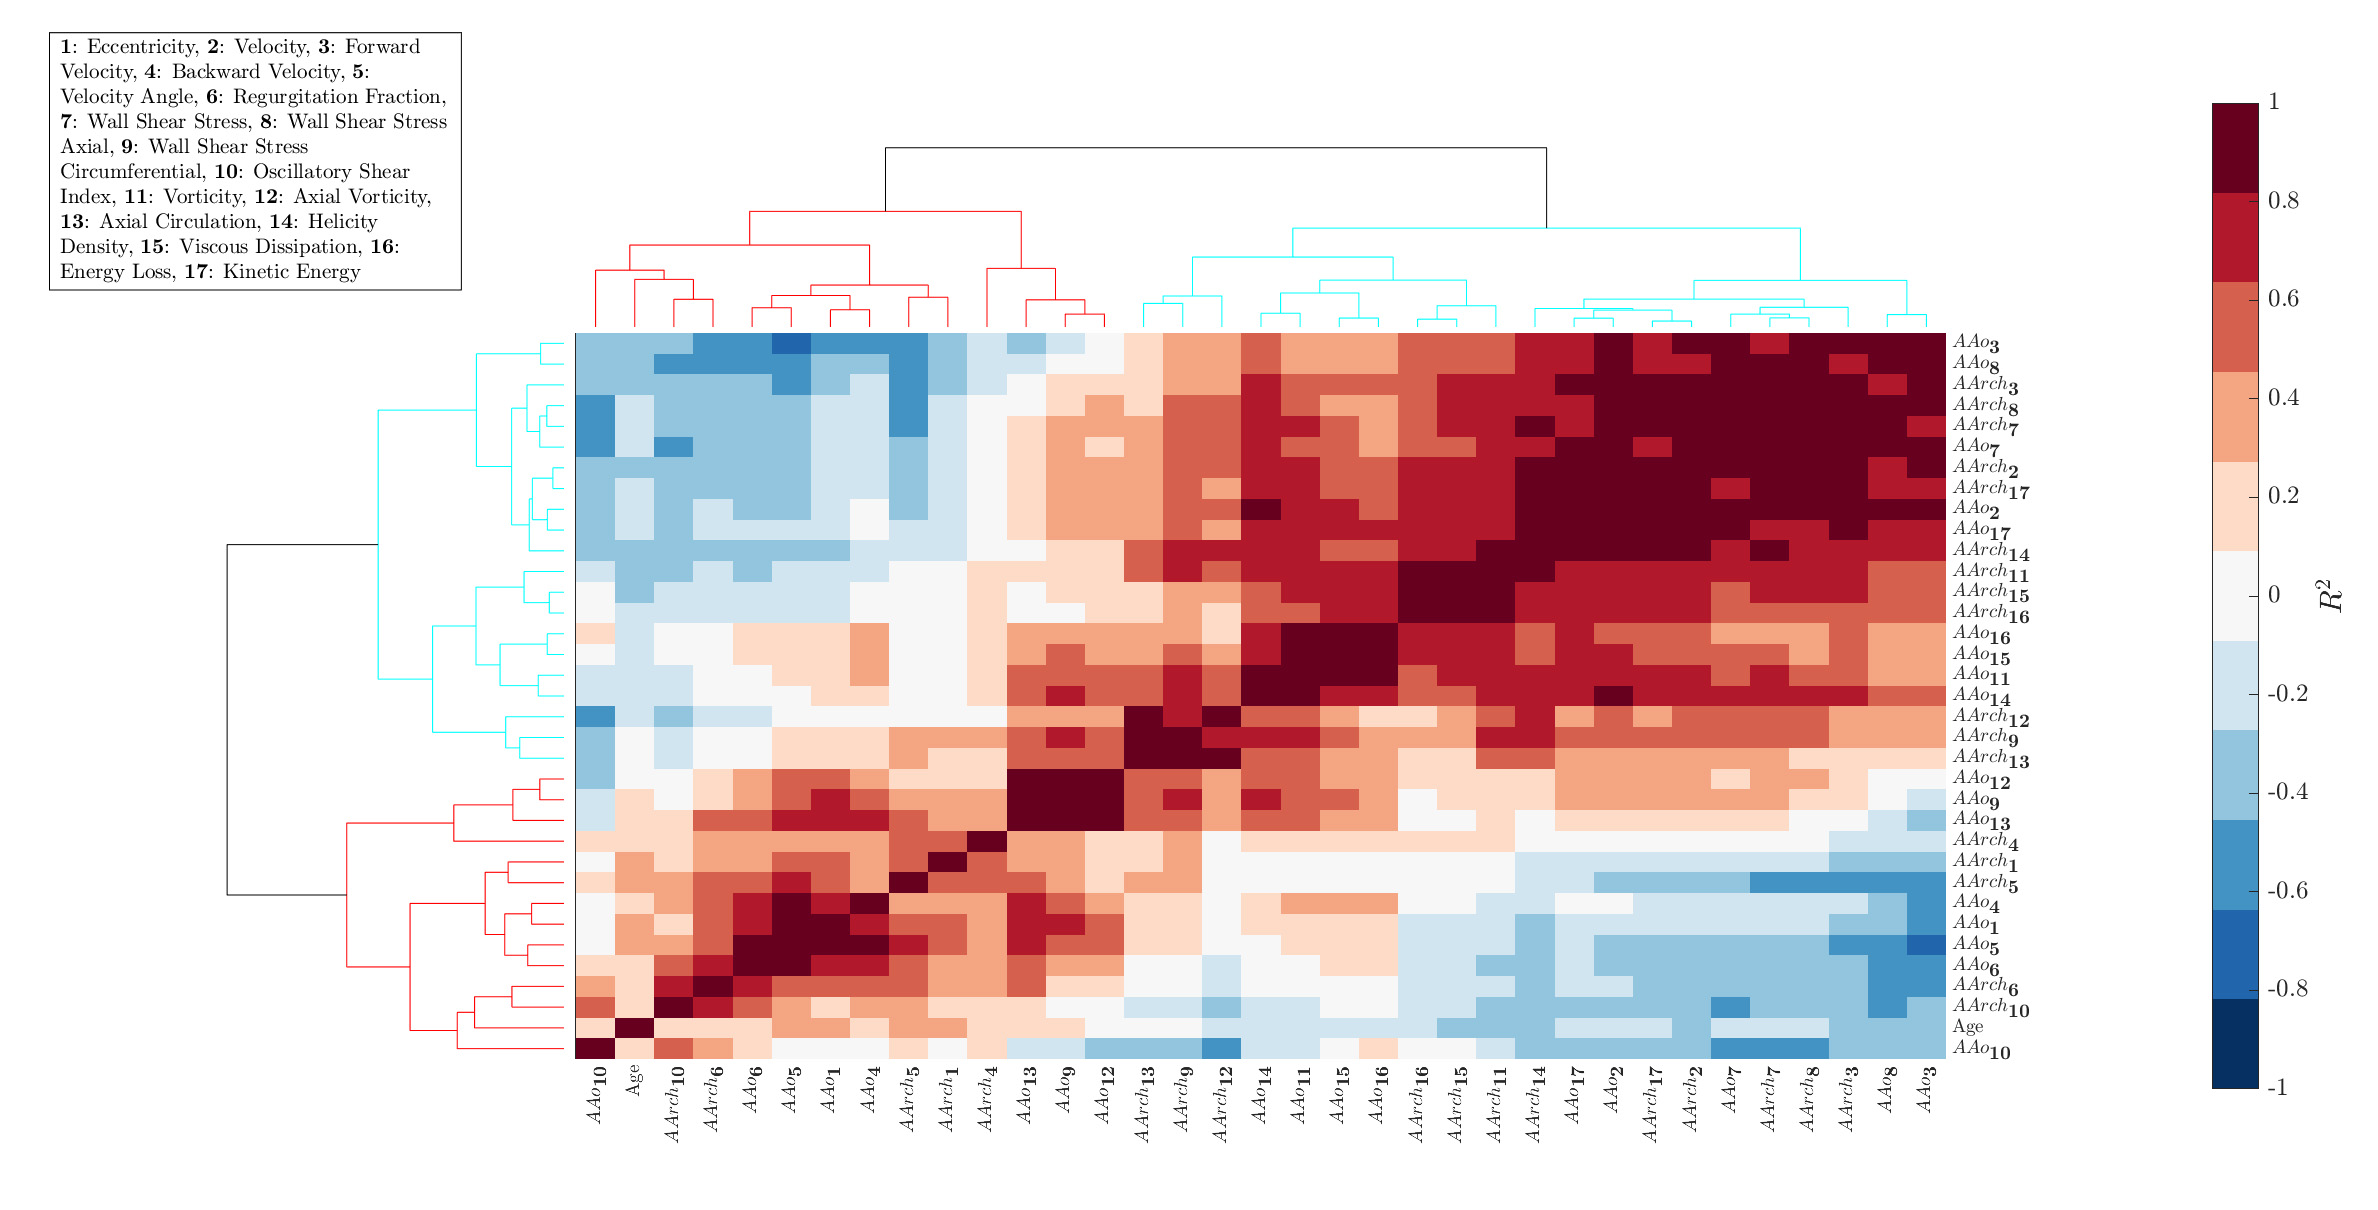
4D flow MRI data of 48 healthy volunteers and 67 BAV (73% with AAo dilation) patients were acquired in a 1.5T GE-MR Signa Scanner using the VIPR sequence9. Table 1 shows the clinical data. In-vivo image processing and quantification are fully described elsewhere3-5,10. The mean hemodynamic parameters were calculated in the ascending aorta (AAo) and aortic arch (AArch) at peak systole. Furthermore, a machine learning model was designed to select hemodynamic parameters that adequately separate healthy volunteers (HV) and BAV patients (non- and dilated ascending aorta) using sequential forward selection (SFS) and principal component analysis (PCA). The used classifiers were minimum distance, linear discriminant analysis (LDA), k-nearest neighbors (KNN), quadratic discriminant analysis, Mahalanobis distance, support vector machine (SVM), neural network, and random forest. The performance of the classification was evaluated using stratified 10-fold cross-validation. A confusion matrix was constructed based on prediction results in each training and validation sample. The sensitivity, specificity, precision, and accuracy of the search strategies were calculated11. Additionally, the Pearson correlation method was used to calculate the correlation matrix between all the hemodynamic parameters. Hierarchical clustering was then applied to classify its rows/columns into different groups12,13.Results
Figure 1.a. shows the maximum separability obtained by each of the 17 hemodynamic features. Only five of them have the lowest values and they correspond to velocity angle, forward velocity, vorticity, and backward velocity in AAo; and helicity density in AArch. Figure 1.b. shows the two principal components of PCA, explaining 68.94% of the variation. Finally, Figure 1.c. shows a bar graph of the quality of representation of the variables on factor maps on all the dimensions. The five top-performing features were forward velocity, velocity, and velocity angle in AAo; and velocity and energy loss in AArch. Using features selected by SFS, common classifiers as KNN resulted in an accuracy of over 86% and 91.34% accuracy with SVM-Linear. Using features selected by PCA, almost all classifiers were close to 90% accuracy. The best result was obtained by combining five features selected by SFS in LDA, reaching a 96.31 ± 1.76 % accuracy, followed by SFS followed by random forest, which resulted in 96.00 ± 0.83 % accuracy, as shown in Table 2. Figure 2 shows ROC curves for both combinations with the best performance (LDA and random forest) using five features selected by SFS. We noted that the ROC curves for HV and DIL BAV classes are roughly similar, indicating that the methods are able to capture distinguishing features for these classes. Nevertheless, the classification of DIL BAV resulted in lower accuracy, possibly a result of data unbalance, jeopardizing the results. Finally, analysis of the hierarchical clustering (Figure 2) shows that the parameters selected by SFS corresponded to three different clusters. Conversely, parameters selected by PCA corresponded to mainly one cluster, which may explain the lower accuracy of the classifiers when using PCA for feature selection.Conclusions
Five hemodynamic features (velocity angle, forward velocity, vorticity, and backward velocity in AAo and helicity density in AArch) can characterize BAV patients with aortic dilation. Also, we validate how relevant are these features in a classification problem. One of the strengths of our study is that it provides a comprehensive overview of the relative performance of different ML algorithms for disease prediction. Hence, non-linear interactions can be associated with the selected features that better identify HV and BAV patients. This important information of relative performance can be used to aid researchers in the selection of an appropriate ML algorithm for their studies.Acknowledgements
Acknowledgements This work has been funded by projects PIA-ACT192064 and the Millennium Nucleus on Cardiovascular Magnetic Resonance NCN17_129 of the Millennium Science Initiative, both of the National Agency for Research and Development, ANID. The authors also thanks to Fondecyt project 1181057 also by ANID. Franco P. thanks to ANID – PCHA/ Doctorado-Nacional/2018-21180391. Sotelo J. thanks to CONICYT - FONDECYT Postdoctorado 2017 #3170737 and ANID - FONDECYT de Iniciación en Investigación #11200481. Guala A. has received funding from Spanish Ministry of Science, Innovation and Universities (IJC2018-037349-I).References
1.- Siu SC, Silversides CK. Bicuspid aortic valve disease. J Am Coll Cardiol 2010;22;55(25):2789-800.
2.- Evangelista A, Gallego P, Calvo-Iglesias et al. Anatomical and clinical predictors of valve dysfunction and aortic dilation in bicuspid aortic valve disease. Heart. 2018;104:566–573.
3.- Sotelo J, Urbina J, Valverde I, et al. 3D Quantification of Wall Shear Stress and Oscillatory Shear Index Using a Finite-Element Method in 3D CINE PC-MRI Data of the Thoracic Aorta. IEEE Trans Med Imaging. 2016;35(6):1475-87.
4.- Sotelo J, Dux-Santoy L, Guala A, et al. 3D axial and circumferential wall shear stress from 4D flow MRI data using a finite element method and a laplacian approach. Magn Reson Med 2017;0:0-0
5.- Sotelo J, Dux-Santoy L, Guala A, et al. Comprehensive analysis of Hemodynamic parameters in patients with bicuspid aortic valve using 4D Flow data and a finite element method, 2018. ISMRM anual meeting, Jun 16-21th, Paris, France.
6.- Dux-Santoy L, Guala A, Sotelo J, et al. Low and Oscillatory Wall Shear Stress Is Not Related to Aortic Dilation in Patients With Bicuspid Aortic Valve: A Time-Resolved 3-Dimensional Phase-Contrast Magnetic Resonance Imaging Study, Arterioscler Thromb Vasc Biol. 2020 Jan;40(1):e-10-e20.
7.- Soulat G., Scott MB., Allen BD., et al. Association of Regional Wall Shear Stress and Progressive Ascending Aorta Dilation in Bicuspid Aortic Valve. JACC Cardiovasc Imaging 2021. Doi: 10.1016/j.jcmg.2021.06.020.
8.- Andrea Guala, Lydia Dux-Santoy, Gisela Teixido-Tura, Aroa Ruiz-Muñoz, Laura Galian-Gay, Maria Luz Servato, Filipa Valente, Laura Gutiérrez, Teresa González-Alujas, Kevin M. Johnson, Oliver Wieben, Guillem Casas-Masnou, Augusto Sao Avilés, Ruben Fernandez-Galera, Ignacio Ferreira-Gonzalez, Arturo Evangelista, Jose F. Rodríguez-Palomares. Wall shear stress predicts aortic dilation in patients with bicuspid aortic valve. In press JACC cardiovascular imaging doi: https://doi.org/10.1016/j.jcmg.2021.09.023
9.- Gu T, Korosec FR, Block WF, et al. PC VIPR: a high-speed 3D phase-contrast method for flow quantification and high-resolution angiography. AJNR Am J Neuroradiol. 2005;26(4):743-9.
10.- Dux-Santoy L, Guala A, Sotelo J, et al. Low and Oscillatory Wall Shear Stress Is Not Related to Aortic Dilation in Patients With Bicuspid Aortic Valve: A Time-Resolved 3-Dimensional Phase-Contrast Magnetic Resonance Imaging Study, Arterioscler Thromb Vasc Biol. 2020 Jan;40(1):e-10-e20.
11.- Witten I and Frank E, Data mining: practical machine learning tolls and techniques, San Mateo (2nd ed.), 2005
12.- Gu Y, Wang C. A Study of Hierarchical Correlation Clustering for Scientific Volume Data, Advances in Visual Computing, 2010, Volume 6455. ISBN: 978-3-642-17276-2
13.- Ciaburro G. MATLAB for Machine Learning: Practical examples of regression, clustering and neural networks, Publisher: Packt Publishing, 2017, ISBN: 978-1788398435
Figures