4783
Cartesian dictionary-based T1 and T2 mapping of the myocardium1Linköping University, Linköping, Sweden
Synopsis
A method for simultaneous T1 and T2 mapping of the myocardium is proposed, termed Multimapping, based on dictionary matching using a simple Cartesian single-shot acquisition across 10 cardiac cycles. The method is evaluated in a phantom, 12 healthy subjects and 43 patients with suspected cardiomyopathy.
Introduction
There is a growing interest in developing simultaneous T₁ and T₂ mapping for CMR, for example using the MR fingerprinting paradigm which combines advanced and complicated non-Cartesian trajectories with dictionary matching [1,2]. Here, a simple single-shot Cartesian dictionary matching approach is proposed, termed Multimapping, and evaluated in the NIST/ISMRM phantom, 12 healthy subjects and 43 patients with different cardiomyopathies.Methods
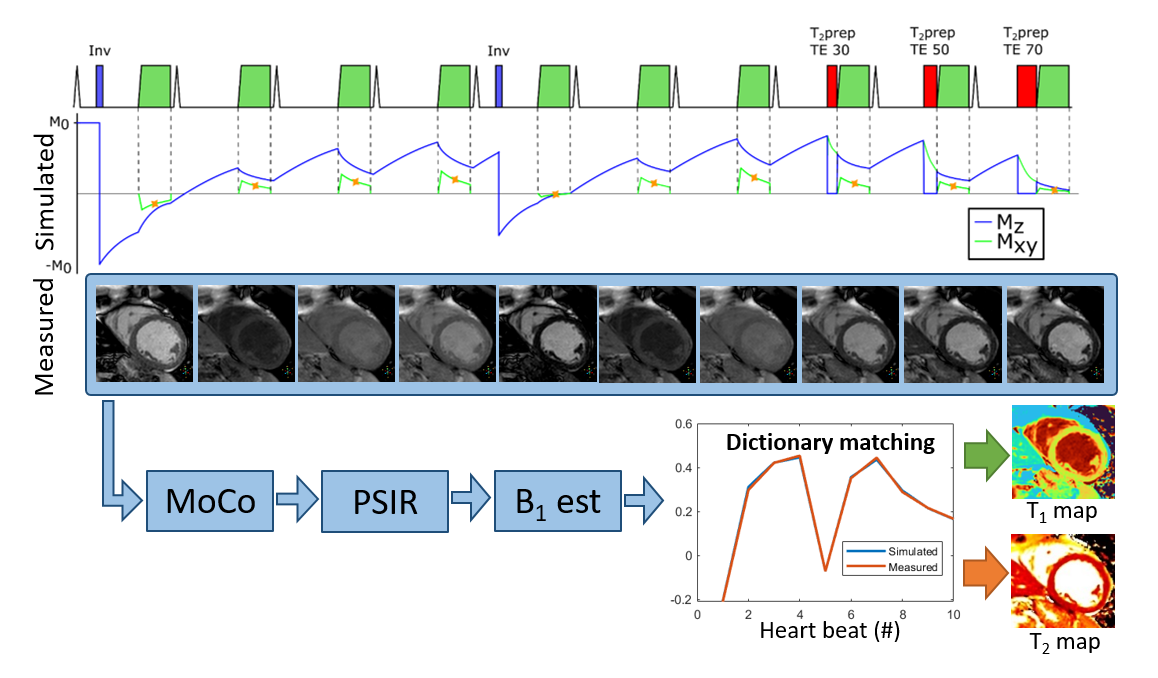
Multimapping consists of ECG-triggered Cartesian single-shot bSSFP acquisitions in 10 consecutive cardiac cycles (Figure 1). Inversion pulses are performed in the 1st and 5th cycle for T₁ sensitivity, and T₂prep with TE= 30, 50 and 70ms in the last 3 cycles for T₂ sensitivity. RR intervals are recorded and a subject specific dictionary is simulated using the extended phase graph framework. Motion correction and phase sensitive inversion recovery correction [3] is performed on the reconstructed images. B1 mapping is subsequently performed using dictionary matching with coarsely sampled T1 and T2, and B1 in the range (initial value:step size:final value) 0.4:0.05:1. B1 estimation is performed by manually selecting a region-of-interest in the myocardial septum, and the mean ROI B1 value is then applied globally to generate highly resolved T1 (200:1:2500) and T2 (5:1:150) maps using dictionary matching, finding the closest match between simulation (corresponding to k-space center acquisitions) and measurement. Multimapping imaging parameters are identical to conventional MOLLI, apart from the flip angle which is 50°.Experiments were performed on a 1.5T scanner. Multimapping was evaluated in the ISMRM/NIST phantom, considering T₁ from 200 to 2100ms and T₂ from 20 to 400ms (dictionary ranges were adjusted for the phantom experiments), simulating heart rates from 40bpm to 120bpm with 20bpm increments. Native Multimapping was performed in 12 healthy subjects with MOLLI and T₂prep bSSFP (T₂bSSFP) as reference. Native Multimapping was also performed in 43 clinical patients with suspected cardiomyopathies: 18 acute myocarditis, 5 hypertrophic cardiomyopathy (HCM) and 7 dilated cardiomyopathy (DCM), and 13 others. In 28 patients post-contrast Multimapping was performed for synthetic ECV calculation.
Results
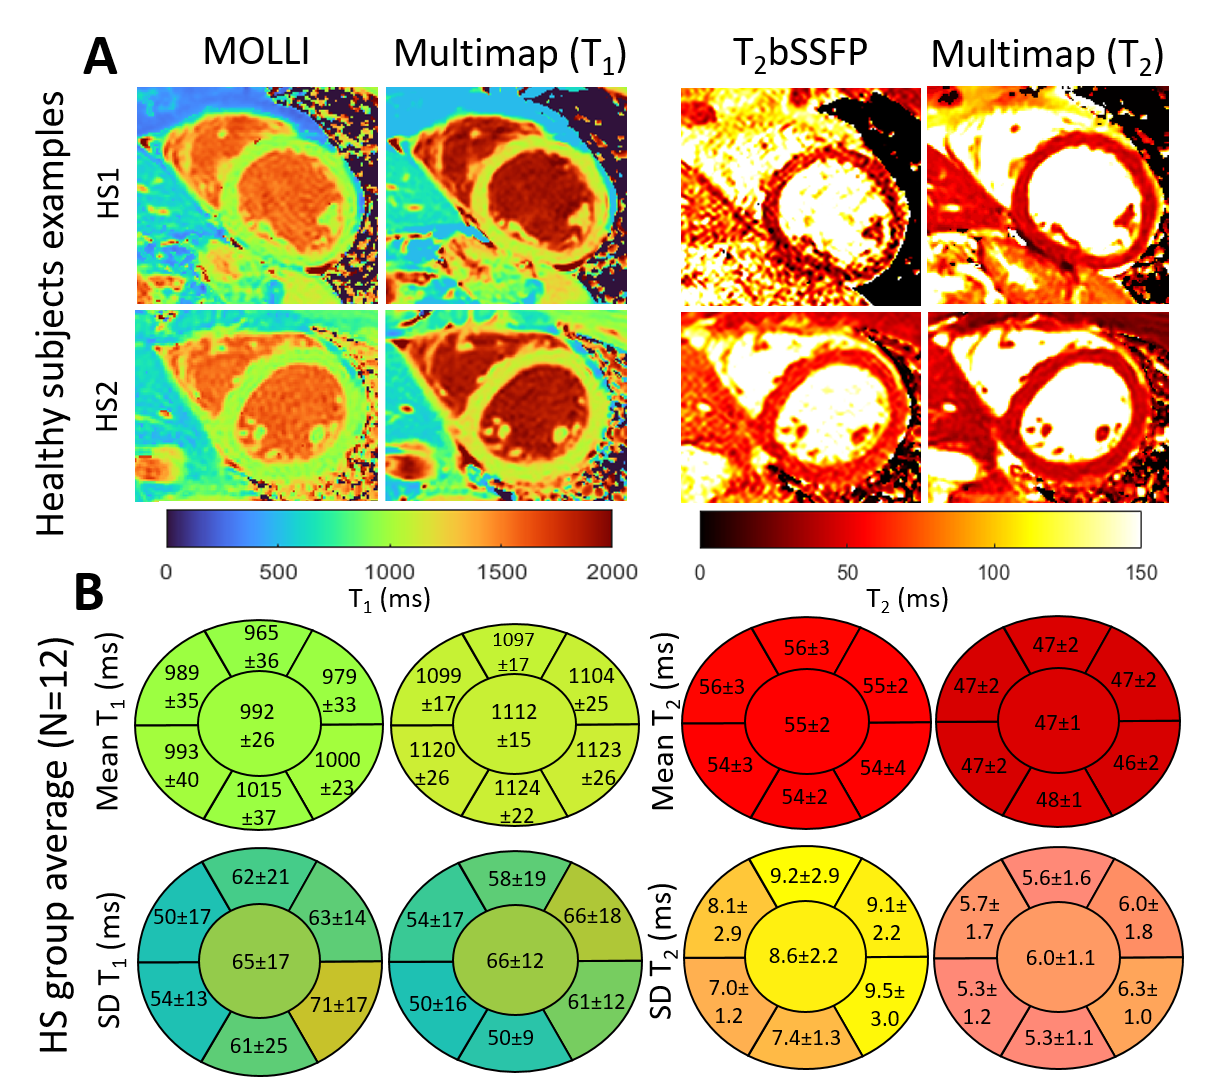
In the phantom study, the R² between T₁ and T₂ estimated using Multimapping compared to reference spin echo values was above 0.99 for all simulated heart-rates, with small bias (<2%) for all vials.Comparable image quality between Multimapping and reference techniques was observed in the healthy subjects (Figure 2). Bullseye plots of the healthy subject group mean T₁ and T₂ measurements and T₁ and T₂ standard deviation (SD) are shown in Figure 2, including segmental and global measurements. Group-wise mean T₁ for the entire slice were higher using Multimapping (T₁=1112±15ms) compared to MOLLI (T₁=992±26ms; p<0.01). Mean Multimapping T₂ (47.3±1.4ms) was lower compared to T₂bSSFP (T₂=54.9±2.4ms; p<0.001). There was no difference in T₁ SD between Multimapping (66.1±12.3ms) and MOLLI (65.2±16.8ms; p=0.77). However, T₂ SD was significantly lower for Multimapping (6.0±1.1ms) compared to T2bSSFP (8.6±2.2ms; p<0.01).
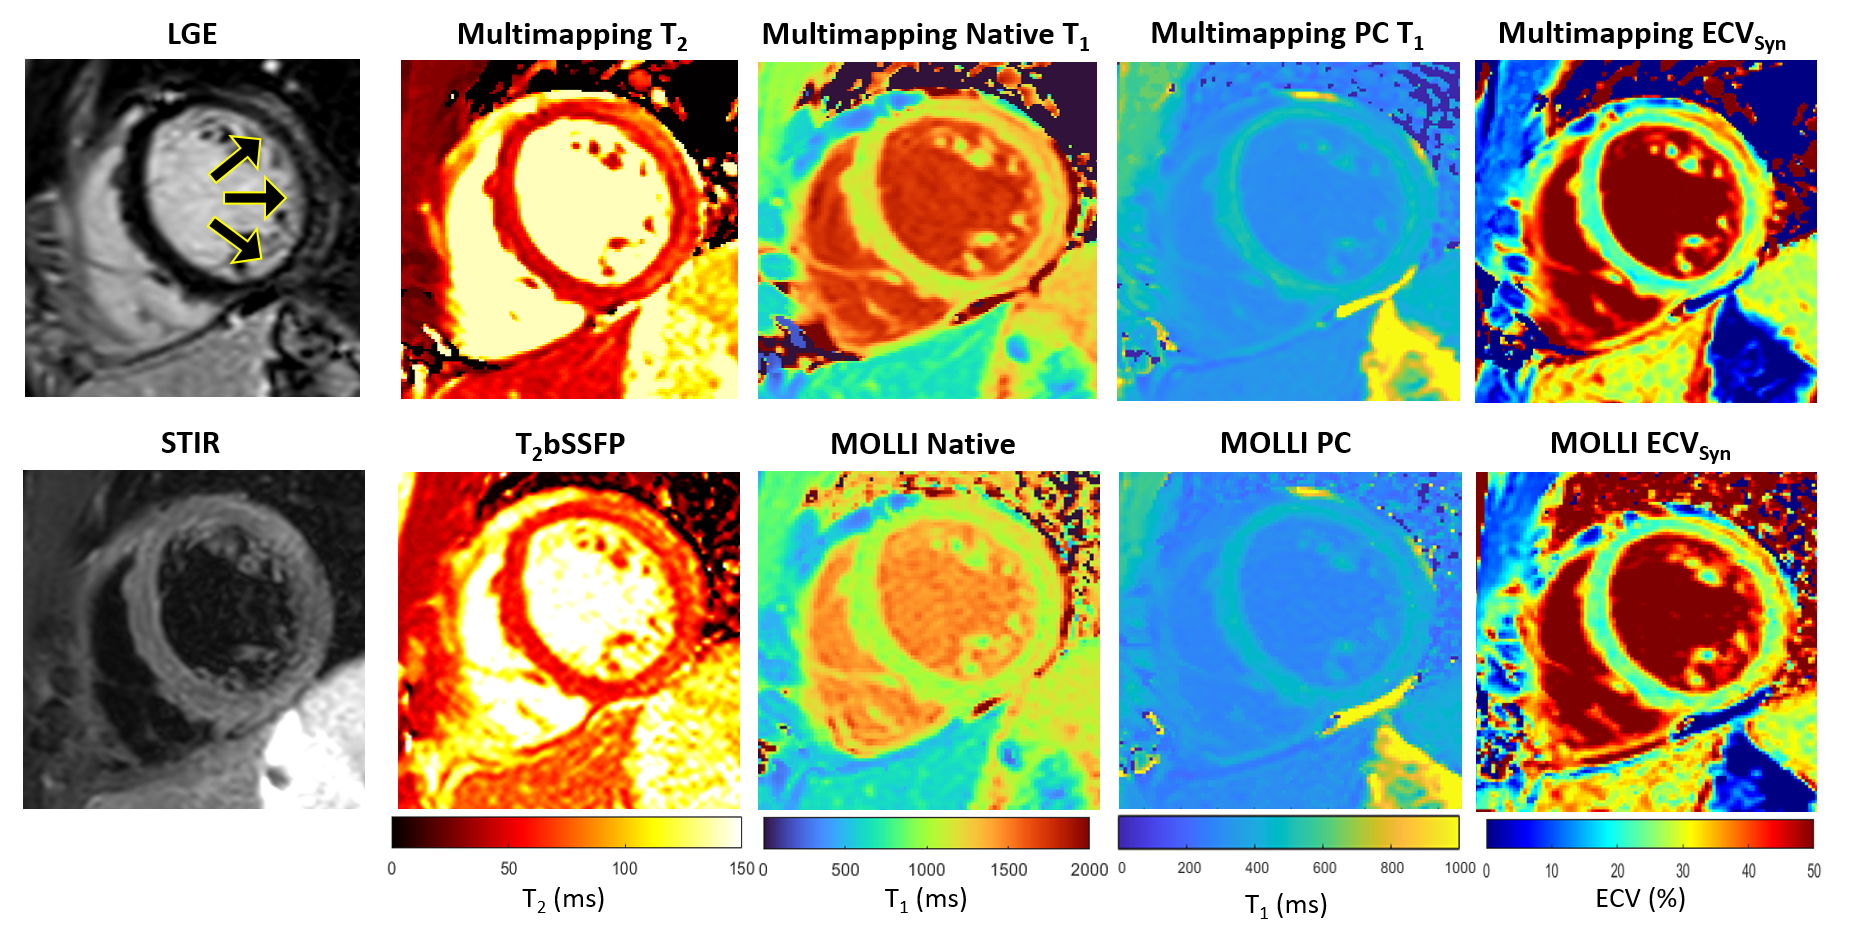
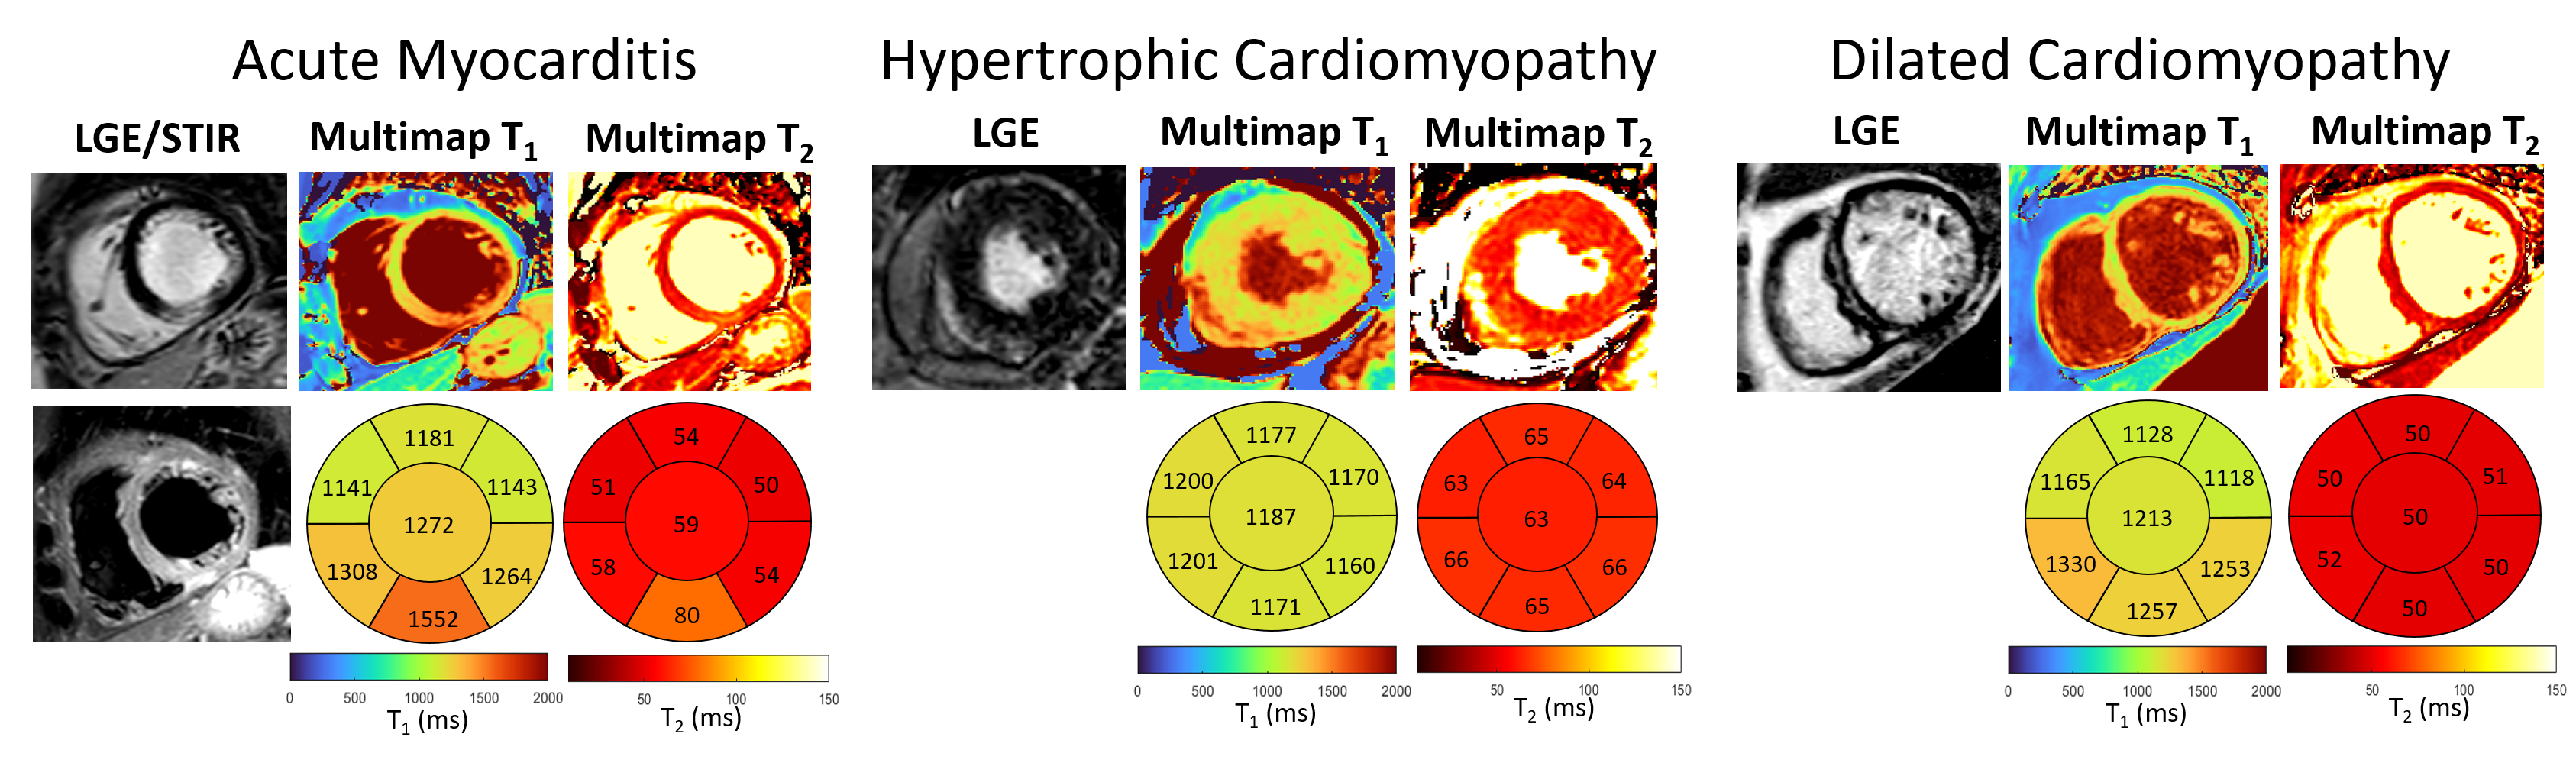
Multimapping images from an acute myocarditis patient (Figure 3) depicts focal inflammation in the T1, T2 and ECV Multimapping images, in agreement with the qualitative and quantitative in-vivo reference techniques. Representative Multimaps from three patients (acute myocarditis, HCM and DCM) are shown in Figure 4 with increased T1 and T2 compared to values measured in healthy subjects.
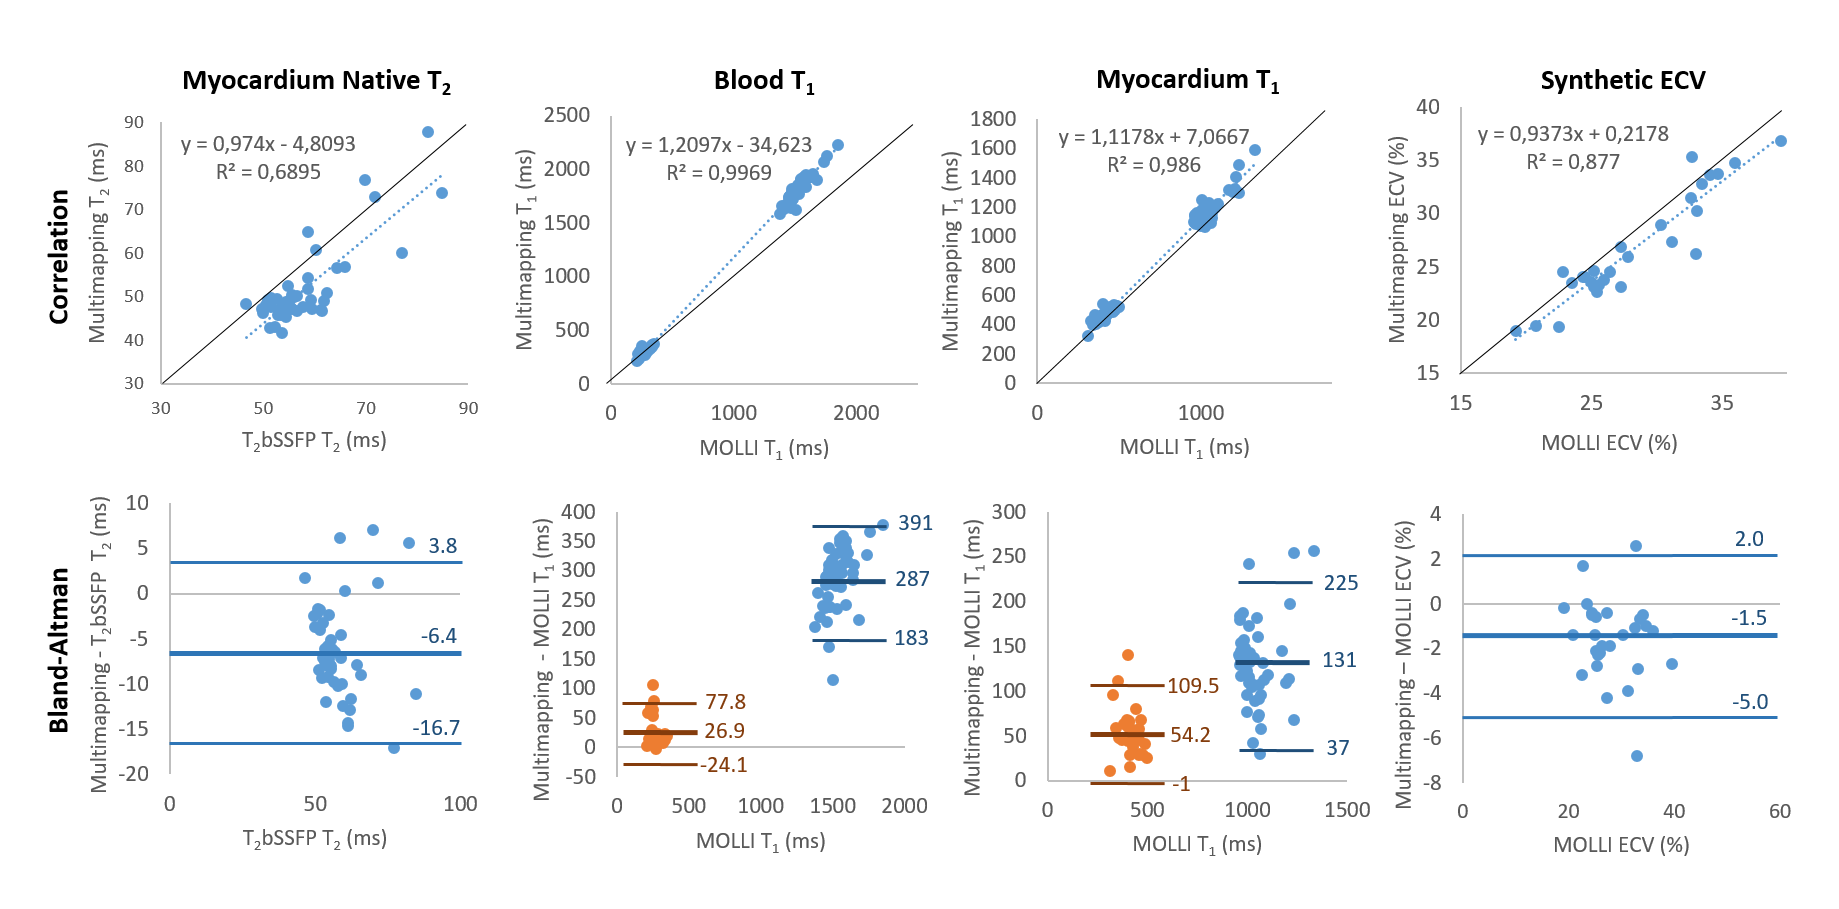
Measurements from the 43 patients derived from MOLLI (T1/ECV) or T2bSSFP (T2) and Multimapping were compared using correlation and Bland–Altman plots (Figure 5). Multimapping blood and myocardium T1 showed very high correlation with MOLLI (R2>0.98) but with substantial bias, particularly for native blood (287ms). High correlation was also found for ECV (R2=0.88) with a bias of -1.5%.
Discussion
Here, Multimapping is proposed for simultaneous myocardial T₁ and T₂ mapping in 10 cardiac cycles using a simple Cartesian trajectory. Unlike conventional cardiac MRF, Multimapping does not suffer from signal aliasing intrinsic to non-Cartesian MRF. However, the number of data points that can be used to match measurements to simulations for each dictionary entry are smaller for Multimapping by nearly two orders of magnitude (10 measurements for Multimapping versus approximately 1000 for conventional cardiac MRF). Although the number of acquired images could be increased to mitigate against overfitting, this would either increase the breath-hold duration or require the use of free-breathing acquisitions. An advantage of avoiding signal aliasing in the measurements, particularly for cardiothoracic applications, is that tissue outside the region-of-interest such as subcutaneous fat does not degrade the measurements. Solutions to this problem for cardiac MRF have relied on non-Cartesian multi-echo acquisition strategies which lowers the acquisition efficiency and requires more complicated reconstruction algorithms [2].Studies in healthy subjects showed consistently different T₁ and T₂ values between Multimapping and MOLLI/T₂bSSFP. However, the T₂ SD was significantly lower for Multimapping compared to T₂bSSFP. The patient studies demonstrated that Multimapping can capture myocardial pathology, yielding high correlations with the in-vivo reference methods. Although biases between Multimapping and MOLLI/T2bSSFP was observed in the patients, the in-vivo reference techniques are not the most accurate. MOLLI underestimates myocardial native T1 and post-contrast T1 and overestimates ECV [4], while T2bSSFP yield different T2 compared to alternative techniques [5]. Further studies are required to assess Multimapping reproducibility and establish T₁ and T₂ values for health and disease for all clinical field strengths.
Acknowledgements
The author would like to thank Dr Anders Tisell for lending the ISMRM/NIST phantom for these experiments.References
[1]. Hamilton JI, et al. MR fingerprinting for rapid quantification of myocardial T1, T2, and proton spin density. Magn Reson Med. 2017;77(4):1446–58.
[2]. Jaubert O, et al. Water–fat Dixon cardiac magnetic resonance fingerprinting. Magn Reson Med. 2020;83(6):2107–23.
[3]. Xue H, et al. Phase-sensitive inversion recovery for myocardial T1 mapping with motion correction and parametric fitting. Magn Reson Med. 2013;69(5):1408-20.
[4]. Nordlund D, et al. Measuring extracellular volume fraction by MRI: First verification of values given by clinical sequences. Magn Reson Med. 2020;83(2):662-672.
[5]. Baeßler B, et al. A systematic evaluation of three different cardiac T2-mapping sequences at 1.5 and 3T in healthy volunteers. Eur J Radiol. 2015;84(11):2161-70.
Figures