4782
Improving Accuracy of Myocardial T1 Estimation in MyoMapNet1Department of Medicine (Cardiovascular Division), Beth Israel Deaconess Medical Center and Harvard Medical School, Boston, MA, United States, 2Institute of Science and Technology for Brain-Inspired Intelligence, Fudan University, Shanghai, China
Synopsis
MOLLI T1 mapping is routinely used for myocardial tissue characterization. Despite excellent precision, MOLLI has great T1 underestimation and a long breath-holding time. We previously developed a deep learning-based approach (MyoMapNet) for myocardial T1 mapping using four T1-weighted images. MOLLI T1 was used to train a fully connected neural network (FC), which resulted in a similar accuracy error as MOLLI. In this study, numerically simulated and phantom signals with the presence of different B0, flip angles, and heart rates were used to improve MyoMapNet T1 accuracy. Evaluation showed that MyoMapNet T1 could be improved and had higher precision than SASHA.
Introduction
Modified Look-Locker inversion recovery (MOLLI) T1 mapping is routinely used in clinical practice for quantitatively assessing the focal and diffuse fibrosis in diseased myocardium (1,2). MOLLI is well known for the T1 underestimation and requires a long breath-holding time of ~17s (2). Recently, a deep learning (DL)-based approach (MyoMapNet) sought to shorten MOLLI imaging time to ~4s by only using four T1-weighted images but not to improve T1 accuracy due to using MOLLI T1 as reference (3). This study sought to improve MyoMapNet's T1 accuracy by using training data with ground truth T1.Methods
Figure 1 summarizes our study. An accelerated T1 mapping sequence collects only four T1-weighted images after an inversion pulse (i.e., LL4). Numerical simulations and phantom data of LL4 were used to train MyoMapNet, which is a fully connected neural network, to predict T1. Trained MyoMapNet was evaluated by phantom and in-vivo data of LL4 and compared to SASHA and MOLLI.All MR imaging was performed on a 3T scanner (MAGNETOM Vida; Siemens Healthineers, Erlangen, Germany). MyoMapNet was implemented using PyTorch (Facebook, Menlo Park, California), trained and tested on a DGX-1 workstation (NVIDIA Santa Clara, California, United States). All simulations and T1 calculations were performed in MATLAB 2018b (MathWorks, Natick, MA, USA).Training Dataset
Phantom signals were collected from eighteen gel phantoms using LL4 and inversion-recovery spin-echo (IR-SE) sequence. IR-SE was used to obtain reference values. LL4 and IR-SE were performed at three different locations with the same field-of-view. LL4 was scanned 121 times, with changing simulated heart rate, flip angle, and center frequency.
Bloch equation simulations of LL4 were used to extend the training dataset to include the possible T1, T2, heart rate, flip angle, off-resonance frequency, noise. LL4 was simulated 5,000,000 times. Each simulation was performed with random T1, T2, heart rate, off-resonance, flip angle, and SNR.
Training
We used 90% of the datasets for training and 10% for validation. MyoMapNet was trained with 3000 epochs using an ADAM optimizer and a learning rate of 0.001. The batch size was 20 and rectified linear activation (Relu) was used. Parameters of MyoMapNet were updated using mean absolute error ($$$MAE=\frac{1}{number\;of\; pixels}\left|MyoMapNet\; T_1 - Ref\;T_1\right|$$$). MAE of the training datasets and validation datasets were used to select the model with the best performance.
Evaluation
Eleven NiCl2 doped agarose gel phantoms, separate from the one used in training, were scanned by SASHA, MOLLI5(3)3, and LL4 under different heart rates, center frequencies, and flip angles. Reference T1 and T2 values of each vial were determined IR-SE and CPMG-SE sequences, respectively. The human subject study included 19 patients (12 male; 58±16 yrs) and six healthy subjects (2 male; 23±2 yrs), which was approved by the institutional review board. Written informed consent was obtained before imaging. Native T1 mapping was imaged in all 25 subjects, and post-contrast T1 mapping was performed in only 16 subjects after injection of 0.1 mmol/kg Gd-DTPA (Gadavist, Bayer Healthcare, Berlin, Germany). Each subject was scanned by MOLLI, LL4, and SASHA. T1 for individual phantom, LV and septal myocardium, and blood was measured with manually delineated ROI. ECV was calculated with blood hematocrit. Paired Student’s t-test was used in the comparison. A P-value less than 0.05 was considered statistically significant.
Results
Phantom ExperimentPhantom T1 times measured by all three sequences were strongly correlated with reference values (Figures 2A-C) and were less sensitive to the heart rate (Figures 2D-F). As expected, T1 underestimation of MOLLI5(3)3 was increased along with increasing of off-resonance frequency and flip angle. In contrast, SASHA and MyoMapNet were insensitive to these two confounders.
In-Vivo Study
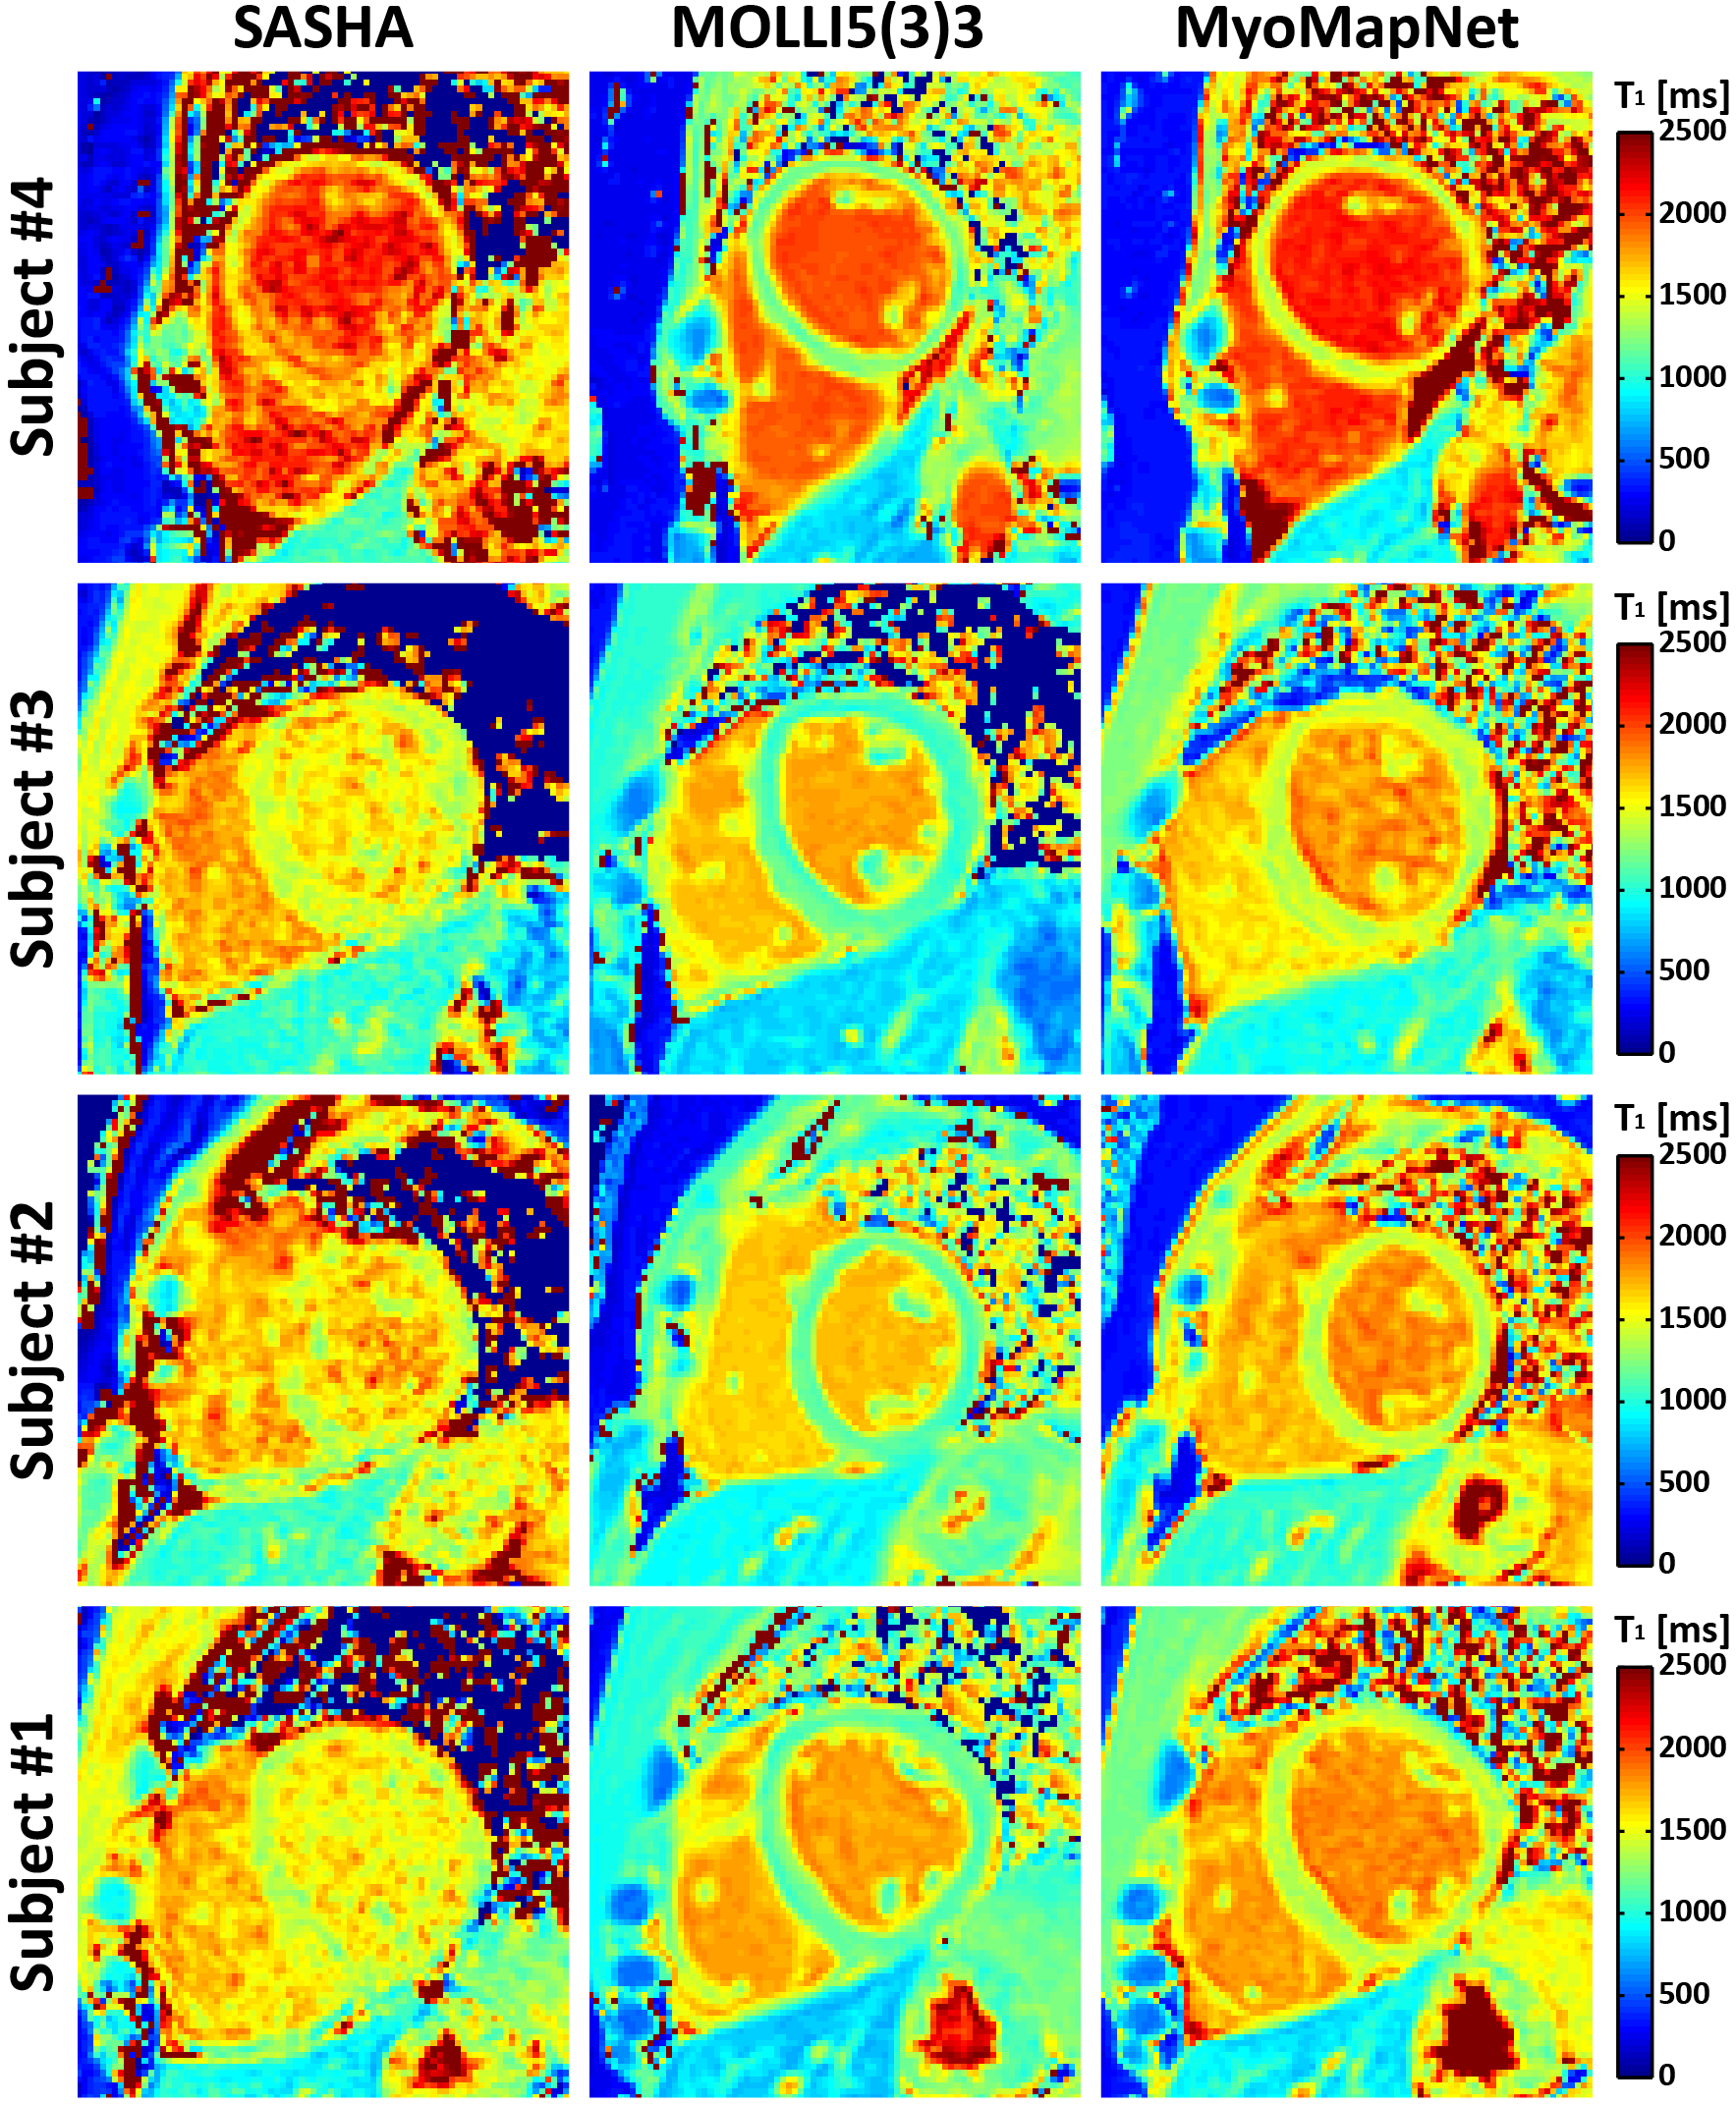
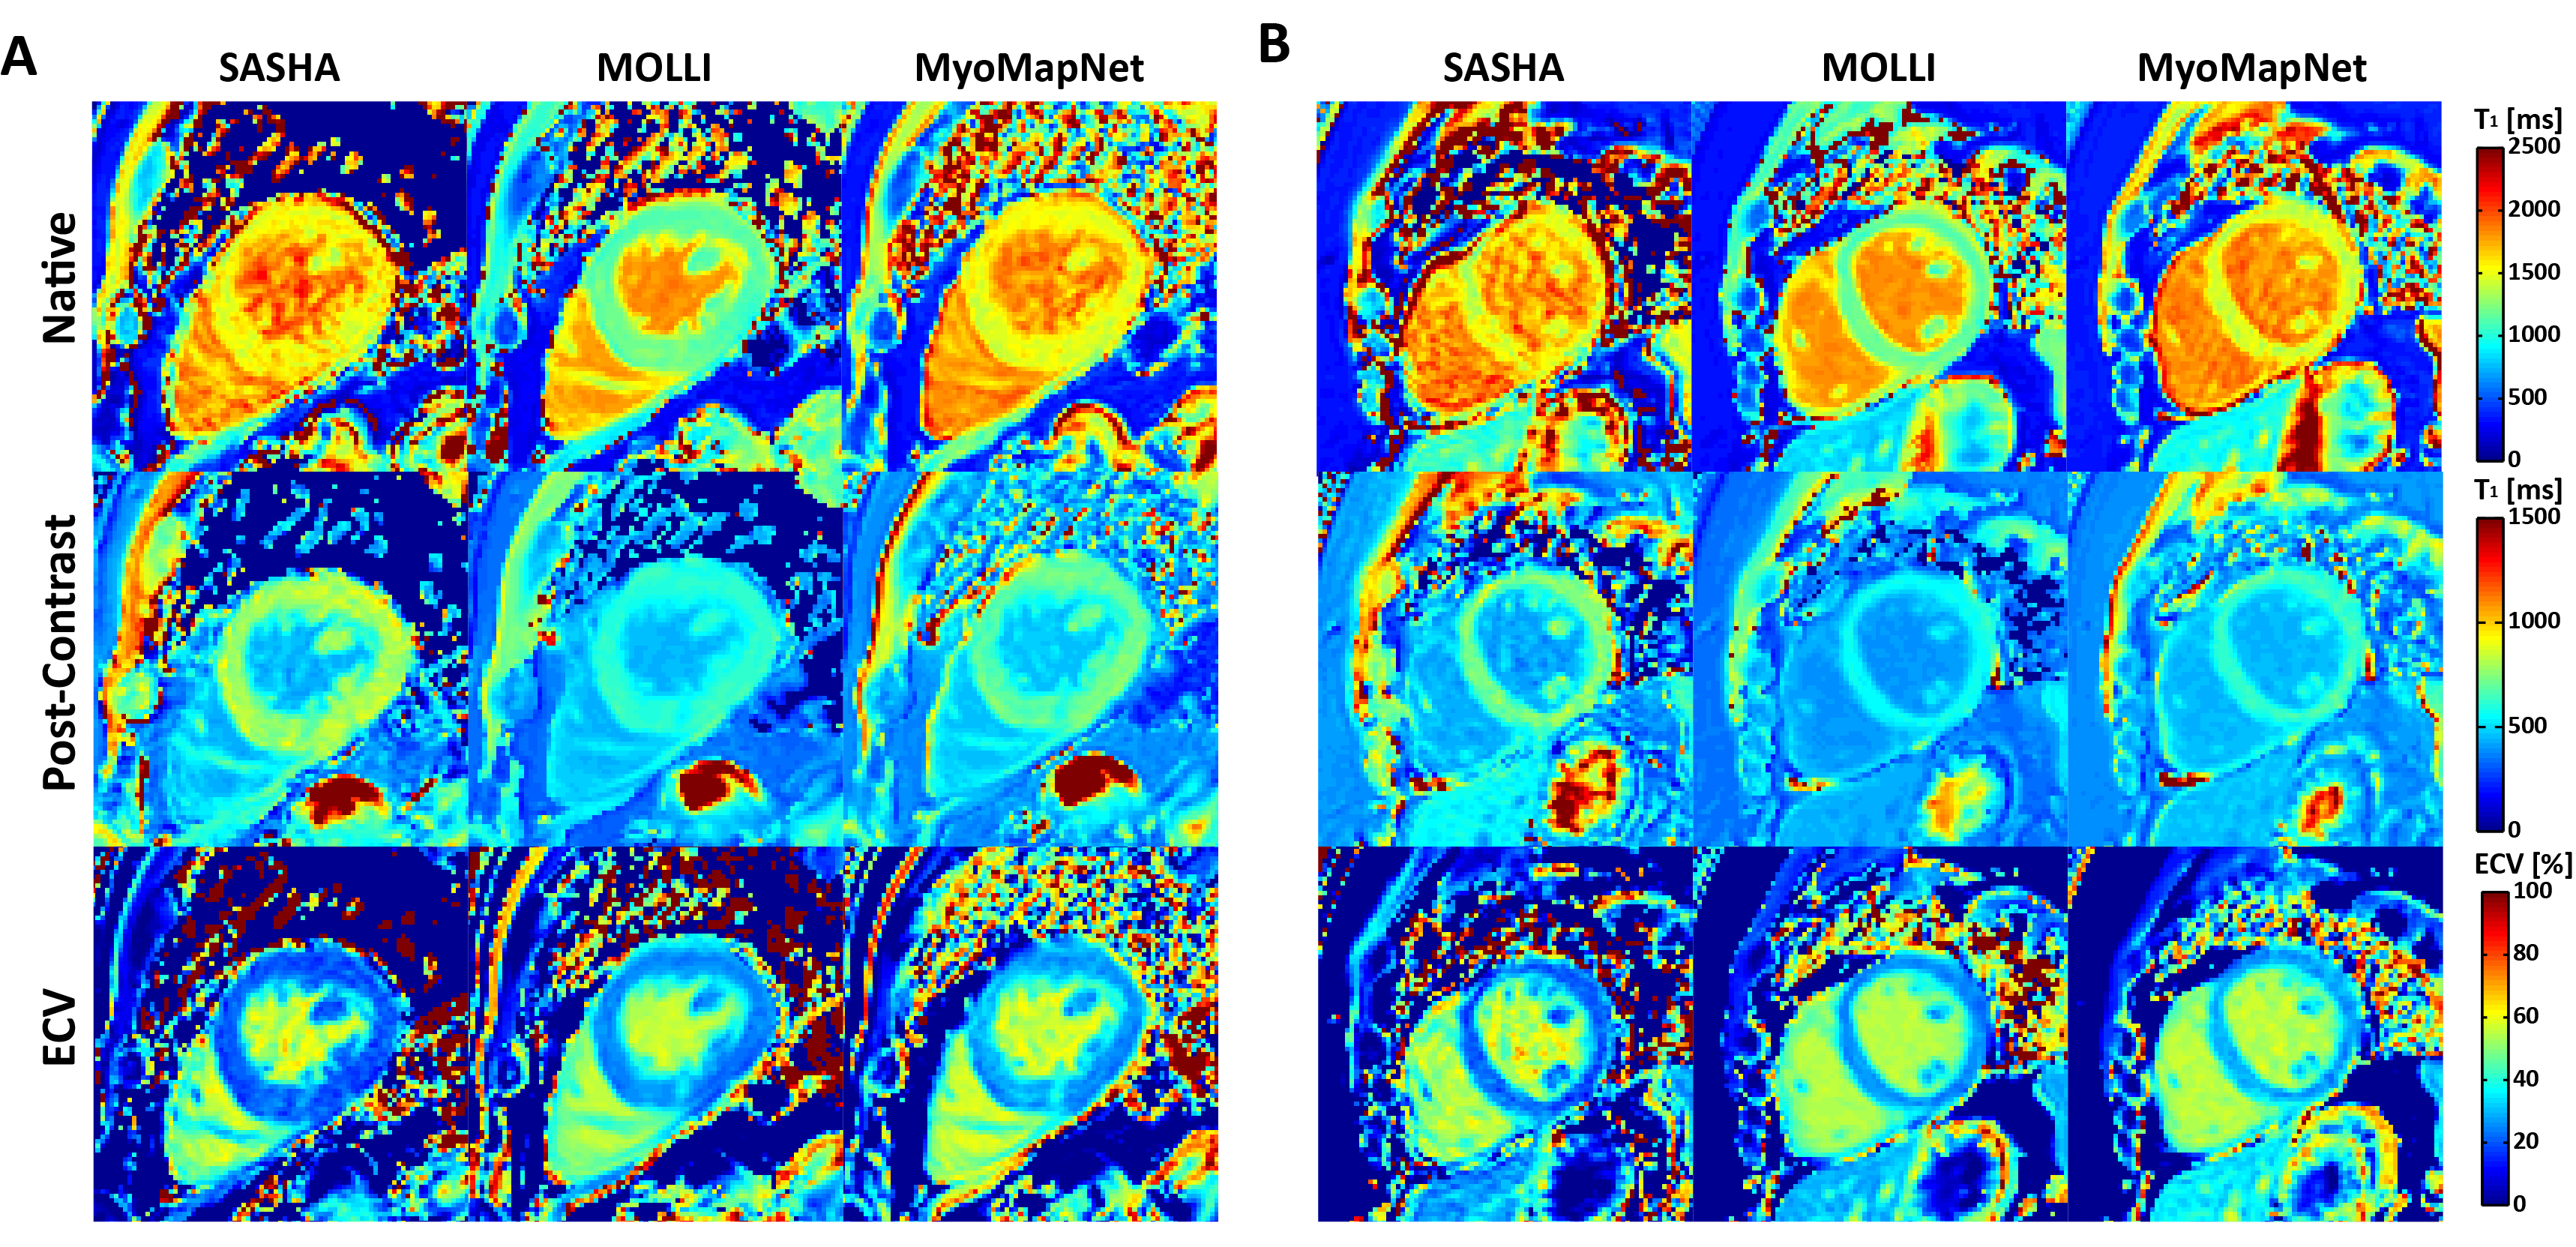
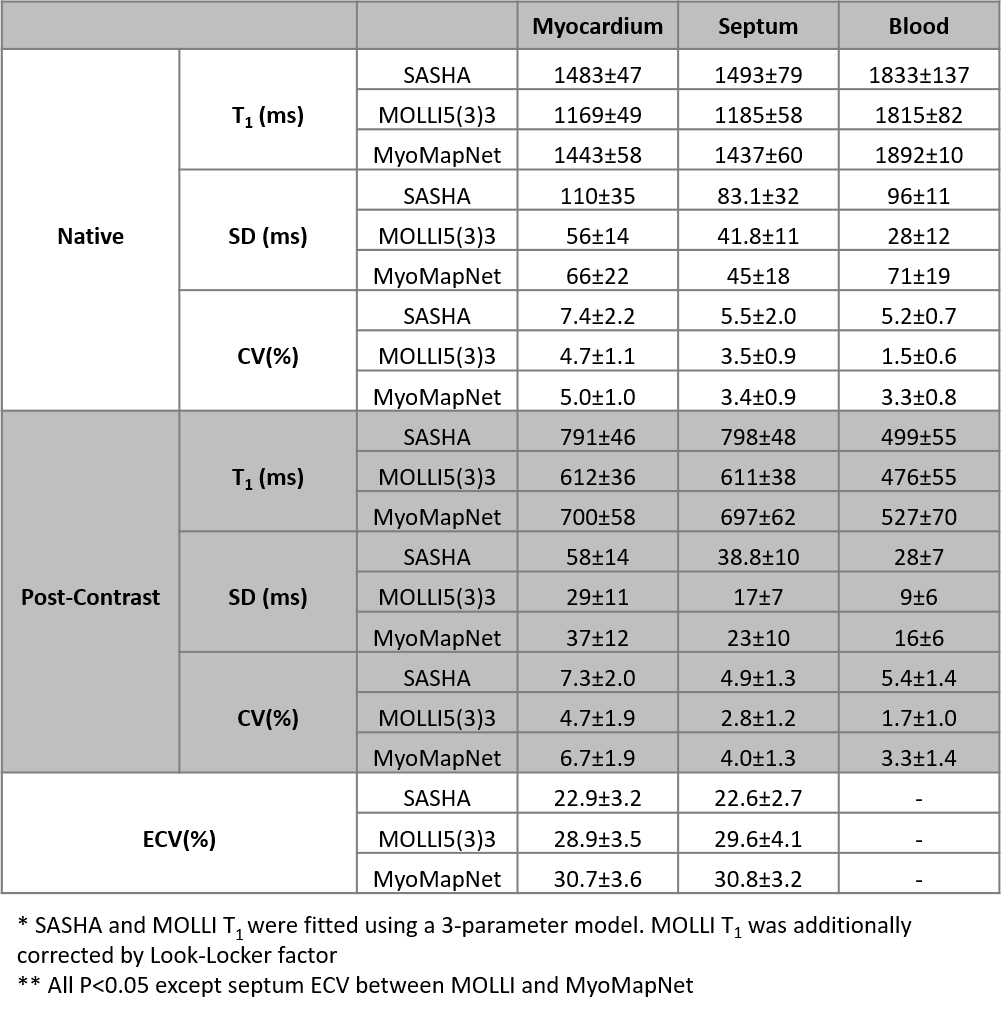
Representative maps showed similar image quality for MyoMapNet and MOLLI, with increased noise in SASHA images (Figures 3 and 4). In Figure 5, native T1 of the myocardium by MyoMapNet was ~50 ms lower than that by SASHA, but ~250 ms higher than that by MOLLI5(3)3 (all P<0.05). Native blood T1 from MyoMapNet was slightly higher than that by SASHA and MOLLI5(3)3 (~60 ms and 80 ms). Post-contrast T1 of the myocardium by MyoMapNet was ~90 ms lower than that by SASHA but ~80 ms higher than that by MOLLI4(1)3(1)2 (all P<0.05). Post-contrast blood T1 from MyoMapNet was ~30 ms and 50 ms higher than those from SASHA and MOLLI (all P<0.05), respectively. MyoMapNet had a slightly higher SD in both native and post-contrast T1 than MOLLI but smaller than SASHA. Mean ECV was ~22% by SASHA, 30% by MOLLI, and 31% by MyoMapNet (All P<0.05 except septum ECV between MOLLI and MyoMapNet), respectively.
Discussion and Conclusion
The improved MyoMapNet, trained using accurate T1 values, allowed accelerating myocardial T1 mapping completed within four heartbeats had high T1 accuracy compared to MOLLI and was less sensitive to the off-resonance, flip angle, and heart rate as SASHA. Improved T1 of MyoMapNet had slightly low T1 precision compared to MOLLI but was better than SASHA. MyoMapNet T1 is still impacted by the in-flow effect, fat, T2, magnetic transfer, and motion artifacts as there were no in-vivo signals with ground-truth T1 times for training. Further investigation is warranted to explore the alternative DL models for MyoMapNet to improve precision.Acknowledgements
No acknowledgement found.References
1. Messroghli DR, Moon JC, Ferreira VM, Grosse-Wortmann L, He T, Kellman P, Mascherbauer J, Nezafat R, Salerno M, Schelbert EB, Taylor AJ, Thompson R, Ugander M, van Heeswijk RB, Friedrich MG. Clinical recommendations for cardiovascular magnetic resonance mapping of T1, T2, T2* and extracellular volume: A consensus statement by the Society for Cardiovascular Magnetic Resonance (SCMR) endorsed by the European Association for Cardiovascular Imaging (EACVI). J Cardiovasc Magn Reson 2017;19(75).
2. Messroghli DR, Radjenovic A, Kozerke S, Higgins DM, Sivananthan MU, Ridgway JP. Modified Look-Locker inversion recovery (MOLLI) for high-resolution T1 mapping of the heart. Magn Reson Med 2004;52(1):141-146.
3. El-Rewaidy H, Guo R, Paskavitz A, Yankama T, Ngo L, Menze B, Nezafat R. MyoMapNet: Accelerated Modified Look-Locker Inversion Recovery Myocardial T1 Mapping via Neural Networks. arXiv preprint arXiv:210400143 2021.
Figures
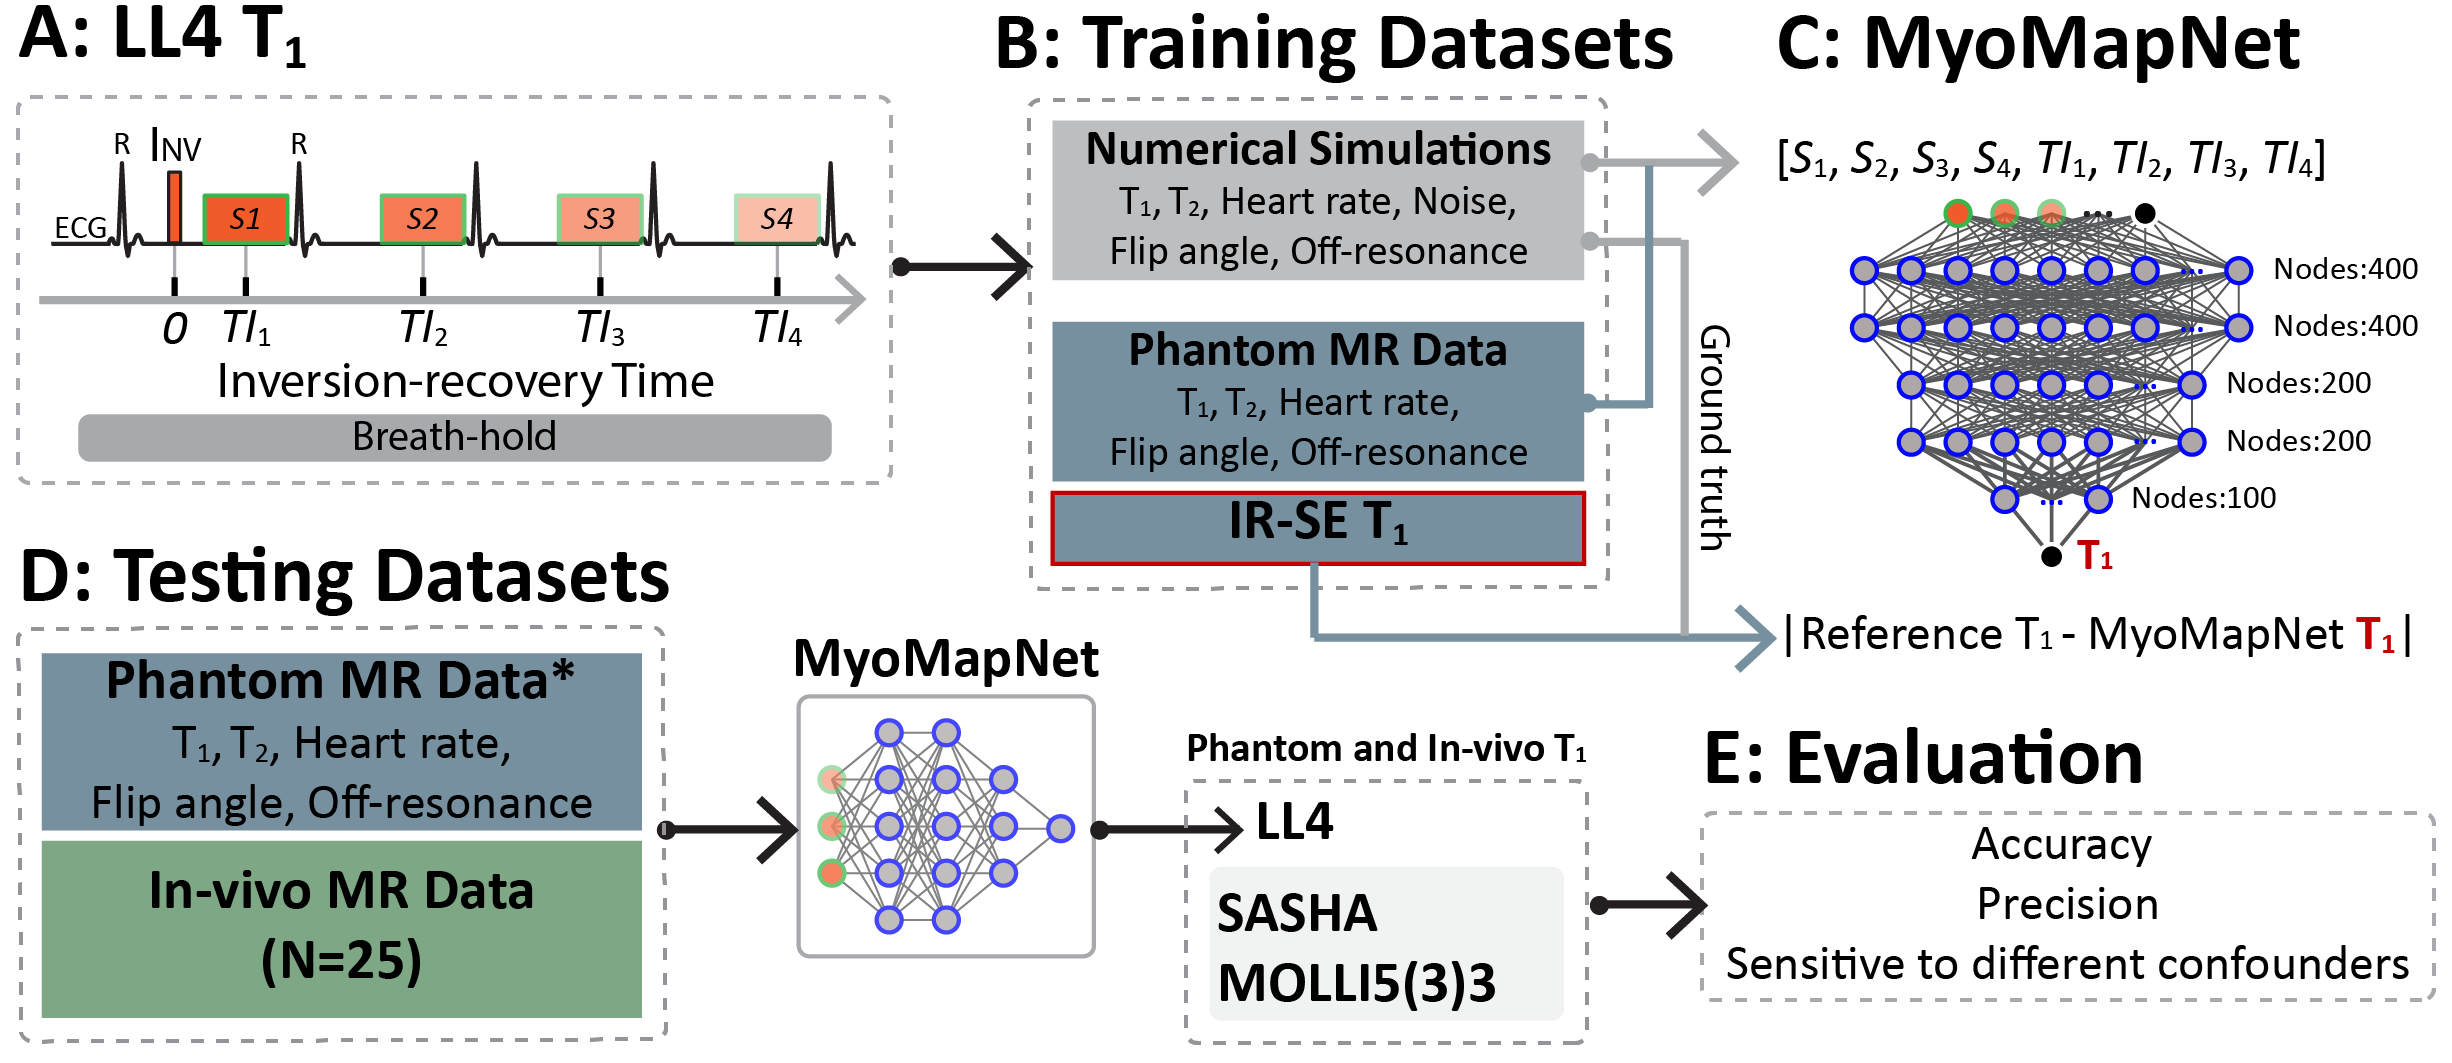
Figure 1. Study design. A: Accelerated T1 mapping sequence (LL4). LL4 acquires four images using a single inversion-recovery experiment under breath-holding. B: Training datasets. Numerical simulations and phantom data of LL4 were used. C: The architecture of MyoMapNet. A fully connected neural network is adopted to predict T1 from four T1-weighted signals (i.e., Si) and their corresponding inversion times (i.e., TIi). MyoMapNet was trained with ground truth T1 for simulation and IR-SE T1 for phantom, respectively. D: Evaluation and comparison with SASHA and MOLLI5(3)3.
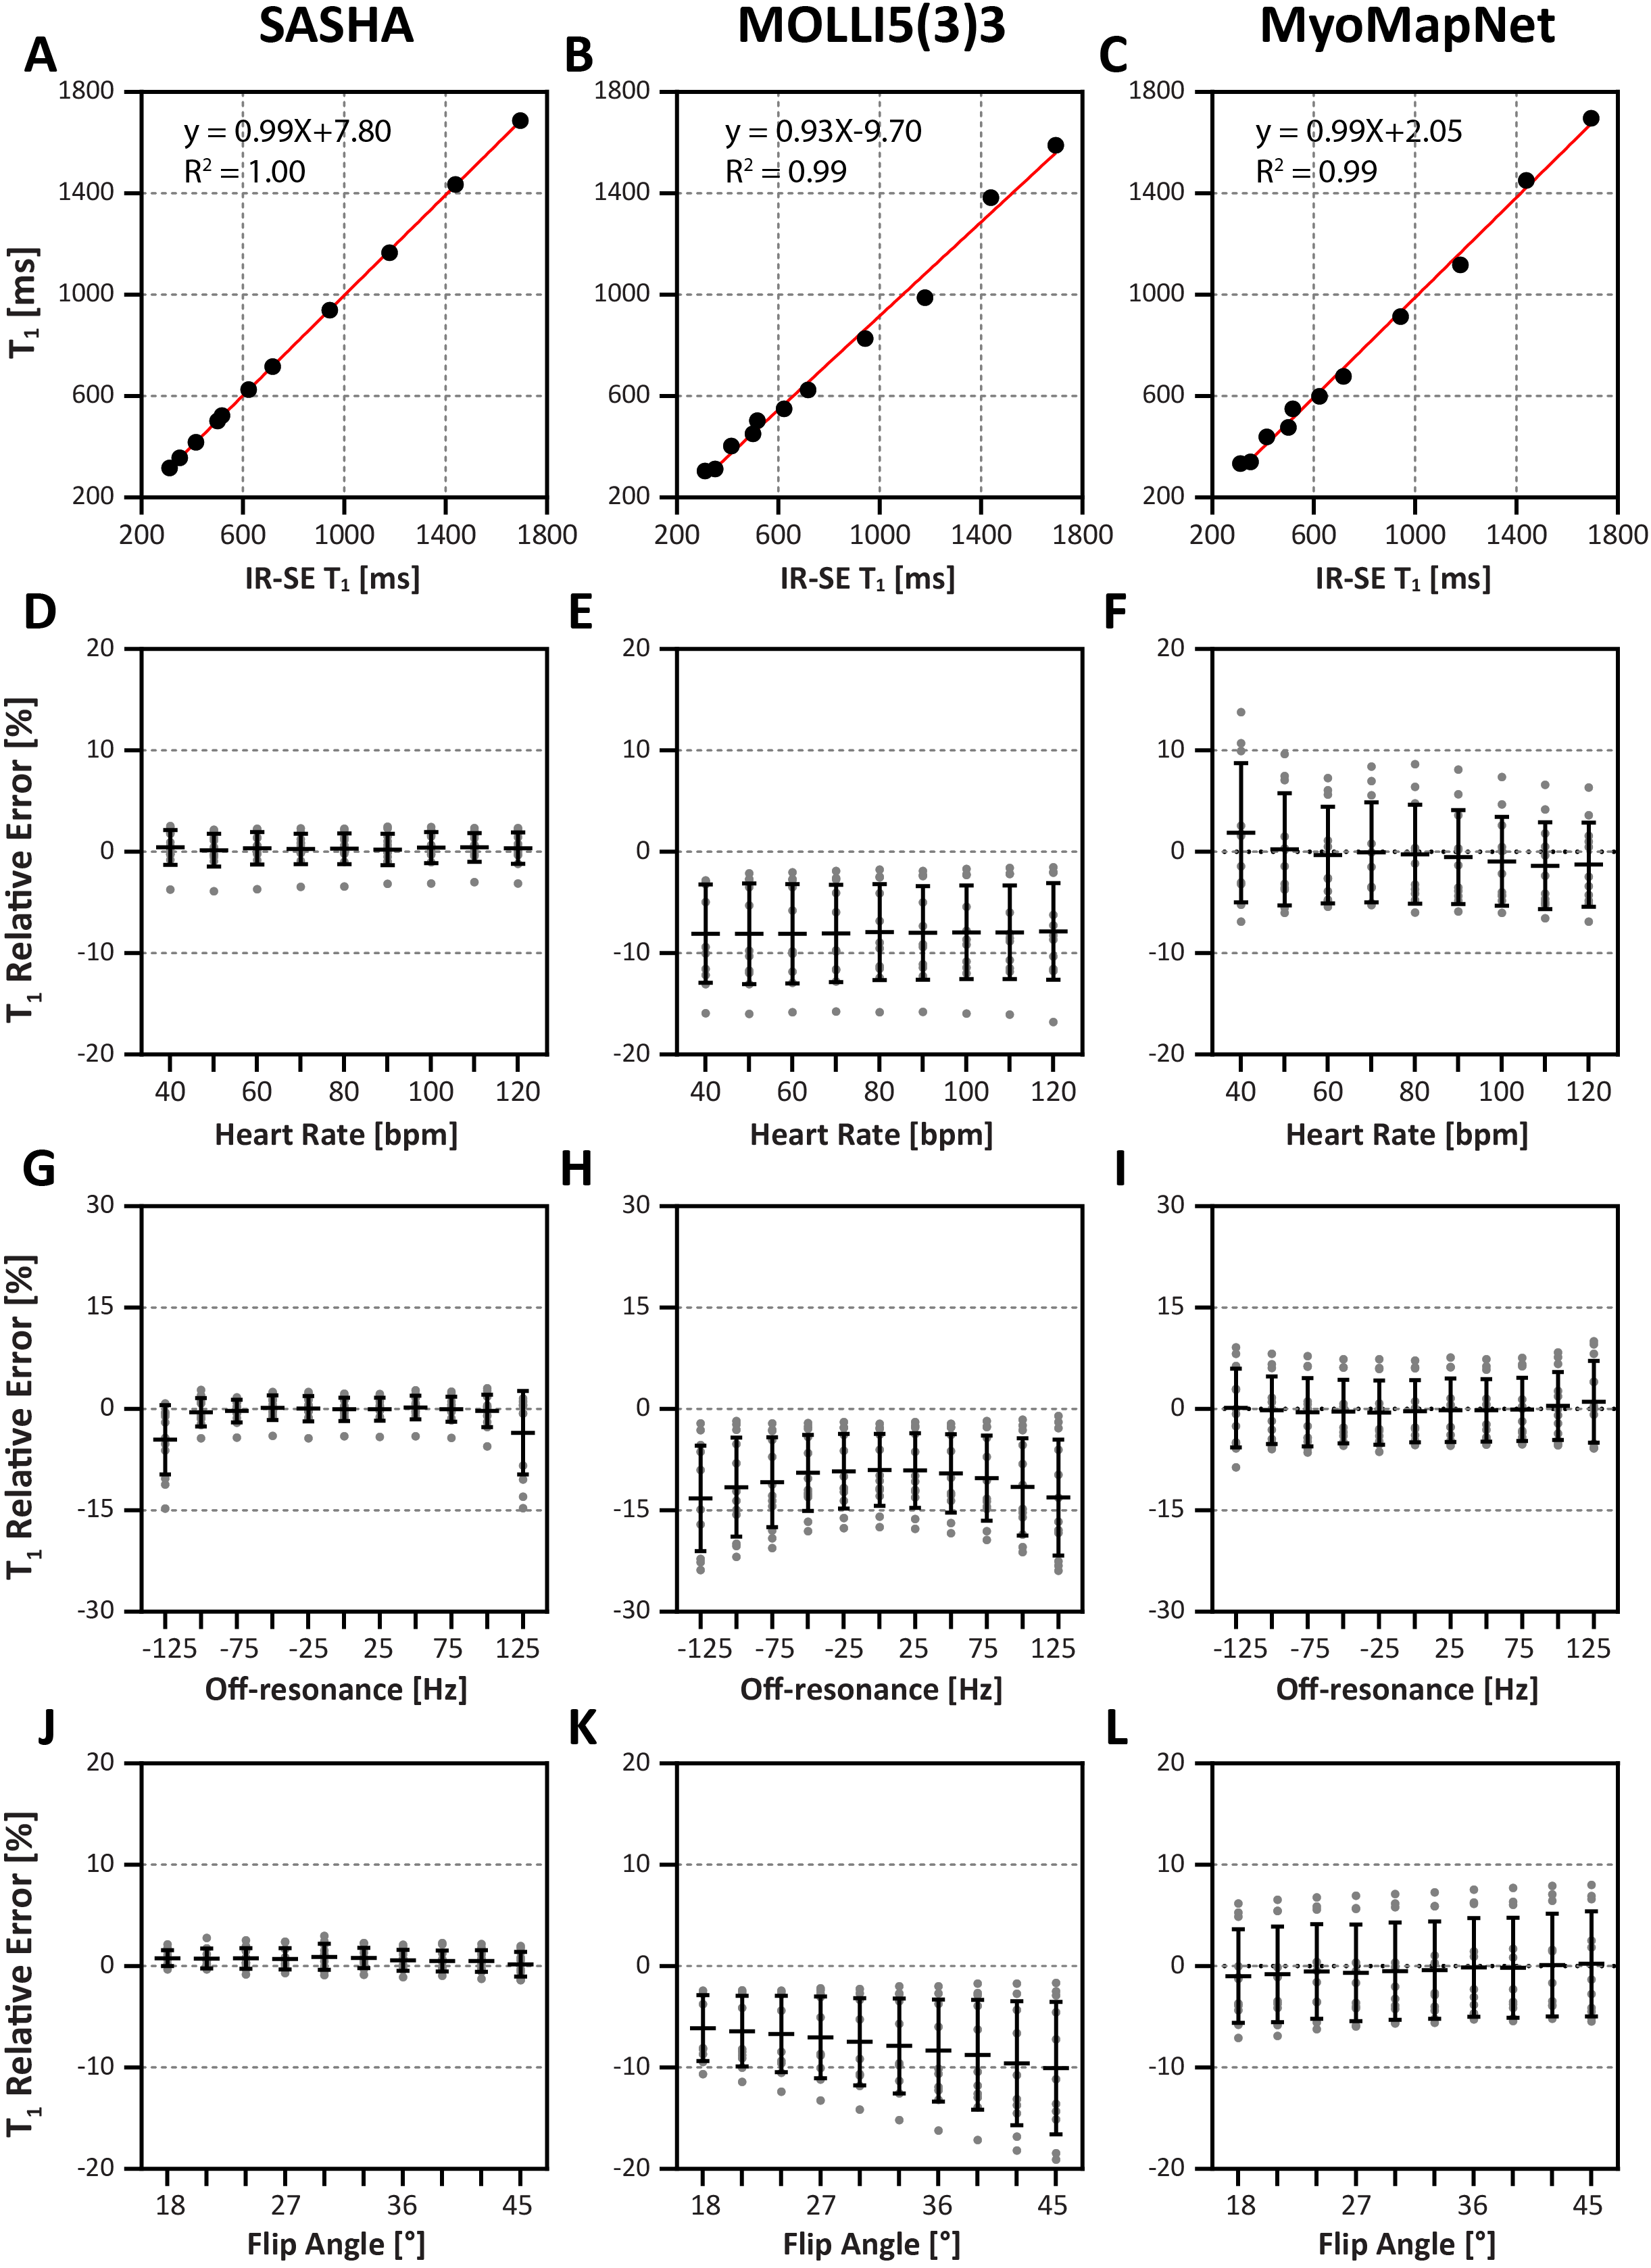
Figure 2. Phantom results. Regression analysis between reference T1 values from IR-SE and the mean of T1 across all repetitions (N=11) using SASHA, MOLLI5(3)3, and LL4 at a simulated heart rate of 60 bpm. T1 relative error of all phantom vials by three sequences performed under different simulated heart rates (D-F), shifting of the center frequency (G-I), and flip angles (J-L).