4781
Biplane Area-length Method Underestimates 3D Left Atrial Volume in Patients with Atrial Fibrillation
Anthony Maroun1, Justin Baraboo1, Suvai Gunasekaran1, Julia Hwang1, Sophia Liu1, Daniel Kim1, Philip Greenland2, Rod Passman3, Bradley Allen1, Michael Markl1, and Maurice Pradella1,4
1Department of Radiology, Northwestern University Feinberg School of Medicine, Chicago, IL, United States, 2Department of Preventive Medicine, Northwestern University Feinberg School of Medicine, Chicago, IL, United States, 3Department of Cardiology, Northwestern University Feinberg School of Medicine, Chicago, IL, United States, 4Department of Radiology, University Hospital Basel and University of Basel, Basel, Basel, Switzerland
1Department of Radiology, Northwestern University Feinberg School of Medicine, Chicago, IL, United States, 2Department of Preventive Medicine, Northwestern University Feinberg School of Medicine, Chicago, IL, United States, 3Department of Cardiology, Northwestern University Feinberg School of Medicine, Chicago, IL, United States, 4Department of Radiology, University Hospital Basel and University of Basel, Basel, Basel, Switzerland
Synopsis
The biplane area-length method is routinely used in clinical settings for left atrial volume (LAV) estimation. This technique is time-resolved but relies on geometrical assumptions of an ellipsoidal shape to estimate the LAV. In contrast, quantification derived from 3D segmentations on late gadolinium-enhanced magnetic resonance imaging and contrast-enhanced magnetic resonance angiography are static but do not rely on geometric assumptions. We compared the LAV estimation from these 3 methods in patients with atrial fibrillation and found a significant underestimation by the biplane area-length technique, indicating that this method may not capture the entire LAV in patients with complex anatomy.
Introduction
Left atrial (LA) volume (LAV) is an important marker of cardiovascular morbidity and mortality in the general population, and a predictor of adverse outcomes in atrial fibrillation (AF)1,2. There are several approaches with cardiac magnetic resonance imaging (MRI) for measuring LAV. The most common approach is the biplane area-length (BAL) technique which estimates LAV from 2D cine MRI in 2- and 4-chamber orientation based on geometric assumptions (ellipsoid shape of the LA)3. BAL can provide time-resolved LAV for the estimation of minimum and maximum atrial volumes. However, the well-known variability of LA size and shape in patients with AF may limit the application of BAL4. Alternative approaches are based on true 3D imaging such as late gadolinium-enhanced 3D MRI (3D-LGE-MRI) and contrast-enhanced 3D magnetic resonance angiography (3D-CE-MRA). The advantage of 3D imaging is that it does not assume a geometric shape; the disadvantage of this technique is that it provides a static quantification. The purpose of this study was to compare the LAV estimation from the BAL method with the LAV acquired from 3D segmentation of CE-MRA and LGE-MRI in a large cohort of patients with AF.Methods
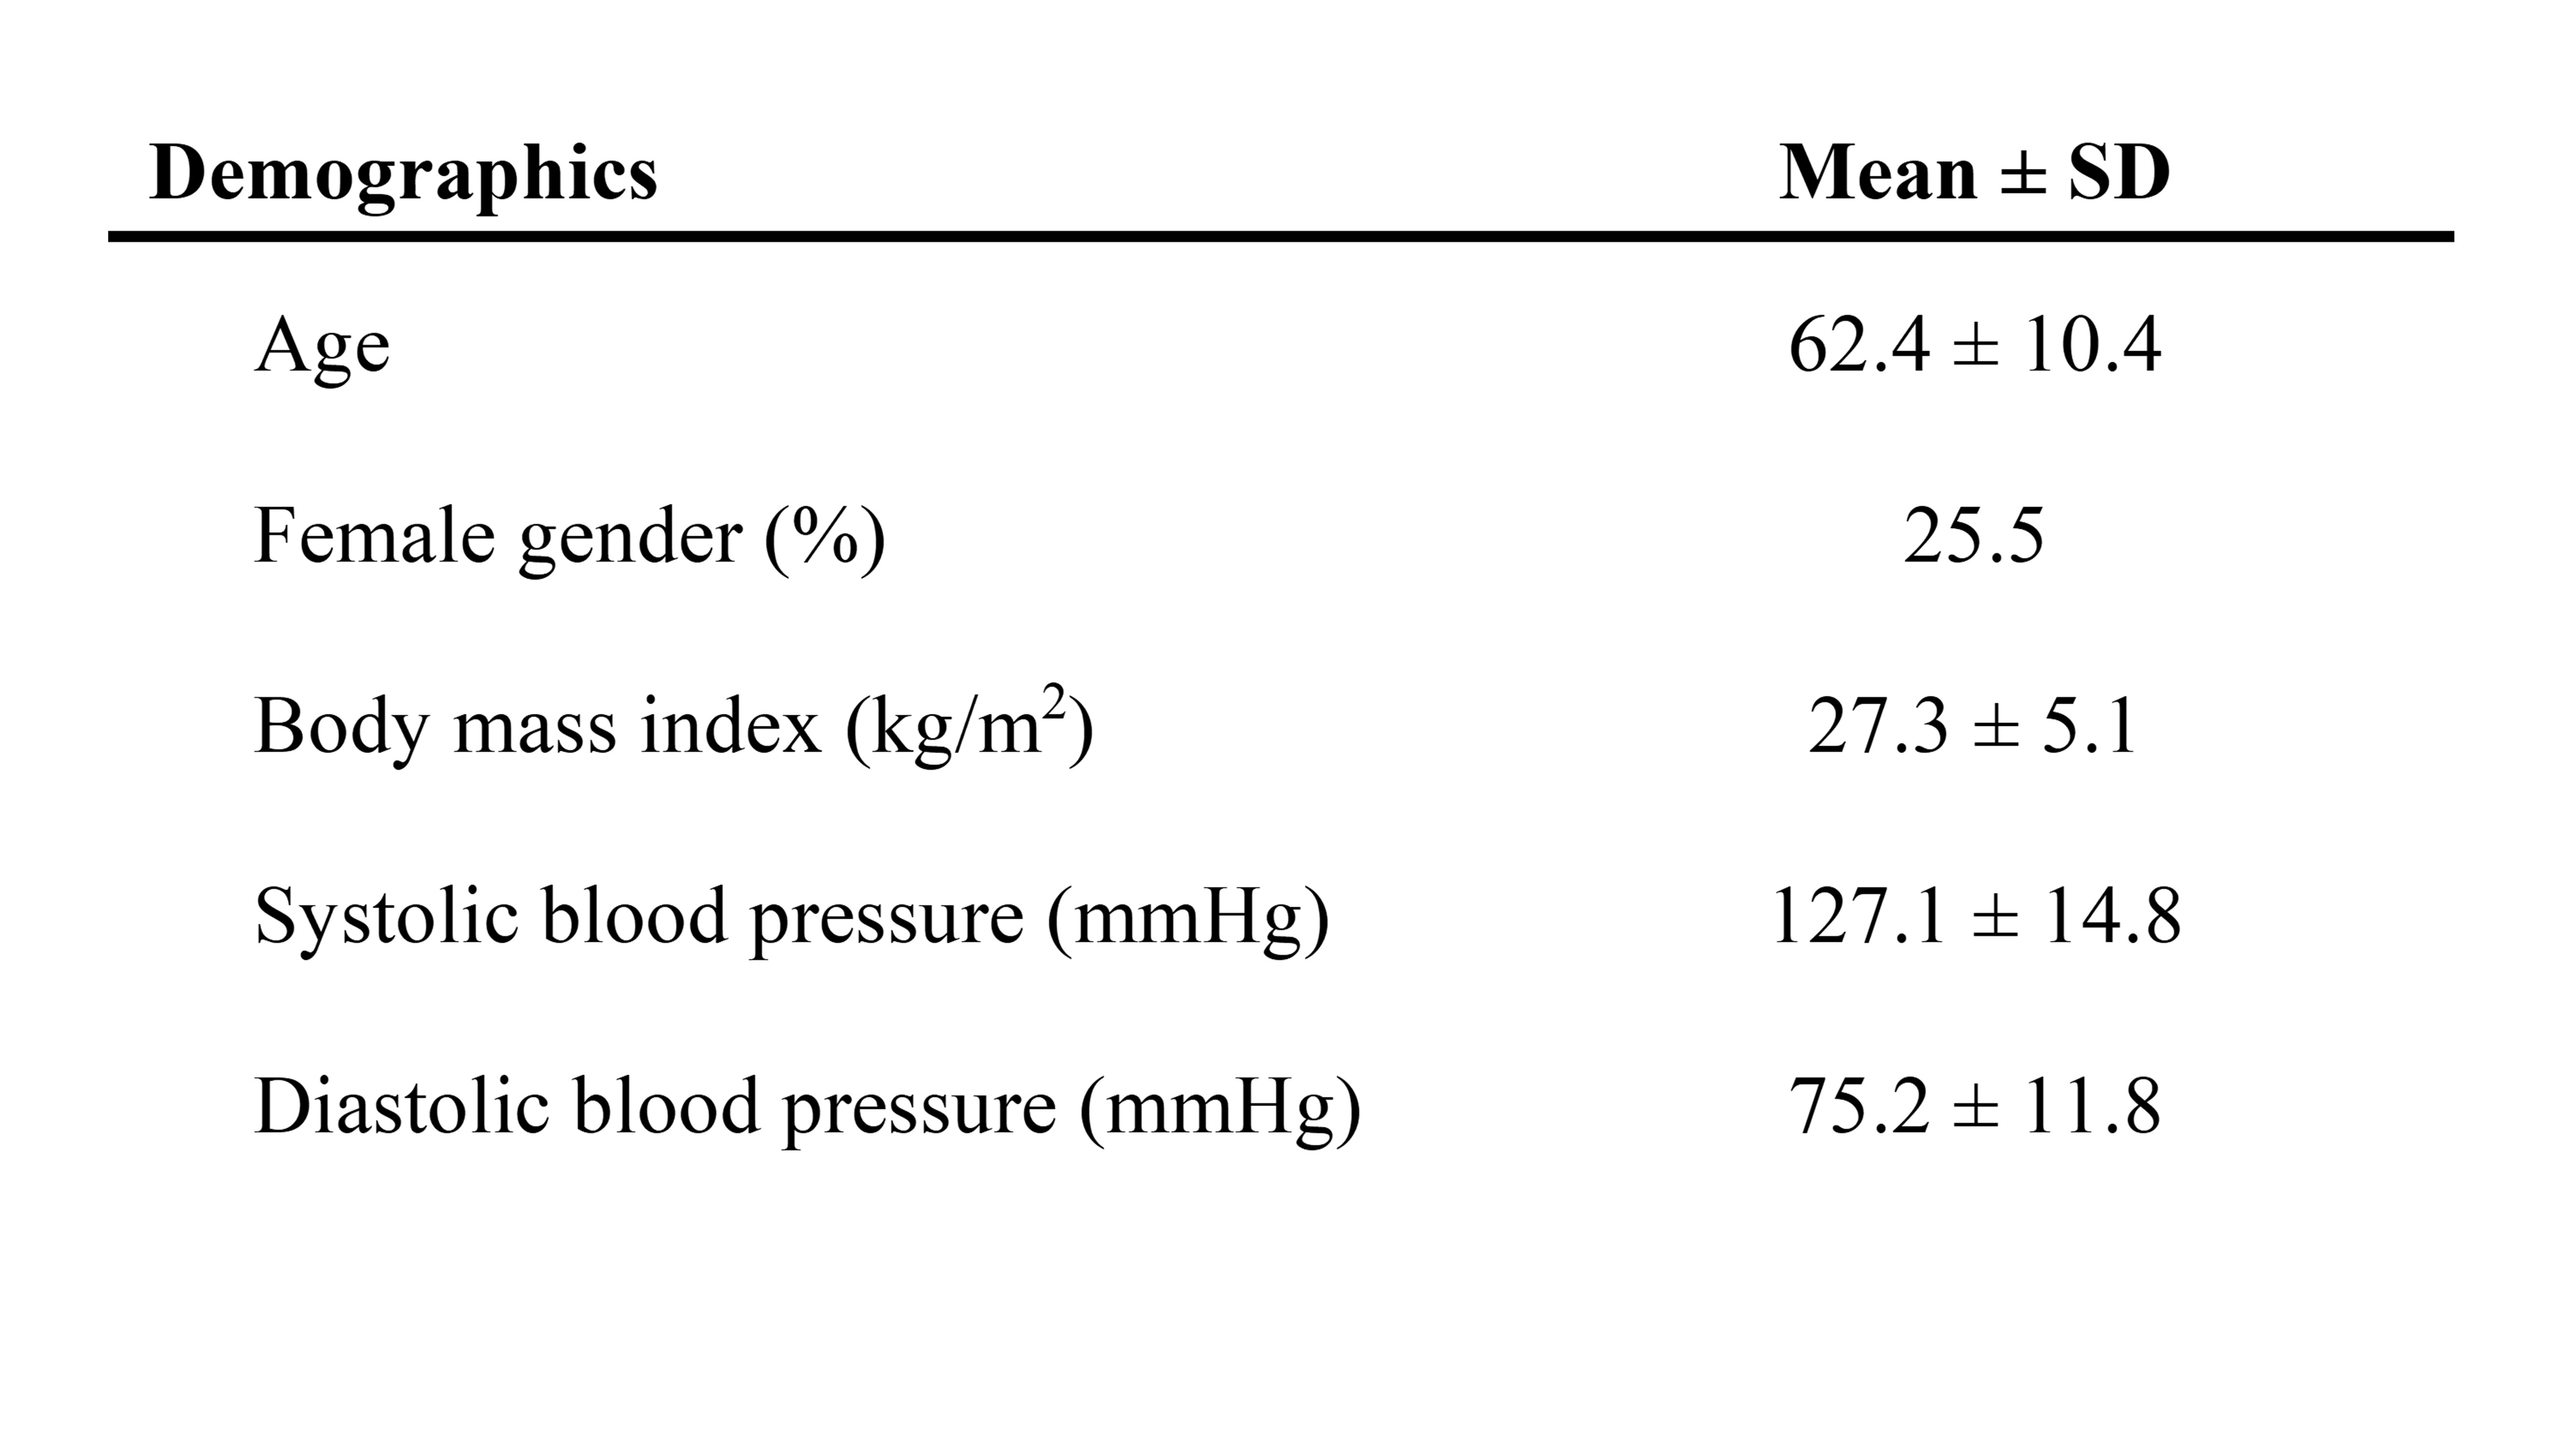
Fifty-five consecutive AF patients (62.4±10.4 years; 41 male) who underwent a standard-of-care clinical cardiac MRI were retrospectively included in this study. The cardiac MRI scans were performed on 1.5T systems (Siemens Healthineers, Germany) and included 3D-CE-MRA and ECG-gated 3D-LGE-MRI (mid-diastole) acquisitions, as well as standard 2 and 4-chamber, retrospectively ECG-gated, steady-state free precision cine imaging. 3D-CE-MRA was performed using the twist technique after the administration of gadobutrol at a dose of 0.2 mmol/kg (Gadavist, Bayer Healthcare Pharmaceuticals, USA). 3D-LGE-MRI sequences were conducted in mid/end-diastole, 20 minutes after contrast agent administration5.Biplane Area-length Method
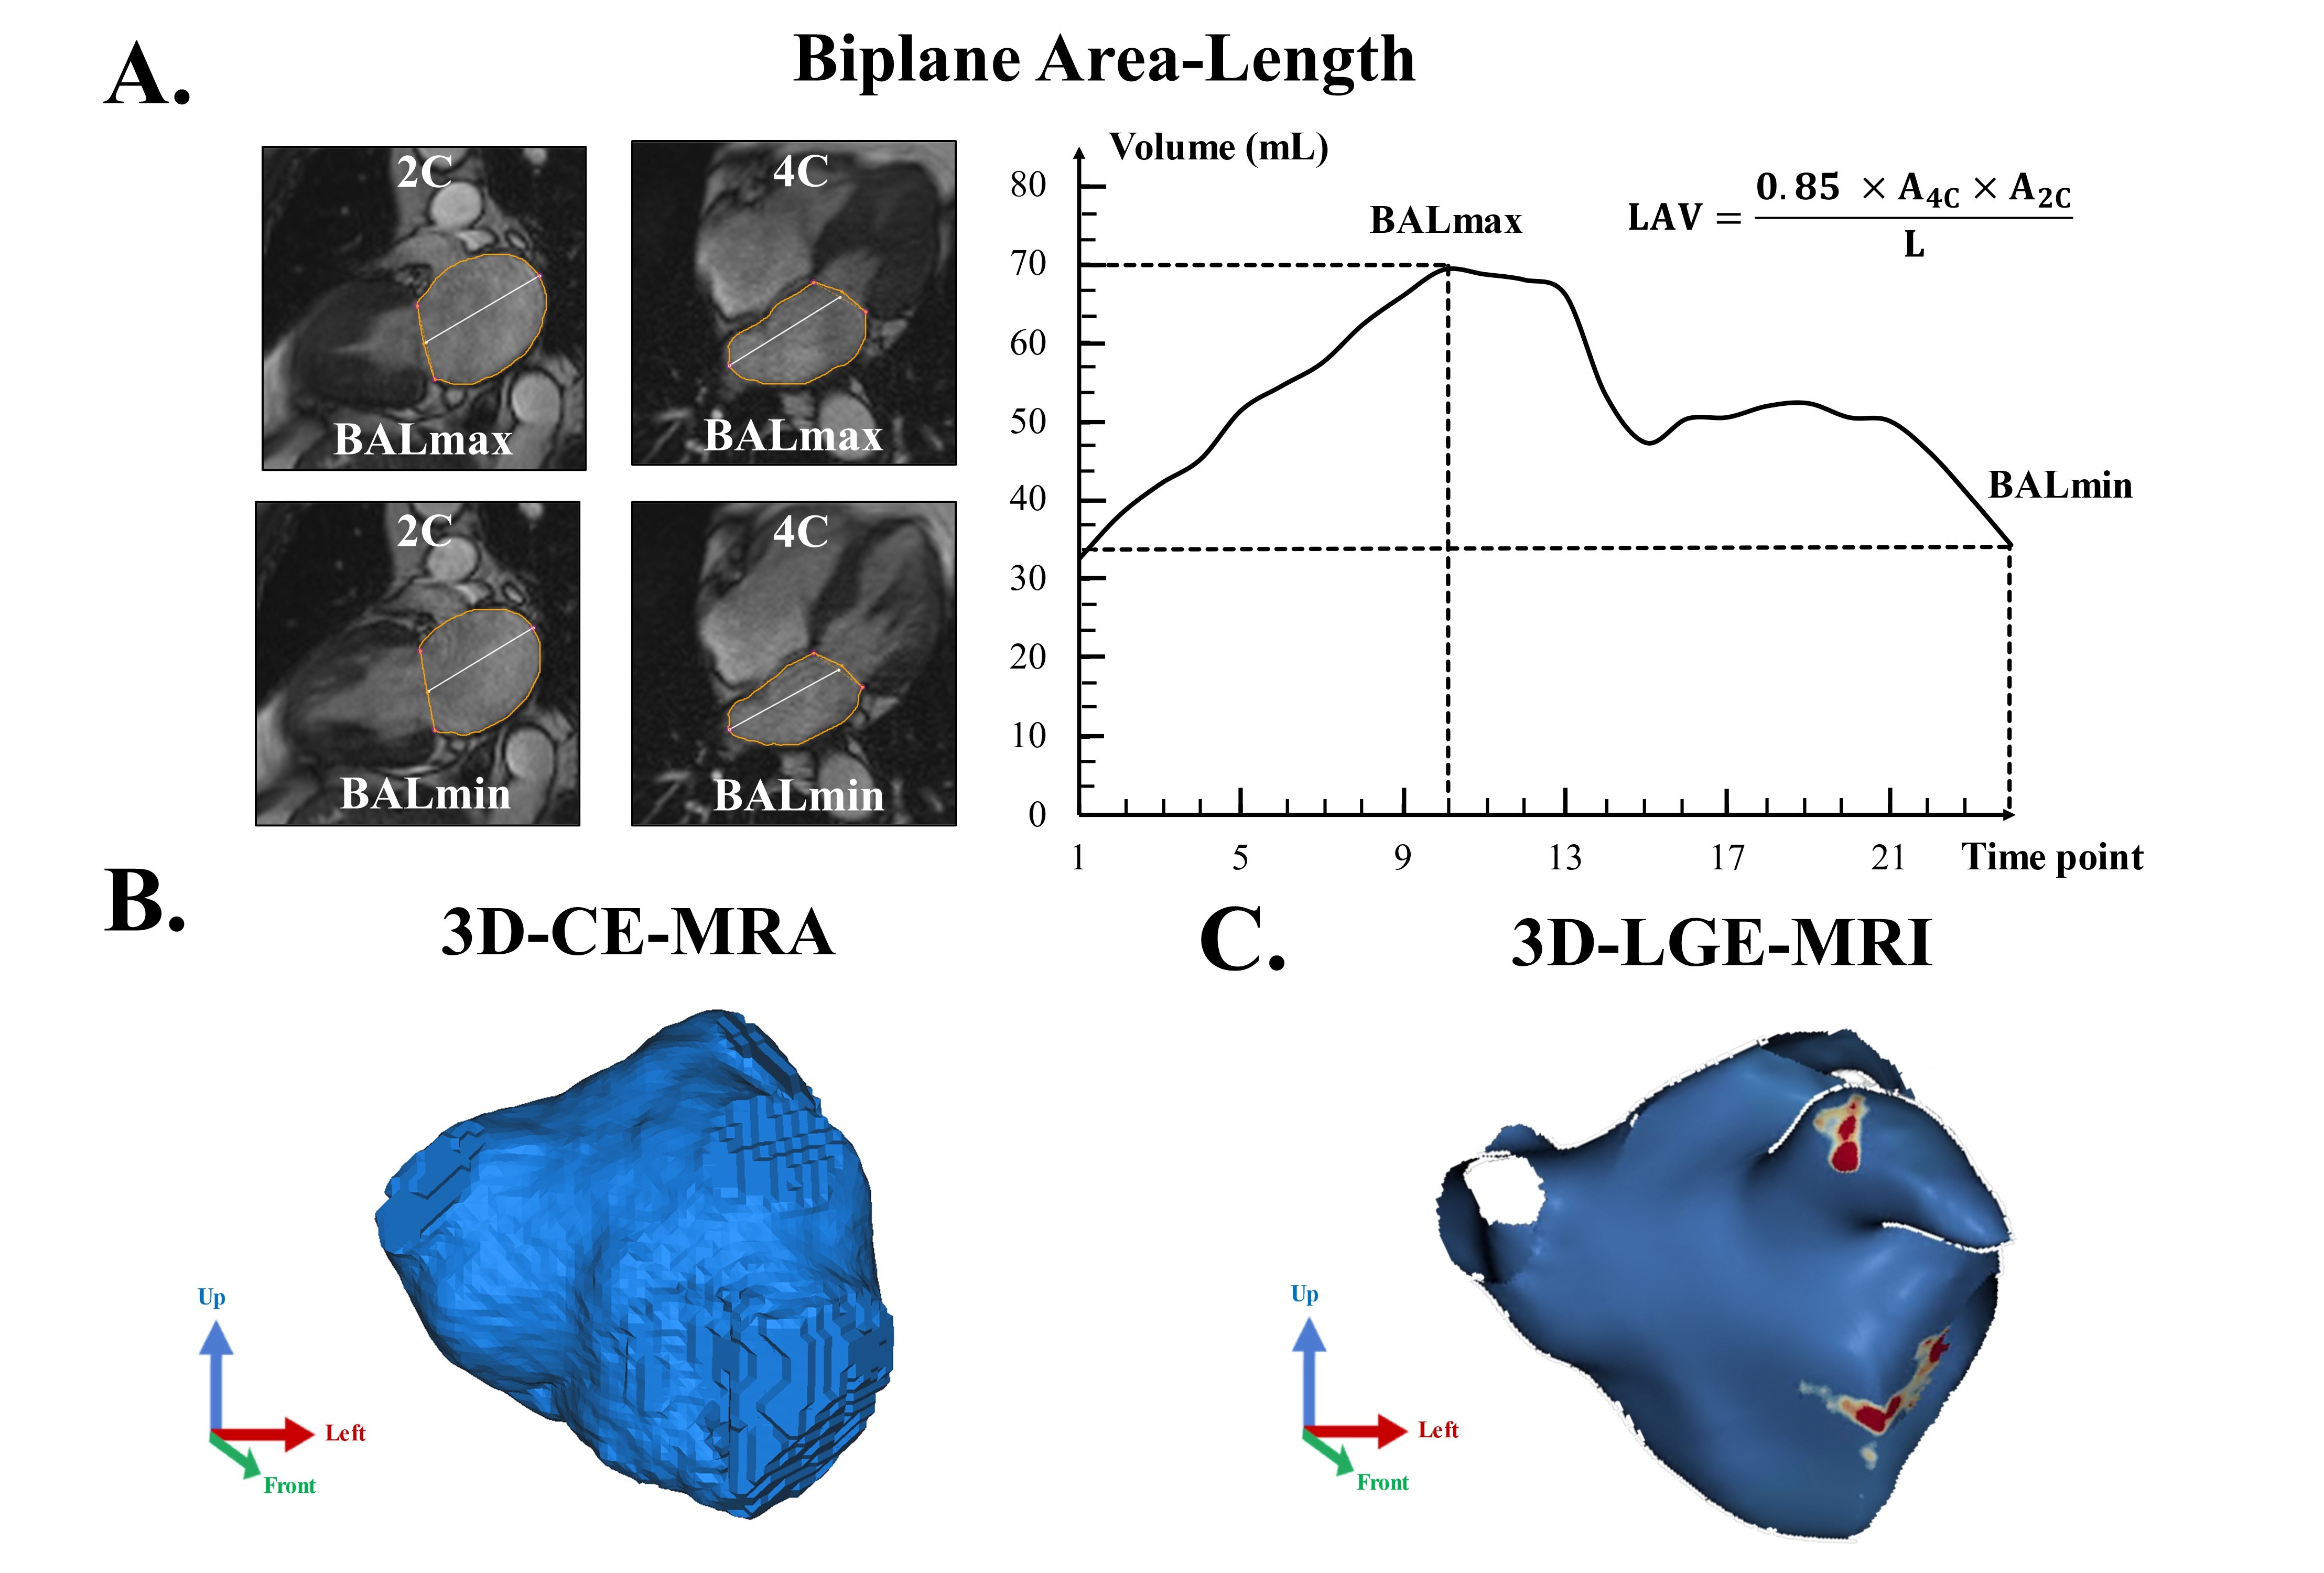
LA contours on 2- and 4-chamber series were semi-automatically defined by a radiologist with 3 years of experience, using a commercial software (Circle, Canada) (Figure 1A). Left atrial appendage (LAA) and pulmonary veins were excluded, and the border between the LA and the left ventricle was delineated by the mitral annular plane. Two volume estimations were extracted from the volume-time curves at two different time-points of the cardiac cycle: LA minimal volume at end-diastole (BALmin), and LA maximal volume at end-systole before mitral valve opening (BALmax). BALmax was used as the clinical reference standard.
3D Late Gadolinium-Enhanced MRI and 3D Contrast-Enhanced Magnetic Resonance Angiography
3D LA segmentations on 3D-CE-MRA (Figure 1B) and 3D-LGE-MRI (Figure 1C) were performed by an observer with one year of experience, using two commercial software (Mimics, Materialise, Belgium, and ADAS3D, Galgo Medical, Spain, respectively). The LAA was routinely included in the 3D-LGE-MRI segmentations but excluded in the 3D-CE-MRA segmentations.
Statistical Analysis
Normality was assessed using the Kolmogorov-Smirnov test, and differences between LAV measurements were compared with the paired two-tailed student’s t-test. The Pearson correlation was performed, and Bland-Altman plots were carried out to evaluate the bias and limits of agreement (LOA). A p value <0.05 was considered statistically significant.
Results
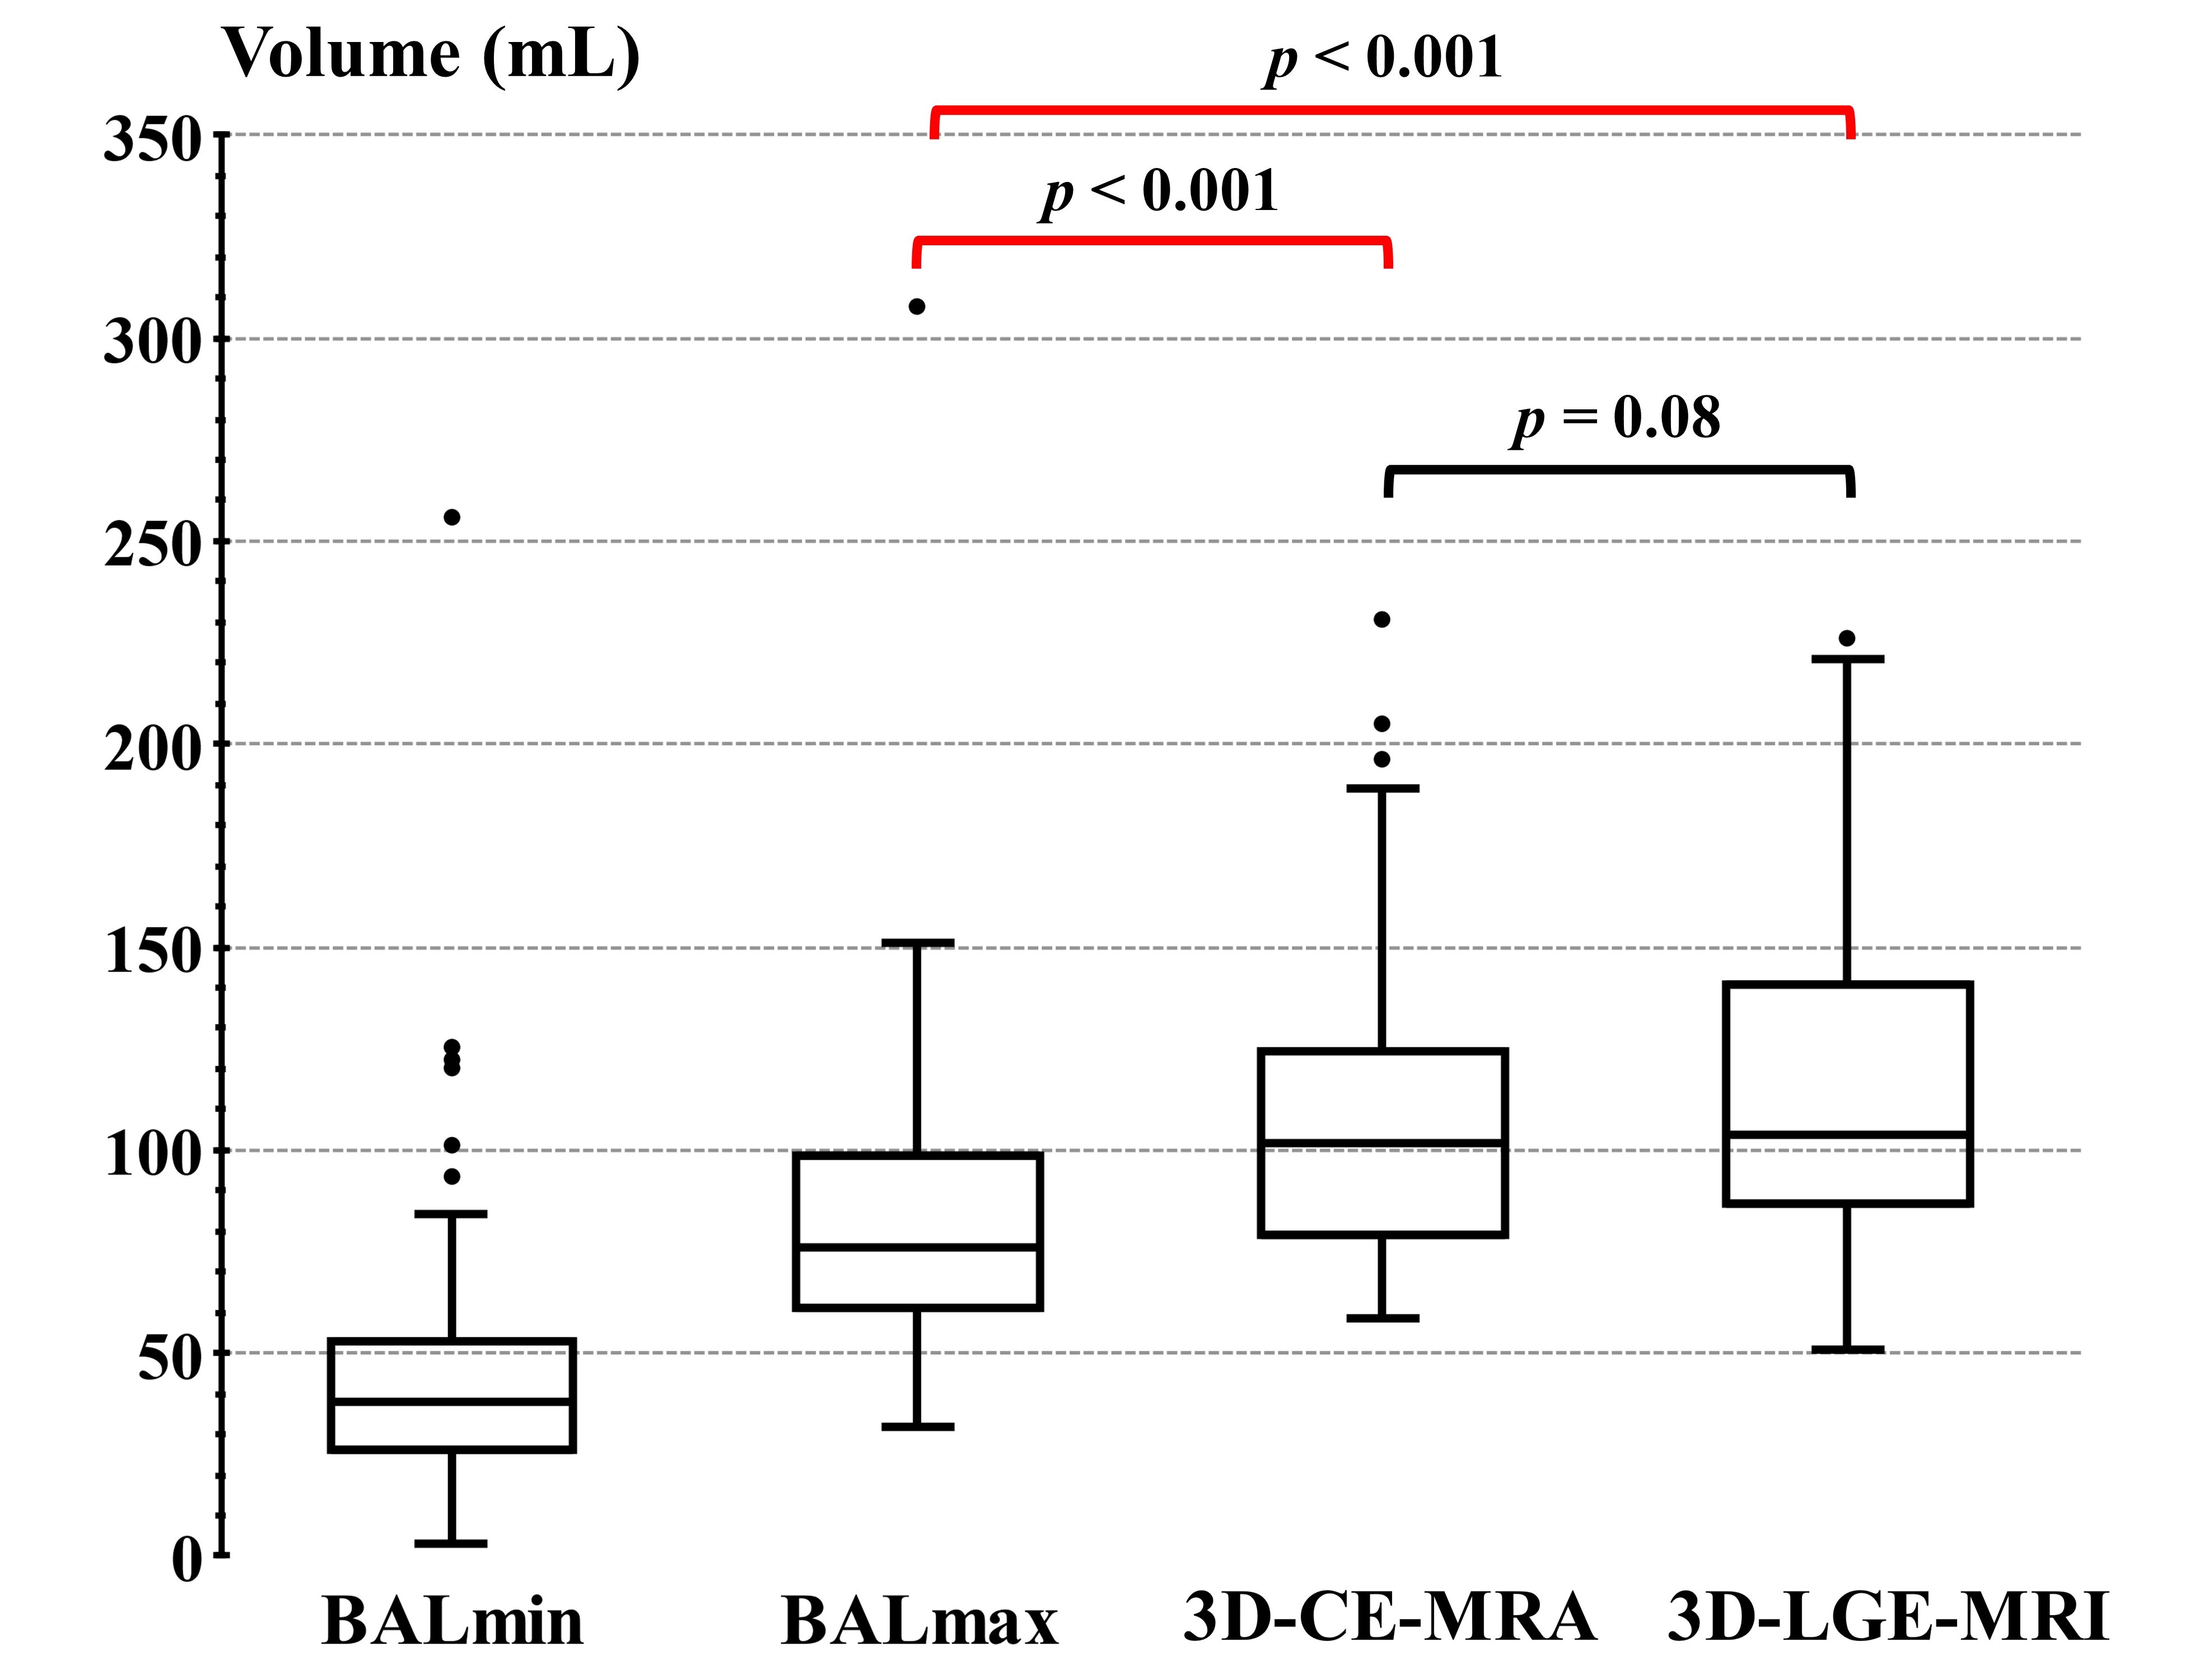
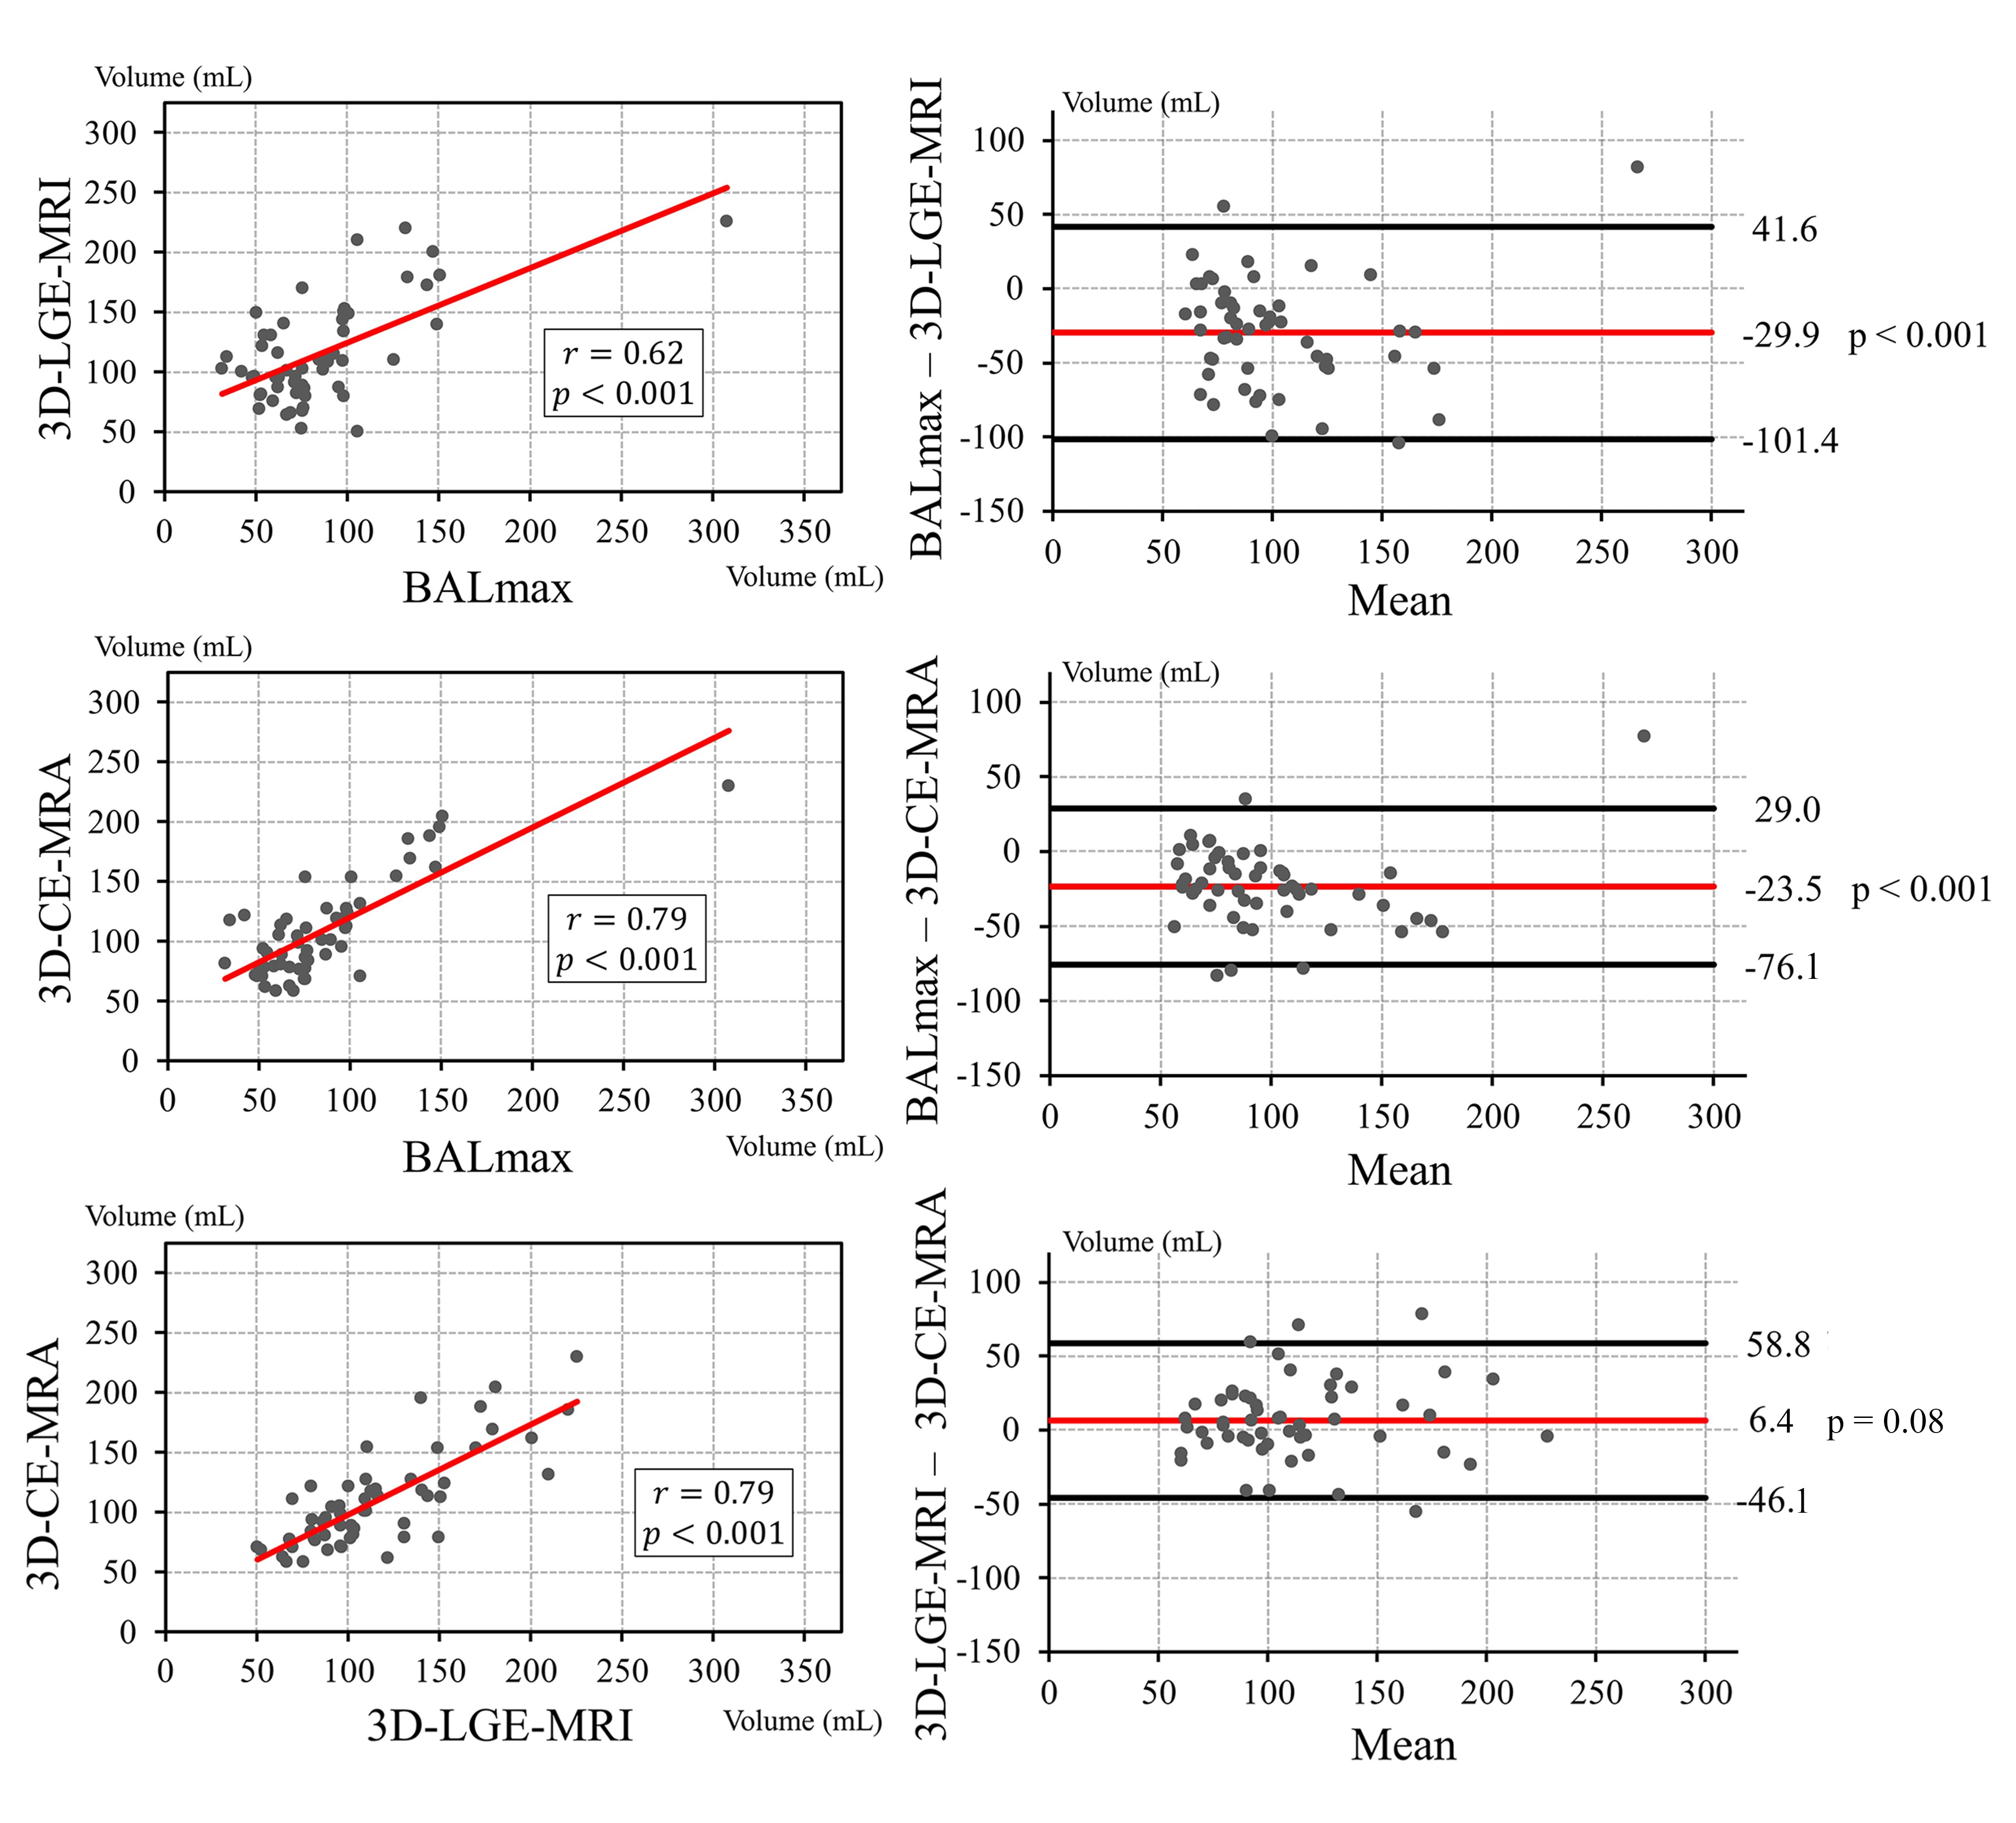
Baseline characteristics of the patients are shown in Table 1. We observed a significant difference between BALmax (mean: 85.6±42.1ml) and both 3D-LGE-MRI (vs. mean: 115.6±42.1ml, bias: -29.9ml, LOA: 71.5ml, p<0.001) and 3D-CE-MRA (vs. mean: 109.2±40.2ml, bias: -23.5ml, LOA: 52.5ml, p<0.001). However, pairwise comparison did not yield any significant difference between volume quantification from 3D-LGE-MRI and 3D-CE-MRA (bias: 6.4ml, LOA: 52.4ml, p=0.08) (figure 2). The relationship between the three studied methods is summarized in figure 3. Despite the difference in volumes, good correlation was observed when comparing BALmax vs. 3D-CE-MRA (r=0.79, p<0.001) and 3D-LGE-MRI vs. 3D-CE-MRA (r=0.79, p<0.001), but moderate-good correlation for BALmax vs. 3D-LGE-MRI (r=0.62, p<0.001).Discussion
The main finding of our study is that the routinely used BALmax estimation, although acquired at maximal volume, significantly underestimated LAV compared to 3D methods. This suggests that the BAL technique which relies on geometric assumptions for a normally shaped LA may not capture the entire LAV in patients with AF.Previous studies compared the BAL to a 3D-based, time-resolved model from Cine segmentation in patients with no known history of AF and found an underestimation of maximal LAV by the BAL method6,7. Our results agree with these prior reports, but we observed a higher absolute bias between BAL and 3D methods which may indicate that in AF, atriums have a more distorted anatomy from an ellipsoidal shape compared to other atrial pathologies. Furthermore, 3D-CE-MRA and 3D-LGE-MRI volumes did not show a significant difference in paired analysis. This could also attest to the superiority of 3D techniques over 2D time-resolved estimations in assessing maximal LA volume.
Limitations
This study did not include non-AF patients or healthy controls as a reference and lacked an assessment of interobserver variability.
Conclusion
The routinely used BAL method underestimates LA volume in atrial fibrillation compared to measurements derived from 3D segmentations on 3D-LGE-MRI and 3D-CE-MRA. Thereby, our results suggest that the geometric assumption of an ellipsoidal LA shape, which is the underlying principle of the BAL method, does not reflect the complex geometry of the LA in patients with AF. Future work should focus on including patients with different cardiac pathologies as well as healthy controls, and assessing interobserver variability.Acknowledgements
No acknowledgement found.References
1. Khan MA, Yang EY, Zhan Y, Judd RM, Chan W, Nabi F, Heitner JF, Kim RJ, Klem I, Nagueh SF, Shah DJ. Association of left atrial volume index and all-cause mortality in patients referred for routine cardiovascular magnetic resonance: a multicenter study. J Cardiovasc Magn Reson. 2019 Jan 7;21(1):4.2. Hamatani Y, Ogawa H, Takabayashi K, Yamashita Y, Takagi D, Esato M, Chun YH, Tsuji H, Wada H, Hasegawa K, Abe M, Lip GY, Akao M. Left atrial enlargement is an independent predictor of stroke and systemic embolism in patients with non-valvular atrial fibrillation. Sci Rep. 2016 Aug 3;6:31042.
3. Kuusisto JK, Järvinen VM, Sinisalo JP. Validation of 3D echocardiographic volume detection of left atrium by human cadaveric casts. BMC Med Imaging. 2018 Nov 15;18(1):43.
4. Zareian M, Ciuffo L, Habibi M, Opdahl A, Chamera EH, Wu CO, Bluemke DA, Lima JA, Venkatesh BA. Left atrial structure and functional quantitation using cardiovascular magnetic resonance and multimodality tissue tracking: validation and reproducibility assessment. J Cardiovasc Magn Reson. 2015 Jul 1;17(1):52.
5. Gunasekaran S, Haji-Valizadeh H, Lee DC, Avery RJ, Wilson BD, Ibrahim M, Markl M, Passman RS, Kholmovski EG, Kim D. Accelerated 3D Left Atrial Late Gadolinium Enhancement in Patients with Atrial Fibrillation at 1.5 T: Technical Development. Radiol Cardiothorac Imaging. 2020 Oct 15;2(5):e200134.
6. Wandelt LK, Kowallick JT, Schuster A, Wachter R, Stümpfig T, Unterberg-Buchwald C, Steinmetz M, Ritter CO, Lotz J, Staab W. Quantification of left atrial volume and phasic function using cardiovascular magnetic resonance imaging-comparison of biplane area-length method and Simpson's method. Int J Cardiovasc Imaging. 2017 Nov;33(11):1761-1769.
7. Nanni S, Westenberg JJ, Bax JJ, Siebelink HM, de Roos A, Kroft LJ. Biplane versus short-axis measures of the left atrium and ventricle in patients with systolic dysfunction assessed by magnetic resonance. Clin Imaging. 2016 Sep-Oct;40(5):907-12.
Figures
Figure
1: (A) Biplane area-length method: LA contours on 2- and 4-chamber images at BALmax and BALmin. (B)
LA 3D segmentation on 3D-CE-MRA. (C) LA and LAA 3D segmentation on 3D-LGE-MRI.
Table
1: Baseline clinical
characteristics of the 55 subjects in this study.
Figure
2: LAV
comparison between BALmax, 3D-CE-MRA, and 3D-LGE-MRI methods. BALmax is
significantly lower than 3D-CE-MRA and 3D-LGE-MRI (p<0.001).
Figure
3: Pearson’s
correlations (left) and Bland–Altman plots (right) of the
3D-LGE-MRI vs. BALmax (top), 3D-CE-MRA vs. BALmax (middle), and 3D-CE-MRA vs. 3D-LGE-MRI
(bottom). In the Bland Altman plots, the red lines represent the mean (bias),
and black lines represent the 95% limits of agreement.
DOI: https://doi.org/10.58530/2022/4781