4774
Cardiac Quantitative Susceptibility Mapping for Mitral Annular Calcium: Validation using Quantitative Calcium Scoring on Computed Tomography1Medicine, Weill Cornell Medicine, New York NY, United States, New York, NY, United States, 2Meinig School of Biomedical Engineering, Cornell University, Ithaca NY, United States, New York, NY, United States, 3Radiology, Weill Cornell Medicine, New York NY, United States, New York, NY, United States
Synopsis
This study tested cardiac MRI cardiac quantitative susceptibility mapping (QSM) for measurement of mitral annular calcification (MAC) using the reference of computed tomography (CT). QSM entailed a free-breathing ECG-triggered multi-echo 3D GRE sequence with diaphragmatic navigation via ECG-gating (1D respiratory navigator, 4mm window, acquisition time ~7 minutes, navigator efficiency 36%, spatial resolution 1.5×1.5×5mm3). Among 24 patients undergoing MRI and CT (mean 3.9±3.4 months), annular susceptibility decreased stepwise (p<0.001) and R2* increased (p<0.05) among patients stratified by CT mitral annular calcium score. Both QSM (AUC=0.950, p=0.005) and R2* (AUC=0.938, p=0.007) yielded excellent diagnostic performance for advanced mitral annular calcification on CT.
METHODS: This study entailed prospective imaging of patients undergoing cardiac QSM (3T, GE 750 scanner), in whom chest CT was performed clinically within a 1 year interval: All patients provided written, informed consent at time of CMR. QSM entailed a free-breathing ECG-triggered multi-echo 3D GRE sequence with diaphragmatic navigation via ECG-gating (1D respiratory navigator, 4mm window). Images were typically acquired after gadolinium washout (0.2mmol/kg, ~20-30 minutes post infusion). The IDEAL method was used for multi-echo fat-water separation and to estimate total field; the TFI+0 method was then used for image reconstruction, and to regularize variation of susceptibility within left (LV) and right (RV) ventricular blood pools5. To identify MAC, magnitude gradient echo images were used to place a region of interest (ROI) in consecutive slices encompassing the basal LV: A susceptibility threshold was defined $$$\chi_{th}=\mu_{\chi}-1.5\sigma_{\chi}$$$, with $$$\mu_{\chi}$$$ and $$$\sigma_{\chi}$$$ the mean and standard deviation of susceptibility in the ROIs; the threshold for R2* was set as $$$R2_{th}^*=\mu_{R}+3\sigma_{R}$$$ using the R2* histogram. Susceptibility moment was calculated as $$$∑_{\imath}\chi_{\imath}\upsilon_{\imath}$$$ over the thresholded ROI that were lower than $$$\chi_{th}$$$; R2* moment was calculated as $$$M_{R}=∑_{\imath}R2_{\imath}^*\upsilon_{\imath}$$$ over the thresholded ROI that were higher than $$$R2_{th}^*$$$, respectively, where $$$\upsilon_{\imath}$$$ is the voxel size. CT analysis encompassed blinded interpretation of presence of MAC by experienced readers (JWW, PV), and subsequent quantitative analysis of MAC severity using both Agatston and volumetric methods.
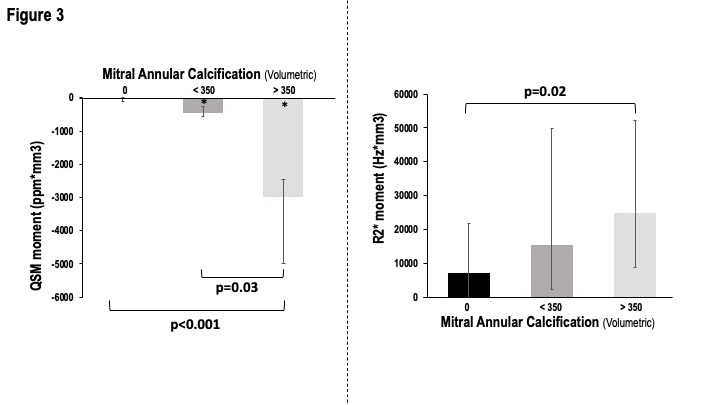
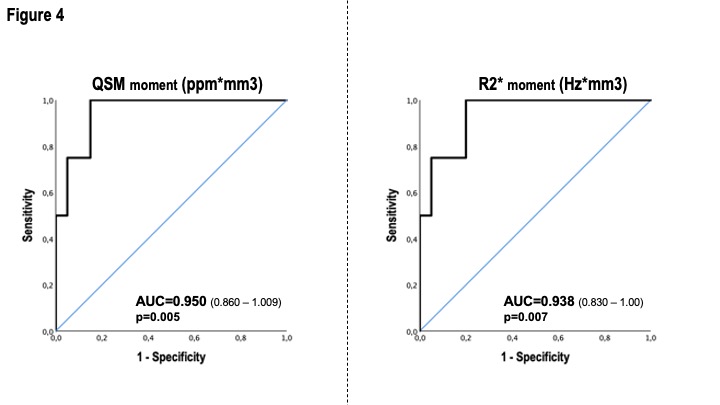
RESULTS: 24 patients (57±16yo, 50% male) underwent cardiac QSM and CT (mean 3.9±3.4 months); MAC was present on CT in 29% (n=7). QSM was acquired within an average time of 7 minutes (navigator efficiency 36%, spatial resolution 1.5×1.5×5mm3). Figure 1 provides representative examples of patients with and without MAC, demonstrating CT evidenced calcium to correspond with presence and location of annular susceptibility on cardiac QSM. Figure 2 demonstrates that annular susceptibility decreased stepwise among patient groups stratified by CT-evidenced mitral annular Agatston score (p<0.001 for trend), including significant differences when annular susceptibility in patients with no CT evidenced calcium (median -13.94 [-101.88 – 0.00] ppm×mm3) was compared to those with mild annular calcium on CT (-536.13 [-1020.96 – -355.74] ppm×mm3, p=0.006), or moderate (>300) annular calcium (-1830.96 [-3401.55 – -401.76] ppm×mm3, p=0.002). R2* demonstrated similar results (no vs. moderate CT calcium: 7166.22 [0.00 – 21669.47] vs. 38516.81 [22307.08 – 57603.07] Hz×mm3, p=0.008½ mild vs. moderate CT calcium: 8801.48 [0.00 – 9542.88] vs. 38516.81 [22307.08 – 57603.07] Hz×mm3, p=0.03). Figure 3 demonstrates that similar stepwise decrements in susceptibility were evident when patients were stratified based on volumetric calcium scores (p<0.001 for trend). Regarding cardiac structure and function, patients with advanced mitral regurgitation (>mild) had numerically lower QSM (-231.44 [-751.96 – -231.44] vs. -72.53 [-233.04 –0.00], p=0.343), paralleling differences in CT annular calcium score (121.00 [0 – 286.75] vs. 0.00 [0.00 – 20.78], p=0.45) although differences did not attain significance in this pilot study. ROC analysis (shown in Figure 4) demonstrates that both QSM (AUC=0.950, p=0.005) and R2* (AUC=0.938, p=0.007) yielded excellent overall diagnostic performance for identification of advanced MAC, for which an partition value of -260.33 ppm×mm3 for QSM yielded sensitivity of 100% and specificity of 85%, and 21309.97 for R2* yielded sensitivity of 100% and specificity of 80% in relation to the reference standard of CT.
CONCLUSION: Mitral annular susceptibility on cardiac QSM provides a novel cardiac MRI approach to assess calcification, which corresponds to presence and severity of CT quantified MAC.
Acknowledgements
No acknowledgement found.References
1. Abramowitz Y, Jilaihawi H, Chakravarty T, Mack MJ, Makkar RR. Mitral Annulus Calcification. J Am Coll Cardiol. 2015;66(17):1934-1941. doi:10.1016/j.jacc.2015.08.872
2. Guerrero M, Wang DD, Pursnani A, Eleid M, Khalique O, Urena M, Salinger M, Kodali S, Kaptzan T, Lewis B, Kato N, Cajigas HM, Wendler O, Holzhey D, Pershad A, Witzke C, Alnasser S, Tang GHL, Grubb K, Reisman M, Blanke P, Leipsic J, Williamson E, Pellikka PA, Pislaru S, Crestanello J, Himbert D, Vahanian A, Webb J, Hahn RT, Leon M, George I, Bapat V, O'Neill W, Rihal C. A Cardiac Computed Tomography-Based Score to Categorize Mitral Annular Calcification Severity and Predict Valve Embolization. JACC Cardiovasc Imaging. 2020 Sep;13(9):1945-1957. doi: 10.1016/j.jcmg.2020.03.013. PMID: 32417332.
3. Wang Y, Liu T. Quantitative susceptibility mapping (QSM): Decoding MRI data for a tissue magnetic biomarker. Magn Reson Med. 2015;73(1):82-101. doi:10.1002/mrm.25358
4. Chen W, Zhu W, Kovanlikaya I, et al. Intracranial calcifications and hemorrhages: Characterization with quantitative susceptibility mapping. Radiology. 2014;270(2):496-505. doi:10.1148/radiol.13122640
5. Li J, Mitlak H, Nambiar L, Wang Y, Chan A, Spincemaille P, Weinsaft JW. Free-Breathing Navigator Cardiac Quantitative Susceptibility Mapping for Detection of Mitral Annular Calcium – Initial Validation via Computed Tomography and Echocardiography (abstract). The International Society for Magnetic Resonance in Medicine. 2021; ISMRM & SMRT Annual Meeting & Exhibition.
Figures