4768
Evaluation of traumatic brain injury in pigs using a novel cross-group temporal correlation analysis1Department of Physics and Astronomy, University of Georgia, Athens, GA, United States, 2Regenerative Bioscience Center and Department of Animal and Dairy Science, University of Georgia, Athens, GA, United States
Synopsis
Traumatic brain injury (TBI) can lead to dynamic changes in functional network activity that can be assessed by functional magnetic resonance imaging (fMRI). In this study, we utilized a novel temporal correlation analysis approach to evaluate a novel microbiome transplantation treatment effect on network connectivity in a translational porcine. Sparse dictionary learning (sDL) and independent component analysis (ICA) were applied to both a full dataset (TBI and sham) and the Sham-only dataset, resulting in four groups of results. Consistency was observed across the four results, indicating that evaluation of treatment effects can be achieved through the proposed temporal correlation analysis.
Introduction
fMRI has significant potential in evaluating alterations in brain functional connectivity after a TBI and network recovery due to novel therapeutics. Research in the pig TBI model has significantly increased as this translational animal model is likely more predictive of human outcomes leading to improved therapeutic device and pharmacological treatment development. Recently our team showed that pigs have homologous resting-state functional networks comparable to human brains; further highlighting the pig model for the study of dynamic network changes1. To evaluate a new microbiome transplant TBI treatment, we developed a novel cross-group temporal comparison method, which evaluates similarity of functional activity between the TBI groups and the sham group. Time series acquired from functional analysis in pig TBI groups were correlated with those of sham group2.Methods
A total of 18 pigs were used in this double-blinded study. Among them, 12 received a moderate-severe TBI and 6 received the sham surgery and no TBI. TBI pigs was secured in a controlled cortical impactor device and a 15 mm impactor tip was positioned over the intact dura to induce injury in the sensorimotor network region3. The 12 TBI pigs were divided into two groups, one with microbiome transplant treatment (a daily oral gavage of fecal matter from healthy animals) M1 (n=6) and a saline solution control treatment M2 (n=6). The third group of sham pigs (n=6) went through craniotomy surgery only. T1-weighted anatomical and rs-fMRI data were collected from all pigs at day 1 (D1) and day 7 (D7) after surgery using a GE 32-channel fixed-site Discovery MR750 3.0 Tesla magnet and an 8-channel knee coil.Data pre-analysis and node selection
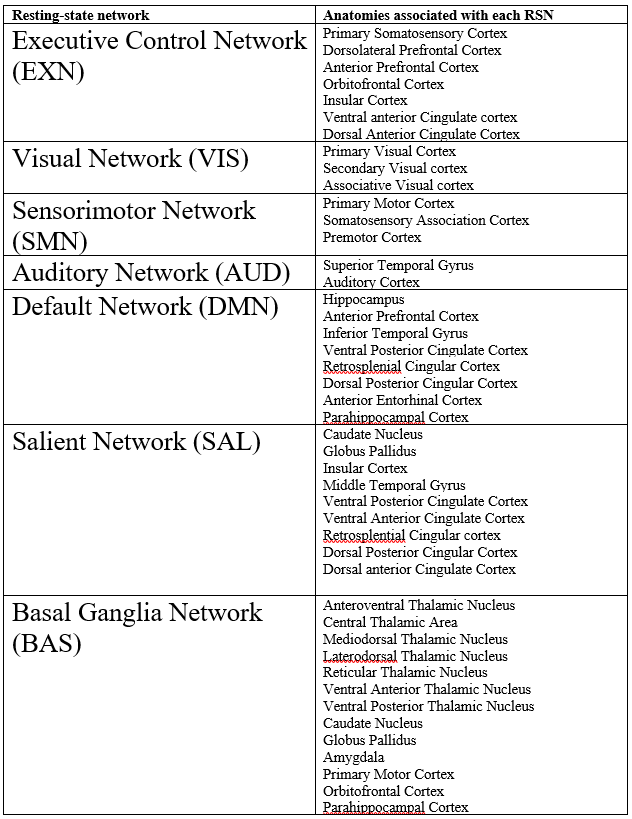
The between-group analysis of the rs-fMRI data was applied to both the full set of data (18 subjects at 2 time points) and the sham-only set (6 sham subjects at 2 time points) for comparison. The analysis was carried out by two approaches, group independent component analysis (ICA) using FSL MELODIC4 and sparse dictionary learning (sDL) using SPAMS. Every components’ activation map was registered to the template brain and compared to atlases of resting-state networks (RSNs. See table 1 for details). The component with the highest Pearson correlation for each RSN was recorded as a node representing the network. The dual regression procedure (FSL-based) was then applied and each node’s subject-level time series were generated.Temporal correlation analysis
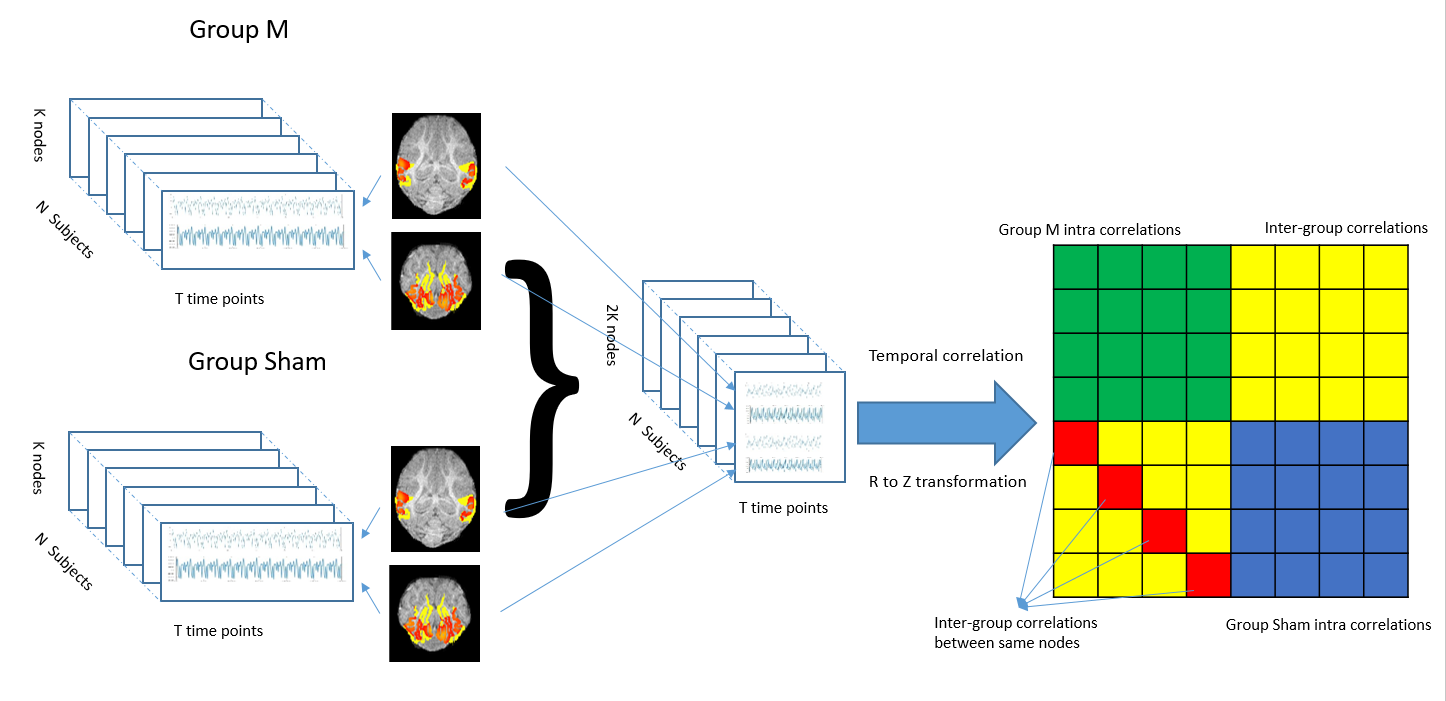
Since the evaluation of disruption and recovery of RSN in TBI pigs is the main interest, the sham group data was employed as a baseline for functional recovery evaluation. The subject-level time series for each node calculated from the sham group were considered to preserve normal functional connectivity in the RSNs. Temporal correlation matrices (Z-scores) between the TBI and the sham groups were calculated on both day 1 and day 7 using FSLNETs functions. Specifically, time series with K nodes and length t were aligned subject-wise from a blinded TBI treatment group and a Sham group (N subjects) after normalization to calculate Z-scores between a node from the TBI groups and the same node from the Sham group (See figure 1). A higher Z-score represents higher similarity, and thus indicates a similar function level for the node. To remove any potential bias in the cross-group correlation analysis, 128 randomized group tests were conducted. In each test, 1 subject was dropped out in each group, and the remaining N-1 subjects were shuffled.Results and Discussions
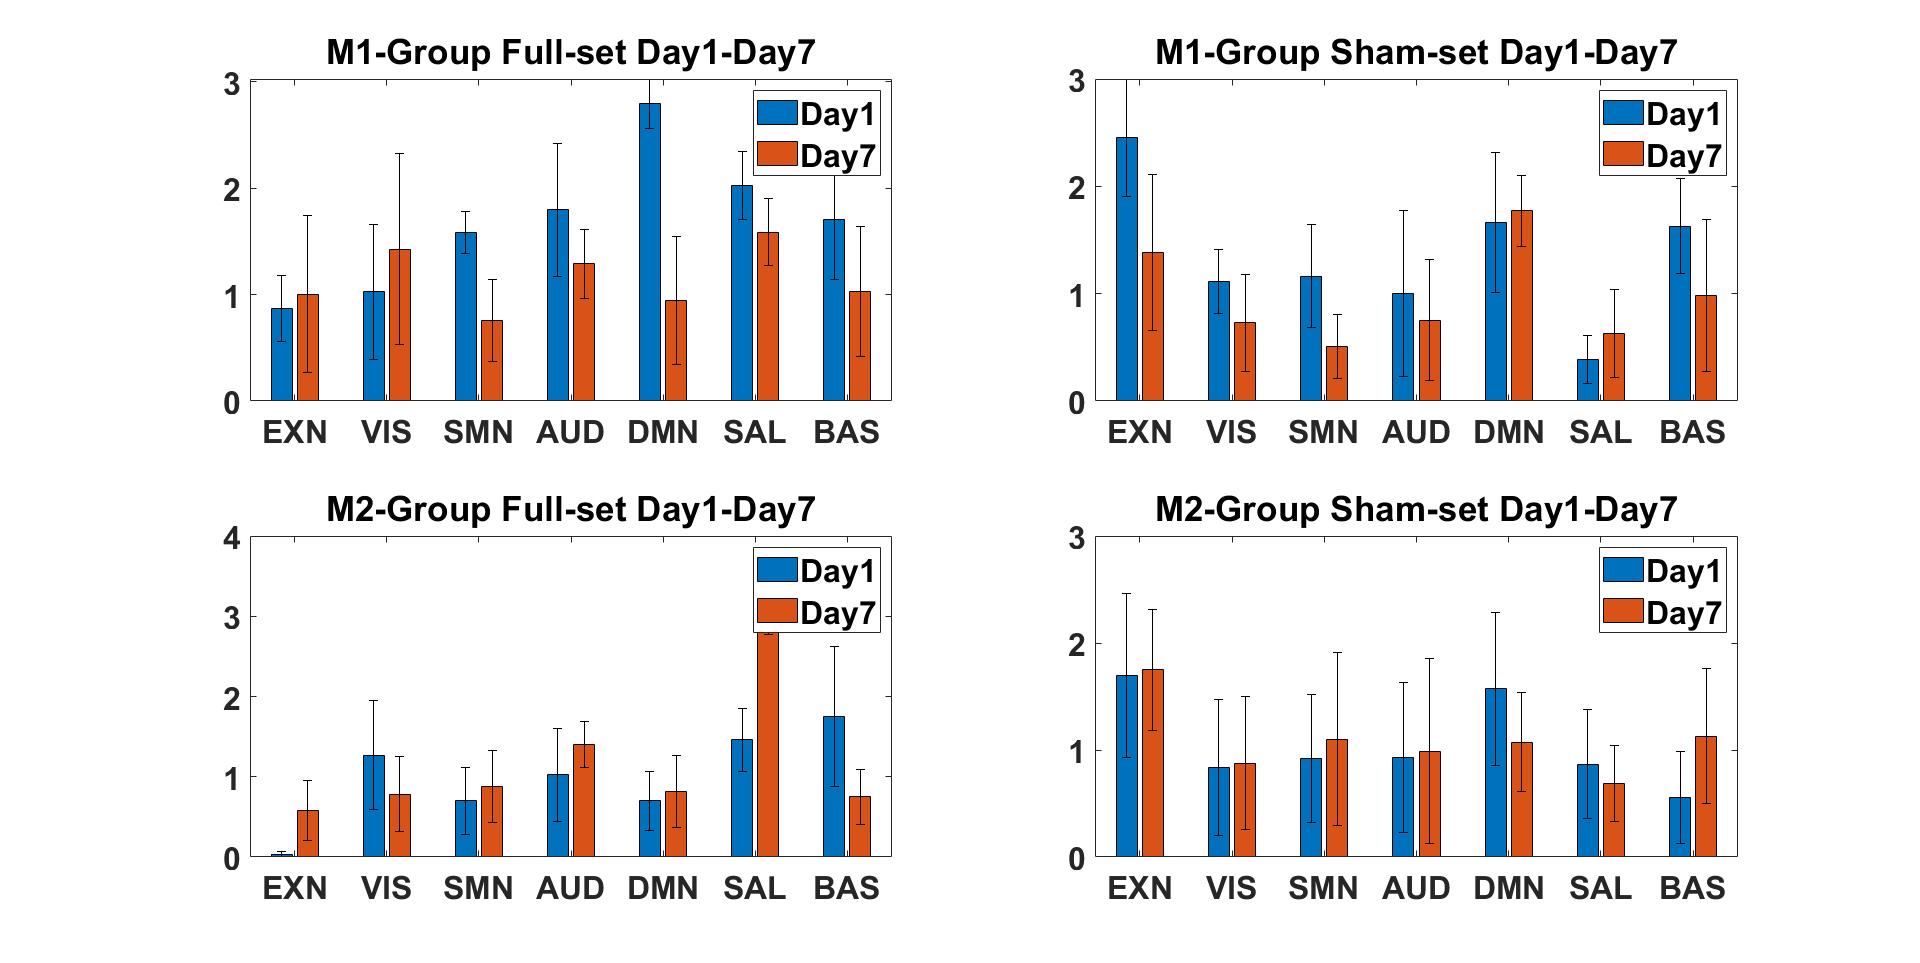
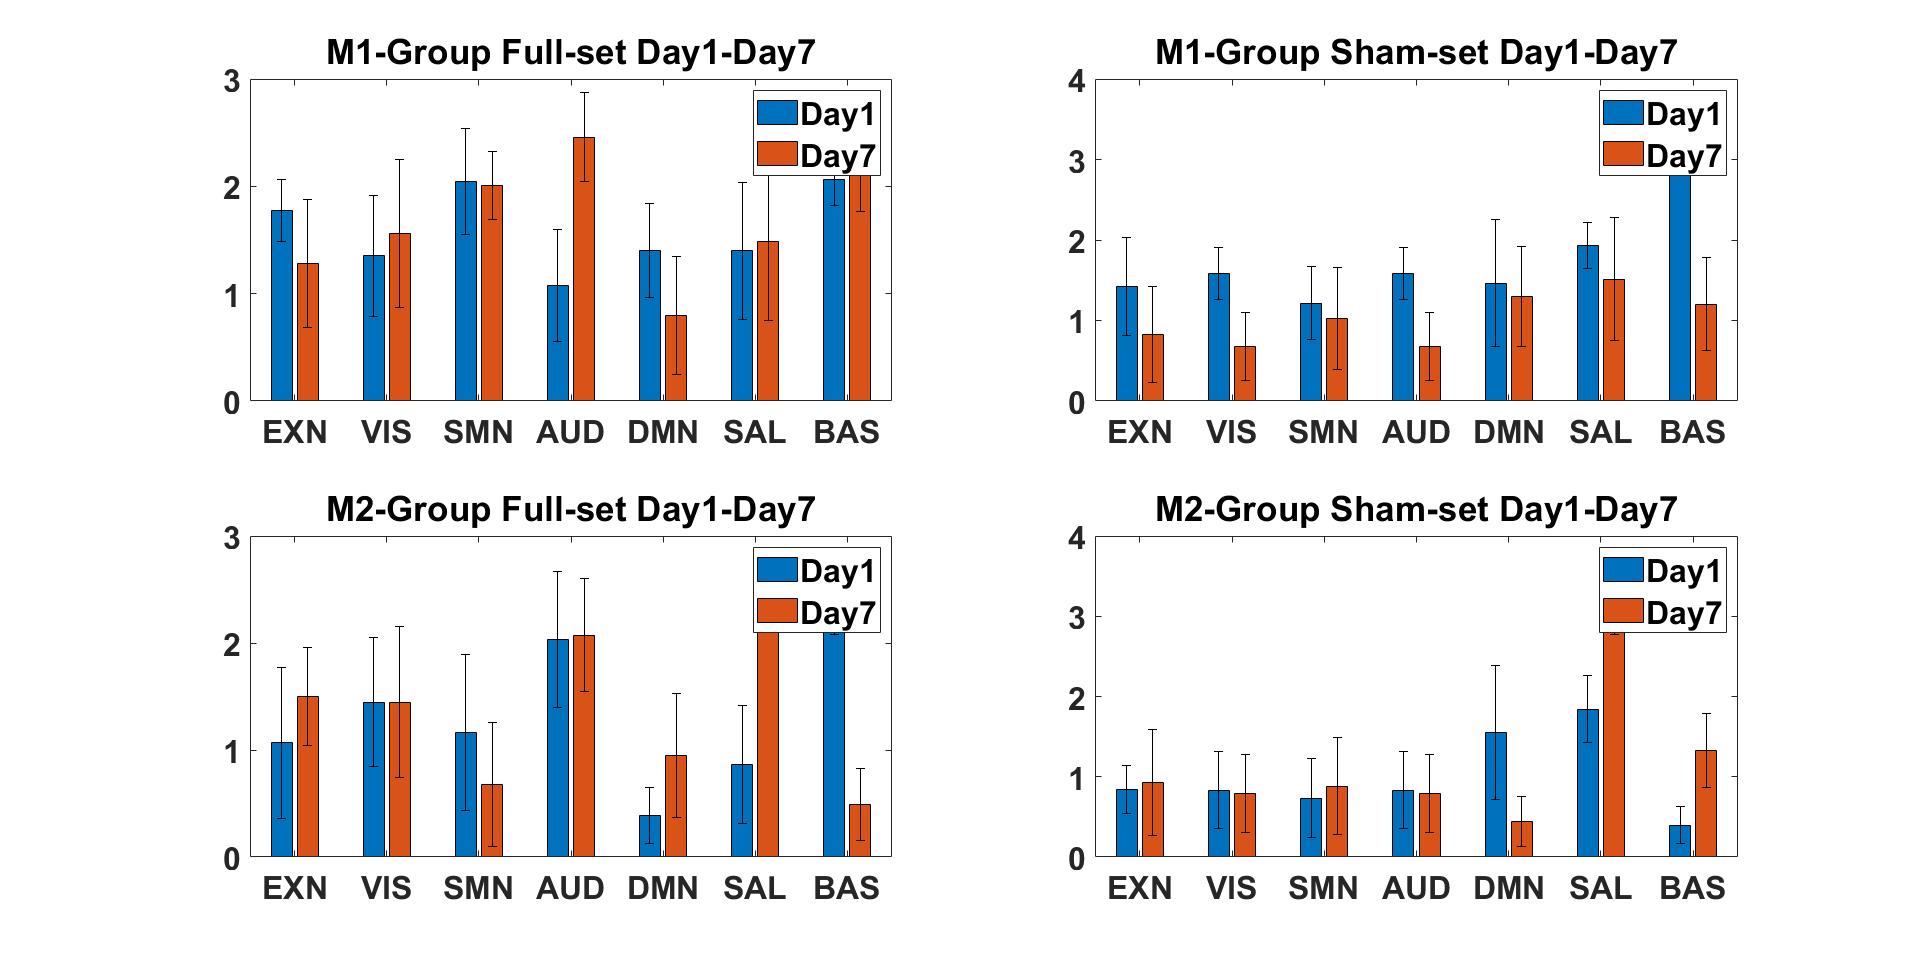
Both ICA and sDL analysis approaches showed an overall decreasing trend from day 1 to day 7 between M1 and M2 groups relative to sham, yet the M2 group showed a lesser decrease than the M1 group. The SMN in the M1 group showed a consistent decrease, while the EXN, AUD, DMN, and BAS networks showed 3 instances of decreases and 1instance of increase out of all 4 results (ICA/sDL analysis combined with Full/Sham set). No network was observed to have more than 2 occasions of increases in the M1 group. The EXN in the M2 group showed a consistent increase, while SMN and SAL network showed 3 instances of increases and 1 decrease. Specifically, all 3 increases of the SAL in the M2 group were significant. According to the results, RSNs of the M1-treated group showed an overall decreasing tendency. Particularly, the SMN in the M1 group showed a consistent decreasing trend, implying a possible worsening functionality due to the TBI. On the other hand, the M2 group showed increases in RSNs including SMN, EXN, and SAL from day 1 to day 7, suggesting a possible functional recovery after the treatment. Overall, the relatively high consistency among the four groups of results indicates the reliability of the novel temporal correlation analysis methodology.Acknowledgements
This work was supported by the Franklin Foundation for Neuroimaging and the College of Agricultural and Environmental Sciences, University of Georgia.References
1. G. Simchick, A. Shen, B. Campbell, H.J. Park, F.D. West, Q. Zhao, Pig Brains Have Homologous Resting State Networks with Human Brains, Brain connectivity (ja) (2019).
2. T.H. Lin, W.M. Spees, C.W. Chiang, K. Trinkaus, A.H. Cross, S.K. Song, Diffusion fMRI detects white-matter dysfunction in mice with acute optic neuritis, Neurobiol Dis 67 (2014) 1-8.
3. G. Simchick, K.M. Scheulin, W. Sun, S.E. Sneed, M.M. Fagan, S.R. Cheek, F.D. West, Q. Zhao, Detecting functional connectivity disruptions in a translational pediatric traumatic brain injury porcine model using resting-state and task-based fMRI, Sci Rep 11(1) (2021) 12406.
4. S.M. Smith, M. Jenkinson, M.W. Woolrich, C.F. Beckmann, T.E. Behrens, H. Johansen-Berg, P.R. Bannister, M. De Luca, I. Drobnjak, D.E. Flitney, R.K. Niazy, J. Saunders, J. Vickers, Y. Zhang, N. De Stefano, J.M. Brady, P.M. Matthews, Advances in functional and structural MR image analysis and implementation as FSL, Neuroimage 23 Suppl 1 (2004) S208-19.
Figures