4767
Longitudinal Recovery of Dynamic Functional Connectivity After Focused Ultrasound-Neuromodulation in V2L of Normal Rat Model
Yu-Chieh Hung1, Yi-Cheng Wang1, Hao-Li Liu2, and Hsu-Hsia Peng1
1Department of Biomedical Engineering and Environmental Sciences, National Tsing Hua University, Hsinchu, Taiwan, 2Department of Electrical Engineering, National Taiwan University, Taipei, Taiwan
1Department of Biomedical Engineering and Environmental Sciences, National Tsing Hua University, Hsinchu, Taiwan, 2Department of Electrical Engineering, National Taiwan University, Taipei, Taiwan
Synopsis
Non-invasive focused ultrasound (FUS) offered attractive advantages to modulate neuronal activity. The functional connectivity (FC) between different brain regions is a dynamic process during a period of examinations. We aimed to explore the longitudinal effect of FUS-neuromodulation on secondary visual cortex lateral area (V2L) by dynamic FC. We assessed k-means analysis and dynamic network analysis of dynamic FC of Pre-FUS, Sham, 35-min, 3-hr, and 3-day after FUS sonication at V2L. We found the instant effect of FUS-neuromodulation (35-min) and the recovery in a longitudinal follow-up of 3-day, suggesting the potential usefulness of FUS-neuromodulation.
Introduction
Focused ultrasound (FUS) is a noninvasive neuromodulation technique that provides advantages of deep penetration and high spatial precision1. Low-intensity FUS-stimulation was proposed to present mechanical displacements on targeting region, where the membrane stretching and the opening of specific ion channel resulted in the changes of nerve activity2,3.Resting state fMRI (rs-fMRI) and the computed functional connectivity (FC) were proposed to be a noninvasive approach to reflect neural activity4. Previous studies used temporal fluctuations of FC, dynamic FC (dFC), to capture short-term changes in FC5,6. Secondary visual cortex lateral area (V2L) was associated with multisensory integration in rats7. However, studies about the longitudinal effect of FUS-neuromodulation in V2L were deficient. The purpose of this study was to explore the longitudinal effect of dFC after FUS-neuromodulation at V2L area in a normal rat model.
Methods
Twenty adult male Sprague-Dawley rats (8-12 weeks, 300-420 g) were recruited: 7 rats without FUS stimulation (Pre-FUS), 6 rats with acquisition of rs-fMRI after 35-min, 3-hr, and 3-day of FUS stimulation at left V2L region, and 7 rats (Sham) received FUS stimulation at nose to understand the auditory response of FUS sonication.A single-element transducer (RK300, FUS instrument) delivered FUS pulses in a burst mode with a FUS protocol as in previous study8: pulse repetition frequency=100 Hz, peak negative pressure amplitude=0.25 MI, duty cycle=30%, stimulation paradigm=30s-on and 90s-off for 5 cycles, totally 600s. All MRI images were acquired in a 7-Tesla MR scanner (ClinScan, Bruker). The scanning parameters of GE-EPI were: TE/TR=20ms/1000ms, FOV=30×30mm2, matrix size=64×64, slice thickness=1mm, number of slices=15, and 300 volumes.
Figure 1 illustrates the flowchart of generating dFC maps. 36 ROIs were selected to extract BOLD signals9. Pre-processing steps for rs-fMRI data included realignment, coregistration, slice-timing correction, smoothing, detrend and band-pass filtering with range 0.01-0.08 Hz. The dFC analysis was performed with sliding window approach (window width=33s, 1s/step). Pearson’s correlation coefficients of mean BOLD signals between two ROIs were computed and transformed with Fisher-z transformation.
K-means clustering with elbow method10 (L1 distance, repeat:500 times) was used to classify all dFC maps into 4 states. The probability% denotes occurrence percentages of a specific state. The mean dwell time denotes average numbers of consecutive windows of a specific state. The number of transitions reflected frequency of transitions between different states. The standard deviation (SD) of global efficiency (Eg) and local efficiency (Eloc) evaluated the variability in functional network based on graph-theory (edge density thresholds=20%-50% with 5% interval)11.
Kruskal-Wallis test and post-hoc test were used when appropriate. A p<0.05 was considered as statistically significant.
Results
Figure 2 illustrates 4 representative states of dFC maps, clustering from dynamic FC maps of all five groups.In Figure 3, probability% of State 1 in 35-min group was higher than Pre-FUS (28% vs. 2%, p<0.01) and recovered to 3% in 3-day (p<0.05). The probability% of State 4 decreased from Pre-FUS to 35-min and increasingly recover to 61% at 3-day (p<0.05). The mean dwell time of State 1 increased in 35-min than Pre-FUS (p<0.05) and recovered to 3.3±6.4 windows at 3-day. The 35-min group possessed higher number of transitions between State 1&2 than Pre-FUS (p<0.01) and decreasingly recovered to 1.3±2.2 at 3-day (p<0.05).
In Figure 4, 35-min presented higher SD of Eg than Pre-FUS (p<0.01) and it recovered in 3-day group (p<0.05). Similarly, 35-min exhibited increased SD of Eloc than Pre-FUS (p<0.01).
Discussion and Conclusions
K-means and dynamic network analyses of dFC were used to investigate the effect of FUS sonication at V2L for Pre-FUS, Sham, 35-min, 3-hr, and 3-day groups. We found the instant effect of FUS-neuromodulation (35-min) and the recovery in a longitudinal follow-up of 3-day.In State 1, higher FC between DMN and somatosensory, visual, and auditory cortex was associated with better performance in attention and executive function12. State 4, which appeared in all rats, was considered as a baseline state because of the weakest connectivity strength and the highest probability%13,14. In 35-min group, the increased probability% and mean dwell time in State 1 and decreased values in State 4 coordinately indicated overall improvements of functional connectivity after FUS sonication. The increased number of transitions between State1&2 in 35-min group suggested the potential of FUS to facilitate flexible reconfiguration between different FC states15. SD of Eg and Eloc are associated with efficient and adaptive communication between brain regions16. The 35-min group possessed increased SD of Eg and Eloc denoted the higher variability of functional communication after FUS sonication. Therefore, the response of altered dFC after FUS sonication might potentially suggest a new treatment strategy for improving symptoms of individuals with low functional connectivity17.
A previous study reported sustained impact of functional connectivity two hours after FUS stimulation18. We revealed that the influence of FUS-neuromodulation was obviously in 35-min group and recovered in 3-day group, meaning that the effect of FUS was temporary. A systematic investigation of different FUS conditions and sonicating time can help to understand the long-term effect of FUS-neuromodulation.
In conclusion, we quantitatively analyzed dFC to evaluate the longitudinal recoverable effect of FUS-neuromodulation on V2L region, suggesting the temporary facilitation of the flexibility in integration and exchange of information.
Acknowledgements
No acknowledgement found.References
- Blackmore, Joseph, et al. “Ultrasound neuromodulation: a review of results, mechanisms and safety.” Ultrasound in medicine & biology 45.7 (2019): 1509-1536.
- Kubanek, Jan, et al. “Ultrasound elicits behavioral responses through mechanical effects on neurons and ion channels in a simple nervous system.” Journal of Neuroscience 38.12 (2018): 3081-3091.
- Kubanek, Jan, et al. “Ultrasound modulates ion channel currents.” Scientific reports 6.1 (2016): 1-14.
- Lau, W. K. W., et al. “Resting-state abnormalities in amnestic mild cognitive impairment: a meta-analysis.” Translational psychiatry 6.4 (2016): e790-e790.
- Preti, Maria Giulia, Thomas AW Bolton, and Dimitri Van De Ville. “The dynamic functional connectome: State-of-the-art and perspectives.” Neuroimage 160 (2017): 41-54.
- Liegeois, Raphael, et al. “Interpreting temporal fluctuations in resting-state functional connectivity MRI.” Neuroimage 163 (2017): 437-455.
- Hirokawa, J., et al. “Functional role of the secondary visual cortex in multisensory facilitation in rats.” Neuroscience 153.4 (2008): 1402-1417.
- Chen, Sin-Guang, et al. “Transcranial focused ultrasound pulsation suppresses pentylenetetrazol induced epilepsy in vivo.” Brain stimulation 13.1 (2020): 35-46.
- Todd, Nick, et al. “Focused ultrasound induced opening of the blood-brain barrier disrupts inter-hemispheric resting state functional connectivity in the rat brain.” Neuroimage 178 (2018): 414-422.
- Allen, Elena A., et al. "Tracking whole-brain connectivity dynamics in the resting state." Cerebral cortex 24.3 (2014): 663-676.
- Christiaen, Emma, et al. "Dynamic functional connectivity and graph theory metrics in a rat model of temporal lobe epilepsy reveal a preference for brain states with a lower functional connectivity, segregation and integration." Neurobiology of disease 139 (2020): 104808.
- Lin, Haixi, et al. "Functional connectivity of attention-related networks in drug-naive children with ADHD." Journal of attention disorders 25.3 (2021): 377-388.
- Gu, Yue, et al. "Abnormal dynamic functional connectivity in Alzheimer’s disease." CNS neuroscience & therapeutics 26.9 (2020): 962-971.
- Viviano, Raymond P., et al. "Associations between dynamic functional connectivity and age, metabolic risk, and cognitive performance." Neurobiology of aging 59 (2017): 135-143.
- Li, Junchao, et al. "High transition frequencies of dynamic functional connectivity states in the creative brain." Scientific reports 7.1 (2017): 1-12.
- Schumacher, Julia, et al. "Dynamic functional connectivity changes in dementia with Lewy bodies and Alzheimer's disease." NeuroImage: Clinical 22 (2019): 101812.
- Chen, Qian, et al. "Alterations in dynamic functional connectivity in individuals with subjective cognitive decline." Frontiers in aging neuroscience 13 (2021).
- Verhagen, Lennart, et al. "Offline impact of transcranial focused ultrasound on cortical activation in primates." Elife 8 (2019): e40541.
Figures
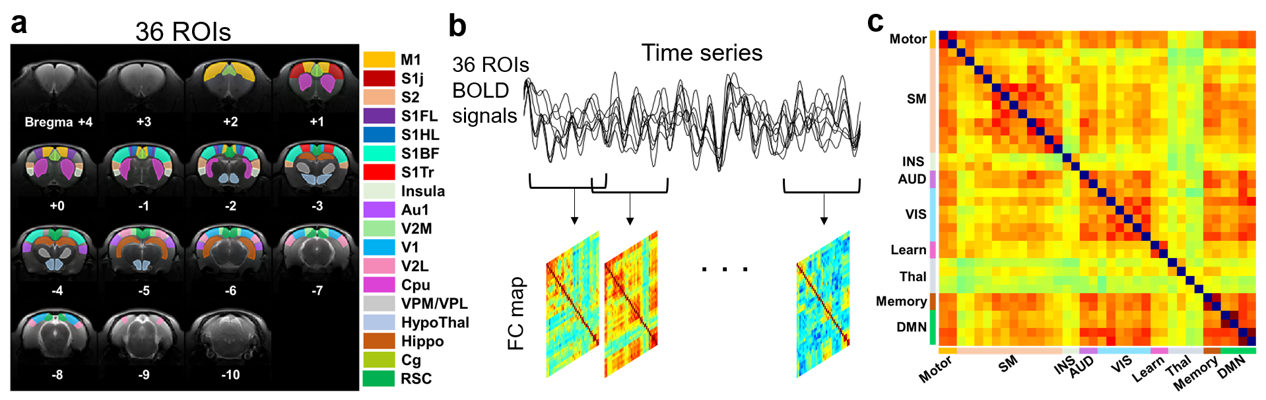
Figure
1. The flow chart of computing correlation
coefficients of functional connectivity maps. (a) The determined 36 ROIs of rat
brain. (b) The dynamic FC analysis was
performed with a sliding window approach. The Pearson’s correlation
coefficients of BOLD signals among 36 ROIs were also computed. (c) 36 ROIs were
divided into 9 groups on FC map
according to their function.
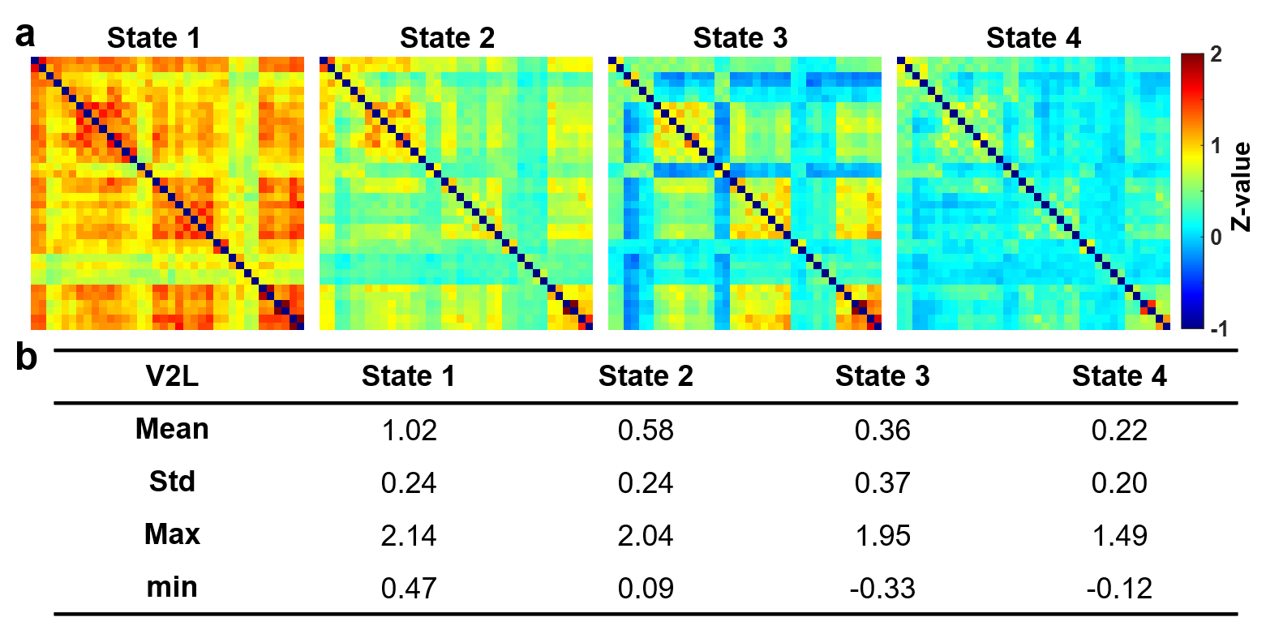
Figure
2. Dynamic
functional connectivity states (z-value) identified by k-means clustering
analysis, sorted from highest (State 1) to lowest (State 4) mean value. (a)
Visualized four states of dynamic functional connectivity of Pre-FUS, Sham,
35-min, 3-hr, and 3-day groups. (b) Corresponding mean, standard deviation,
maximum, and minimum of correlation coefficients of each state.
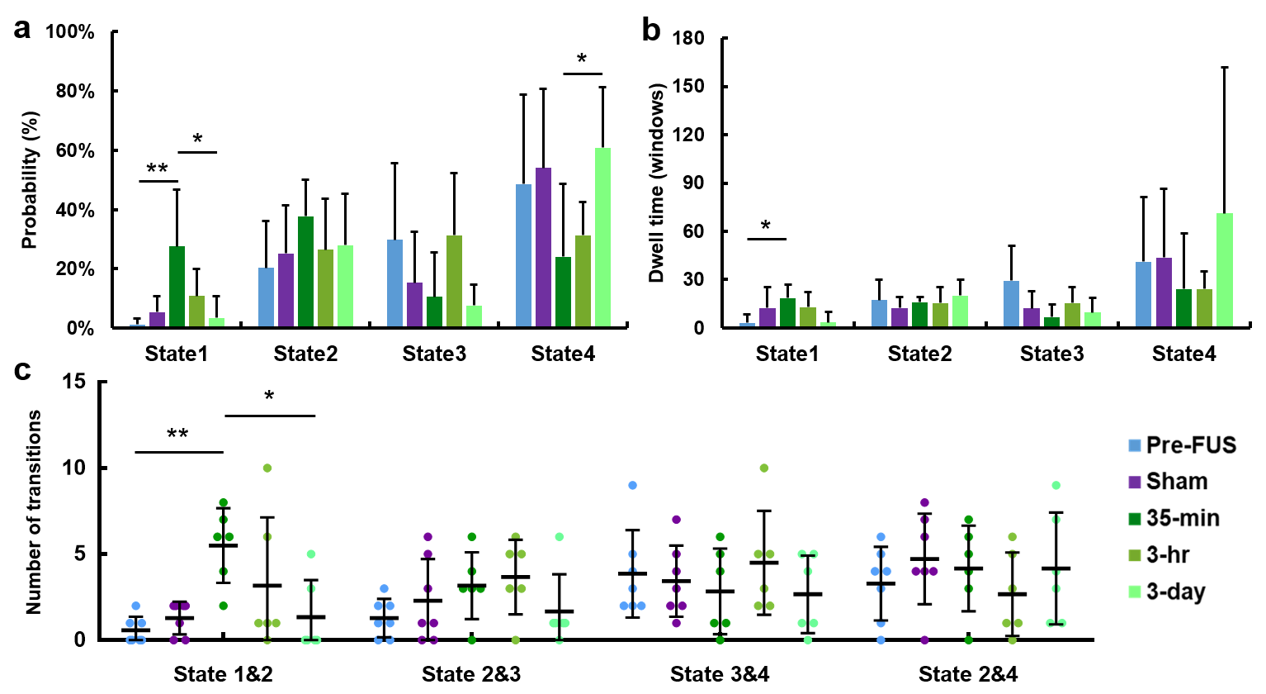
Figure
3. Results
from k-means clustering analysis. (a, b) The probability and the mean dwell time of 4 states occurring in
each group. (c) The number of transitions between states in each group. Not
showing all combinations, since transitions between State 1&3 and State
1&4 were low (close to zero).
*p<0.05, **p<0.01 (from post-hoc tests).
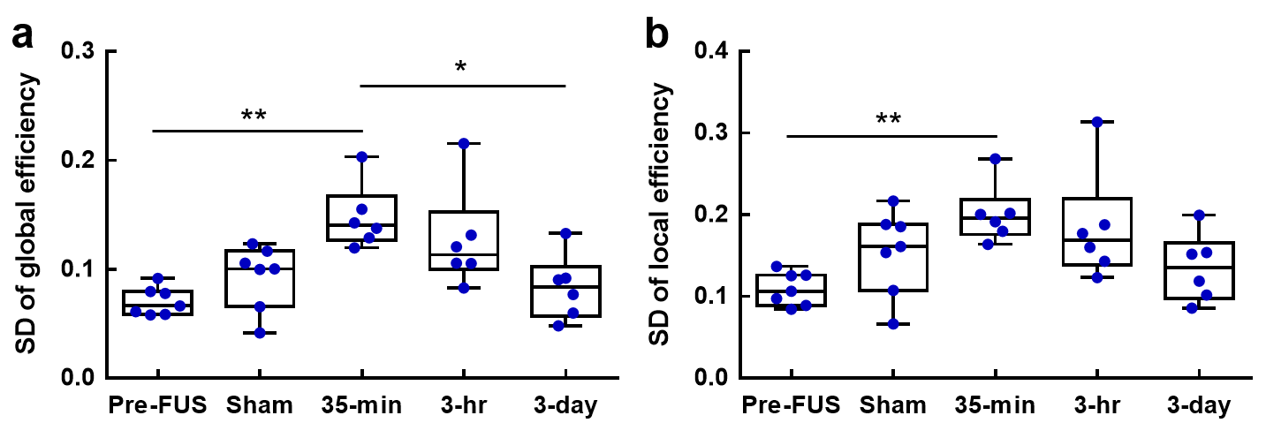
Figure
4. Results
from the dynamic network analysis. The standard deviation over 267 windows for
global efficiency (a) and local efficiency (b) in each group. *p<0.05,
**p<0.01 (from post-hoc tests).
DOI: https://doi.org/10.58530/2022/4767