4765
Disconnectome Associated with Progressive White Matter Hyperintensities in Brain Ageing1Department of Neurology, University of Pennsylvania, Philadelphia, PA, United States, 2College of Medicine and Biological Information Engineering, Northeastern University, Shenyang, China, 3Biggs Alzheimer’s Institute, University of Texas San Antonio, San Antonio, TX, United States
Synopsis
White matter hyperintensities (WMH) are commonly seen in older adults and are associated with an increased risk of cognitive decline and dementia, though the mechanism by which WMH cause cognitive decline are incompletely characterized. In this study, we estimated changes in the structural connectome due WMH with aging using WMH lesion frequency maps derived from a population based study as regions of avoidance for DTI tractography on healthy subject DTI data. We found that subcortical connections to frontal cortex are affected in the 50’s and 60’s, with more widespread disconnection increasing more rapidly in the 70’s and 80’s. However, even in the oldest subjects, most edges were only partially disconnected.
Introduction
White matter hyperintensities (WMH) are commonly seen in older subjects on T2-weighted fluid-attenuated inversion recovery (FLAIR) MRI1. Prior research demonstrates that WMH are associated with an increased risk of cognitive decline, primarily manifesting as deficints in processing speed, and with gray matter atrophy1,2. To evaluate the effects of increasing WMH with ageing on structural connectome, thresholded WMH frequency maps at different ages were used as regions of avoidance in DTI tractography2. The resulting maps illustrate the effects of WMH progression on structural connectivity in late adulthood., and was constructed from a large sample (n=2698). In addition, structural disconnectivity with edges significantly reduced and corresponding proportion disconnectivity were analyzed.Material and Methods
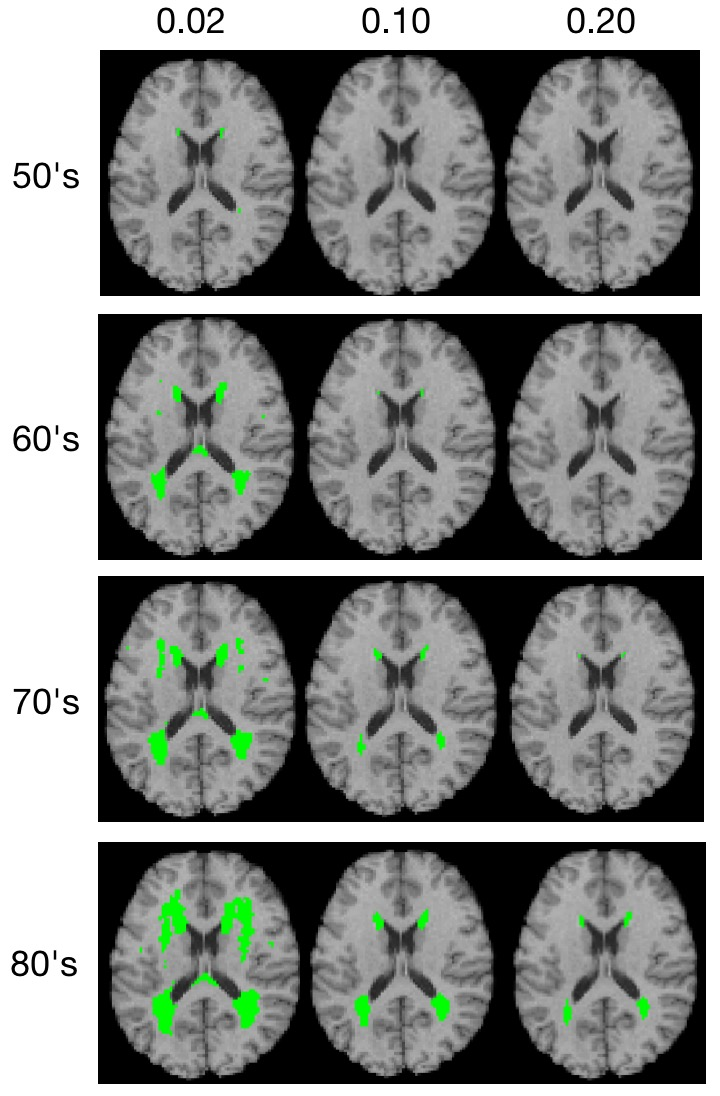
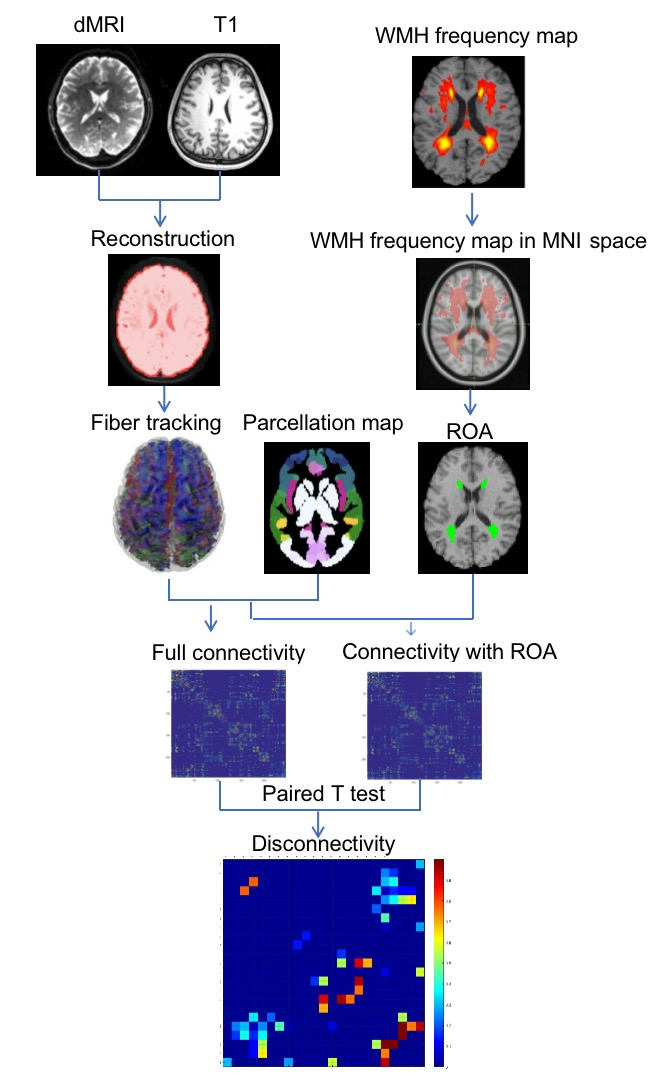
WMH frequency maps were derived from a large population-based sample (n=2698) enrolled in the the Study of Health in Pomerania (SHIP), which included MRI2. WMH frequency maps were generated for each age decade (40’s n=538, 50’s n=668, 60’s n=610, 70’s n=470 and 80’s n=106) and registered to the HCP DTI space. Virtual lesion masks were generated using frequency thresholds of 0.02, 0.10 and 0.20 at four age groups (50’s, 60’s, 70’s and 80’s), as the 40’s cohort had very few lesions (Figure 1).For DTI tractography with and without virtual lesion masks as regions of avoidance (ROA; Figure 2), high quality DTI data for 30 healthy subjects (50% Female, 16.7% aged 22-25 yrs, 56.6% aged 26-30 yrs, 26.7% 31-35 yrs) were selected from the Human Connectome Project (HCP) database (https://www.humanconnectome.org/)3. HCP DTI data were aquired withTR/TE = 5520/89.5ms, 111 slices, 268 x 144 matrix size, 210 x 180 mm2 FOV, 90 directions, 3 shells of b = 1000, 2000, and 3000 s/mm2, and six b = 0 images4.
Structural connectivity was calculated using DSI studio with q-space diffeomorphic reconstruction (QSDR) and whole brain fiber tracking with 107 seed points and fiber length set from 20mm to 400mm5,6. The Brainnectome parcellation map7 was used to define connectivity nodes and the density weighted structural connectivity matrix was calculated with sparsity of 0.98,9 .
To determine the effect of WMH on structural connections, we conducted paired t-tests between the whole brain connectivity matrices and the connectivity matrices with ROA, regions with significant disconnections surviving FDR correction at p<0.01. The proportion of edges in affected regions with ROA to that in the same region without ROA was also calculated.
Results
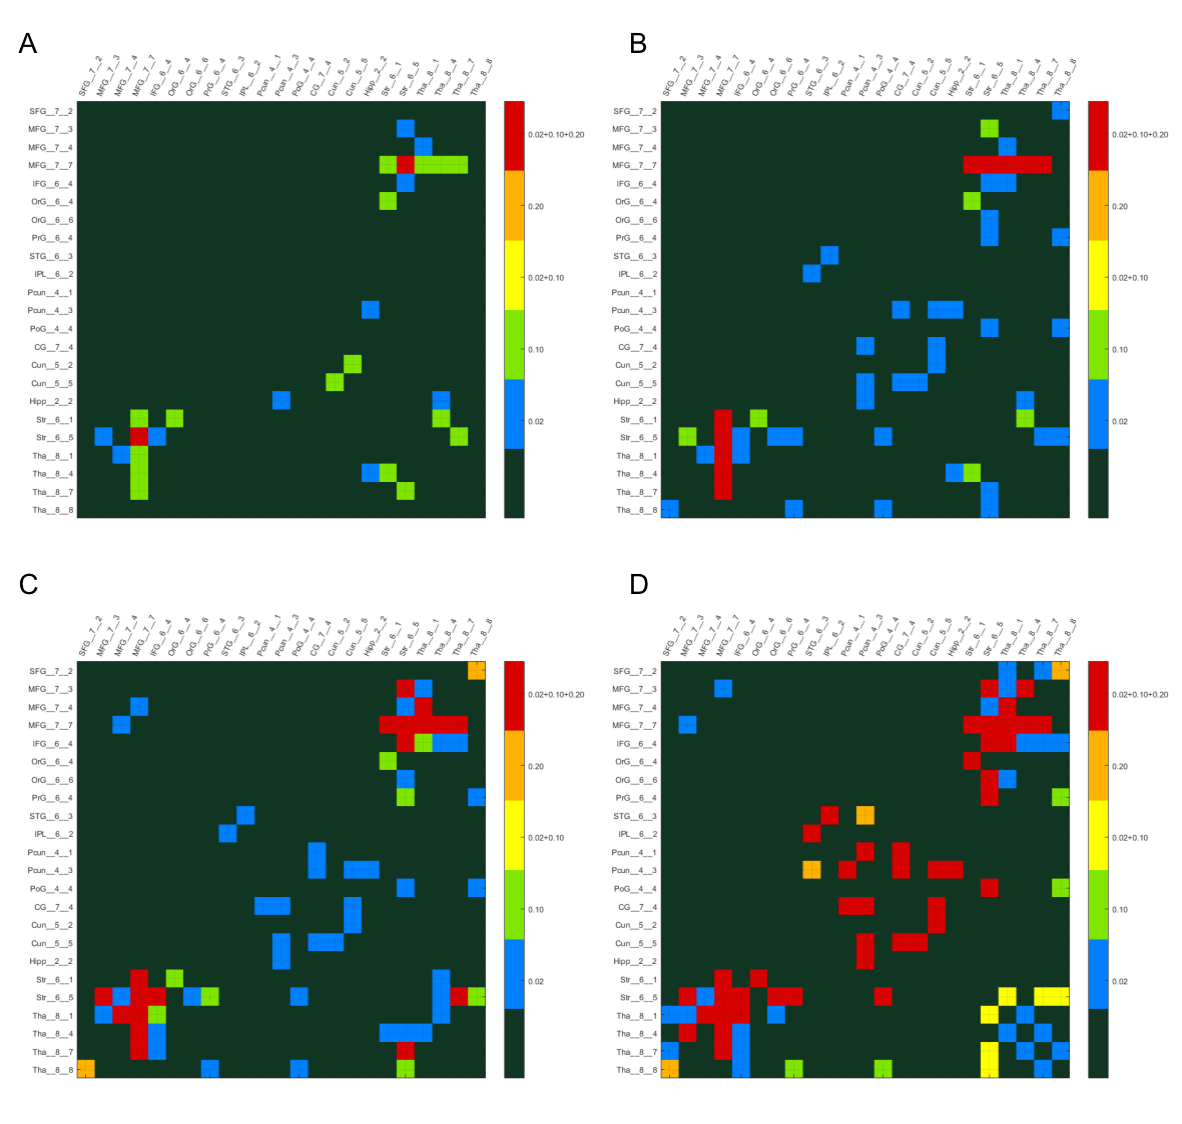
Figure 3, shows the edges with significantly reduced (p<0.01, FDR correction) connectivity across 30 healthy HCP subjects at the four age groups (p<0.01, FDR correction) color-coded for varying WMH mask thresholds. In the 50s, we can find that the disconnections were mostly distributed in the Middle Frontal Gyrus (MFG),Inferior Frontal Gyrus (IFG), Striatum (Str) and Thalamus (Tha). With increasing age, more disconnections also appear in the Precuneus (Pcun), Cingulate Gyrus (CG) and Cuneus (Cun). The persistence of affected edges across age ranges is most stable for the highest threshold (0.2), whereas some of the edges at lower mask thresholds did not persist, reflecting limitations of the sample sizes at each age range.In Figure 4, the ROA with WMH frequency threshold 0.2 is show, this time color coded according to the proportion of fibers at each affected edge. We found that in the affected paired of regions (MFG_Str and MFG Tha) that appeared at the earlier, the proportion is higher at beginning and gradually decreased with increasing age. In addition, in the 70’s and 80’s proportion matrix, the proportion of these brain regions is mostly lower than that of the newly emerging affected brain regions, indicating that these brain regions are more severely affected. While there is some fluctuation in the proportion of disconnected fibers across the age ranges, likely again reflecting limitations of the sample sizes, the majority of affected fibers show only partial disconnection.
Another limitation of this approach is that virtual lesion masks derived from older adults were used as regions of avoidance for tractography in DTI data from younger adults, which could cause coregistration errors. The recent availability of HCP Lifespan data provides access to age matched normative data.
Conclusion
This study estimates the structural connectivity changes due to WMH progression with aging, and demonstrates a progression from subcortical to cortical disconnections. Connectivity changes are most marked above age 70, but even then most disconnections are partial. Widespread partial disconnection may underlie processing speed deficits seen with age associated WMH.Acknowledgements
This work was funded by P30 AG072979, AG070434 and P30AG066546.
References
1. Prins ND, Scheltens P. White matter hyperintensities, cognitive impairment and dementia: an update. Nat Rev Neurol. 2015 Mar;11(3):157-65.
2. Habes M, Erus G, Toledo JB et al. White matter hyperintensities and imaging patterns of brain ageing in the general population. Brain. 2016 Apr;139(Pt 4):1164-79.
3. Van Essen DC, Smith SM, Barch DM et al. WU-Minn HCP Consortium. The WU-Minn Human Connectome Project: an overview. Neuroimage. 2013 Oct 15;80:62-79.
4. Sotiropoulos SN, Jbabdi S, Xu J et al. WU-Minn HCP Consortium. Advances in diffusion MRI acquisition and processing in the Human Connectome Project. Neuroimage. 2013 Oct 15;80:125-43.
5. Li ZJ, Dolui S, Habes M et al. Predicted disconnectome associated with progressive periventricular white matter ischemia. Cerebral Circulation - Cognition and Behavior. 2021 Jul; 2:2666-2450.
6. Power JD, Cohen AL, Nelson SM, et al. Functional network organization of the human brain. Neuron. 2011;72(4):665-678.
7. Jiang, T. Brainnetome: a new -ome to understand the brain and its disorders. NeuroImage. 2013;80:263-272.
8. Roberts JA, Perry A, Roberts G etal. Breakspear M. Consistency-based thresholding of the human connectome. Neuroimage. 2017 Jan 15;145(Pt A):118-129.
9. Qi S, Meesters S, Nicolay K, Ter Haar Romeny BM, et al. Structural Brain Network: What is the Effect of LiFE Optimization of Whole Brain Tractography? Front Comput Neurosci. 2016 Feb. 16:10-12.
Figures