4762
Functional and structural connectomes of the lateral and medial geniculate nuclei in living humans using 7 Tesla MRI
Kavita Singh1, Maria Guadalupe Garcia Gomar1,2, Simone Cauzzo1,3,4, and Marta Bianciardi1,5
1Brainstem Imaging Laboratory, Department of Radiology, Athinoula A. Martinos Center for Biomedical Imaging, Boston, MA, United States, 2National Autonomous University of Mexico, Mexico, Mexico, 3Sant'Anna School of Advanced Studies, Institute of Life Sciences, Pisa, Italy, 4Research Center E. Piaggio, University of Pisa, Pisa, Italy, 5Division of Sleep Medicine, Harvard University, Division of Sleep Medicine, Boston, MA, United States
1Brainstem Imaging Laboratory, Department of Radiology, Athinoula A. Martinos Center for Biomedical Imaging, Boston, MA, United States, 2National Autonomous University of Mexico, Mexico, Mexico, 3Sant'Anna School of Advanced Studies, Institute of Life Sciences, Pisa, Italy, 4Research Center E. Piaggio, University of Pisa, Pisa, Italy, 5Division of Sleep Medicine, Harvard University, Division of Sleep Medicine, Boston, MA, United States
Synopsis
The connectivity of lateral and medial geniculate nuclei with cortical and sub-cortical areas involved in visual and auditory functions is known in humans, yet their recently postulated connectivity with neuromodulatory, visceral and sensory brainstem nuclei is understudied. This is due to limited resolution of clinical scanners and lack of brainstem atlas in living humans. To this end, we applied our recently developed in-vivo atlas of brainstem and diencephalic nuclei to 7 Tesla HARDI and resting-state fMRI, and mapped structural and functional connectomes of lateral and medial geniculate nuclei with brainstem nuclei along with cortical and sub-cortical regions.
Introduction
The lateral (LG) and medial (MG) geniculate nuclei are relay centers for visual and auditory signal transmission through their connectivity to the respective cortices (Figure 1). However, recent research suggests more complex function of LG, which receives varying degree of modulatory activity from serotonergic raphe nuclei1, cholinergic pedunculotegmental and laterodorsal tegmental nuclei2, and noradrenergic locus coeruleus3. MG has also been found to be involved in processing of tactile, thermal, nociceptive, vestibular and visceral stimulation4–6. Based on this evidence, a comprehensive connectome of these nuclei is warranted to study their widespread role. The connectivity of these nuclei with cortical and sub-cortical regions is described in living humans, yet its study lags in brainstem area due to limited resolution of clinical scanners and lack of brainstem atlas in living humans.Purpose
To apply our recently developed in-vivo brainstem and diencephalic nuclei atlas7–12 to 7 Tesla high spatial resolution fMRI and high angular resolution diffusion imaging (HARDI), and map the functional and structural connectivity of LG9 and MG9 with brainstem nuclei along with cortical and other sub-cortical regions.Materials and Methods
Data acquisition: Twenty-healthy subjects (10m/10f, age:29.5±1.1years) underwent 7 Tesla and 3 Tesla MRI under IRB-approval. T1-weighted multi-echo MPRAGE (3 Tesla): isotropic voxel size/TR/TEs/inversion-time/FA/field-of-view/bandwidth/GRAPPA-factor/slice orientation/slice acquisition-order/acquisition-time: 1mm/2.53s/[1.69,3.5,5.3,7.2] ms/1.5s/7°/256×256×176mm3/“650Hz/pixel”/3/ sagittal/anterior-posterior/4′28′′. HARDI (7 Tesla): common single-shot 2D spin-echo EPI unipolar diffusion encoding with parameters: n. slices/TE/TR/phase-encoding direction /bandwidth/partial-Fourier/n. diffusion-directions/b-value: 82 /66.8ms/7.4s/ “anterior/posterior”/ “1456Hz/pixel”/“6/8”/60/2500 s/mm2, seven interspersed “b0” images (b-value=0 s/mm2), acquisition-time: 8ʹ53ʹʹ. fMRI (7 Tesla): three runs of functional gradient-echo EPIs were acquired with the subjects at rest with their eyes closed (isotropic-voxel-size/matrix size/ GRAPPA factor/nominal echo-spacing/readout bandwidth/N.slices/slice orientation/slice acquisition order/echo-time(TE)/repetition-time(TR)/flip angle(FA)/simultaneous-multi-slice factor/N.repetitions/phase encoding direction/acquisition time per run=1.1mm/180×240/3/0.82ms/“1488Hz/ Px”/123/sagittal/interleaved/32ms/2.5s/75°/3/210/anterior-posterior/10’07”). Field-map (7 Tesla): was acquired to perform distortion-correction with: isotropic voxel size/matrix size/readout bandwidth/N. slices/slice orientation/slice acquisition order/TE1/TE2/TR/FA/simultaneous-multi-slice factor/ phase encoding direction=2.0mm/116x132/“1515 Hz/Px”/80/sagittal/interleaved/3.00ms/4.02ms/570.0ms/36°/2’15’’/anterior-posterior.Data analysis: a) Preprocessing: MEMPRAGE image was rotated to standard-orientation, bias-field corrected and parcellated with Freesurfer. HARDIs were de-noised13, motion and distortion-corrected. b) DTI connectivity analysis: We used as seeds the probabilistic labels of left/right LG and MG9 thresholded at 35% (Figure 2), and as targets 148-Freesurfer parcellations14, 21-subcortical regions4, four-seed nuclei labels, and 58 brainstem nuclei7-12. We performed probabilistic tractography using MRtrix3-iFOD2 15 algorithm. We propagated 100,000 streamlines (90-degree maximum angle between successive steps, 0.07 cut-off, 1-mm minimum streamline-length) from each seed-mask, and computed a “structural-connectivity-index” (range:[0 1]) for each pair of seed-target masks (= fraction of streamlines propagated from the seed reaching the target mask). Wilcoxon test was performed on the connectivity-index values, and significant values were displayed with a 2D-circular diagram. c) fMRIs were corrected for physiological noise (RETROICOR16), slice-timing corrected, reoriented, distortion- (FSL, using the field-map) and motion-corrected (Freesurfer). The time-averaged image of the first run was bias-field corrected (SPM) and coregistered to the MEMPRAGE using affine and nonlinear (AFNI17) transformations, which were then applied to the whole time-series. Further, a set of nuisance regressors (including motion, respiration-volume-per-unit-time, cardiac-rate, and time-courses in the cerebro-spinal-fluid surrounding the brainstem) were computed and regressed out (Matlab2019b). Time-courses were then scaled. No spatial smoothing was done. Band-pass filtering was applied between 0.01 Hz and 0.1 Hz (AFNI). Any residual temporal mean was removed, and three runs concatenated. c-i)Region-based connectivity analysis: For each subject, we computed the Pearson’s correlation coefficient between the average time-courses within seeds and the average time-courses within targets. We then averaged the correlation coefficient (Fischer-transformed) after Bonferroni-correction (p = 0.0005) across subjects to yield a 2D-circular plot (‘connectome’). c-ii)Voxel-based analysis: Average time-course within seeds (regressors) were used for single-subject regression analysis (AFNI) on smoothed fMRI data (MNI-space) (Gaussian kernel with 1.25mm standard deviation). Group-level statistics (two-sided one sample t-test, AFNI) was computed on the first level beta coefficients. The false-discovery rate at cluster level was controlled using a corrected p-value between 0.01 and 0.05 obtained by imposing a minimum cluster-size as computed using AFNI program 3dClustsim from the estimated autocorrelation function of the residuals (subcortical activation maps). For cortical activations, the thresholded data was projected on the pial surface using FreeSurfer. For display purposes, a per-voxel p-value between 10-5 and 10-4 was chosen to threshold the activation maps.Results
LG showed expected connectivity with SC (structural and functional), serotonergic raphe nuclei-DR (functional only), cholinergic pedunculopontine-PTg (structural) and laterodorsal tegmental nuclei-LDTg-CGPn (functional), and primary visual cortex-S-calcarine (structural). MG showed expected connectivity with bilateral IC18 (structural), primary auditory cortex -G-temp Sup Transverse region (structural and functional), SC19 (structural), VSM -including dorsal motor nucleus of vagus and solitary nucleus (structural)20, vestibular nuclei-Ve (structural and functional)21 and cerebellum (structural and functional)22 (Figures 3-4). The association between structural and functional connectomes was r=0.13 (p=0.04) for left-LG, r=0.08 (p=0.2) for left-MG, r=0.13 (p=0.03) for right-LG, r=0.14 (p=0.02) for right-MG.Discussion and Conclusion
LG and MG showed connectivity to visual and auditory areas, as well as to neuromodulatory/visceral/sensory brainstem nuclei, in line with a more widespread functional role of these nuclei postulated in recent studies1-6. The association between the functional and structural network was good, yet future studies adopting alternative processing methods might help elucidating their differences.Acknowledgements
NIH NIA-R01AG063982. Dr. Thorsten Feiweier for providing the diffusion sequence used in this study.References
1. Yoshida M, Sasa M, Takaori S. Serotonin-mediated inhibition from dorsal raphe nucleus of neurons in dorsal lateral geniculate and thalamic reticular nuclei. Brain Res. 1984;290(1):95-105. doi:10.1016/0006-8993(84)90739-x2. Krueger J, Disney AA. Structure and function of dual-source cholinergic modulation in early vision. J Comp Neurol. 2019;527(3):738-750. doi:10.1002/cne.245903. Holdefer RN, Jacobs BL. Phasic stimulation of the locus coeruleus: effects on activity in the lateral geniculate nucleus. Exp Brain Res. 1994;100(3):444-452. doi:10.1007/BF027384044. Carstens E, Yokota T. Viscerosomatic convergence and responses to intestinal distension of neurons at the junction of midbrain and posterior thalamus in the cat. Exp Neurol. 1980;70(2):392-402. doi:10.1016/0014-4886(80)90036-95. Love JA, Scott JW. Some response characteristics of cells of the magnocellular division of the medial geniculate body of the cat. Can J Physiol Pharmacol. 1969;47(10):881-888. doi:10.1139/y69-1456. Wepsic JG. Multimodal sensory activation of cells in the magnocellular medial geniculate nucleus. Exp Neurol. 1966;15(3):299-318. doi:10.1016/0014-4886(66)90053-77. Bianciardi M, Strong C, Toschi N, et al. A probabilistic template of human mesopontine tegmental nuclei from in vivo 7T MRI. Neuroimage. 2018;170:222-230. doi:10.1016/j.neuroimage.2017.04.0708. Bianciardi M, Toschi N, Eichner C, et al. In vivo functional connectome of human brainstem nuclei of the ascending arousal, autonomic, and motor systems by high spatial resolution 7-Tesla fMRI. MAGMA. 2016;29(3):451-462. doi:10.1007/s10334-016-0546-39. García-Gomar MG, Strong C, Toschi N, et al. In vivo Probabilistic Structural Atlas of the Inferior and Superior Colliculi, Medial and Lateral Geniculate Nuclei and Superior Olivary Complex in Humans Based on 7 Tesla MRI. Front Neurosci. 2019;13:764. doi:10.3389/fnins.2019.0076410. Singh K, Indovina I, Augustinack JC, et al. Probabilistic Template of the Lateral Parabrachial Nucleus, Medial Parabrachial Nucleus, Vestibular Nuclei Complex, and Medullary Viscero-Sensory-Motor Nuclei Complex in Living Humans From 7 Tesla MRI. Front Neurosci. 2019;13:1425. doi:10.3389/fnins.2019.0142511. Singh K, García-Gomar MG, Bianciardi M. Probabilistic Atlas of the Mesencephalic Reticular Formation, Isthmic Reticular Formation, Microcellular Tegmental Nucleus, Ventral Tegmental Area Nucleus Complex, and Caudal-Rostral Linear Raphe Nucleus Complex in Living Humans from 7 Tesla Magnetic Resonance Imaging. Brain Connect. Published online June 17, 2021. doi:10.1089/brain.2020.097512. Garcia-Gomar MG, Singh K, Bianciardi M. Probabilistic structural atlas and connectome of brainstem nuclei involved in arousal and sleep by 7 Tesla MRI in living humans. In: ISMRM 29th Annual Meeting & Exhibition; 2021.13. Manjón JV, Coupé P, Concha L, Buades A, Collins DL, Robles M. Diffusion weighted image denoising using overcomplete local PCA. PLoS One. 2013;8(9):e73021. doi:10.1371/journal.pone.007302114. Destrieux C, Fischl B, Dale A, Halgren E. Automatic parcellation of human cortical gyri and sulci using standard anatomical nomenclature. Neuroimage. 2010;53(1):1-15. doi:10.1016/j.neuroimage.2010.06.01015. Tournier JD, Smith R, Raffelt D, et al. MRtrix3: A fast, flexible and open software framework for medical image processing and visualisation. Neuroimage. 2019;202:116137. doi:10.1016/j.neuroimage.2019.11613716. Glover GH, Li TQ, Ress D. Image-based method for retrospective correction of physiological motion effects in fMRI: RETROICOR. Magn Reson Med. 2000;44(1):162-167. doi:10.1002/1522-2594(200007)44:1<162::aid-mrm23>3.0.co;2-e17. Cox RW. AFNI: software for analysis and visualization of functional magnetic resonance neuroimages. Comput Biomed Res. 1996;29(3):162-173. doi:10.1006/cbmr.1996.001418. Webster WR, Aitkin LM. Evoked potential and single unit studies of neural mechanisms underlying the effects of repetitive stimulation in the auditory pathway. Electroencephalogr Clin Neurophysiol. 1971;31(6):581-592. doi:10.1016/0013-4694(71)90074-519. Morest DK, Winer JA. The comparative anatomy of neurons: homologous neurons in the medial geniculate body of the opossum and the cat. Adv Anat Embryol Cell Biol. 1986;97:1-94. doi:10.1007/978-3-642-70652-320. Morest DK. The lateral tegmental system of the midbrain and the medial geniculate body: Study with Golgi and Nauta methods in cat. J Anat. 1965;99(Pt 3):611-634.21. Roucoux-Hanus M, Boisacq-Schepens N. Ascending vestibular projections: further results at cortical and thalamic levels in the cat. Exp Brain Res. 1977;29(2):283-292. doi:10.1007/BF0023704822. Raffaele R, Sapienza S, Urbano A. [Fastigial nucleus projections in the pars magnocellularis of the medial geniculate body of the cat]. Boll Soc Ital Biol Sper. 1969;45(20):1296-1298.23. Kandel E, D P of B and MBTMJ M. Principles of Neural Science, Fourth Edition. McGraw-Hill Companies,Incorporated; 2000.Figures
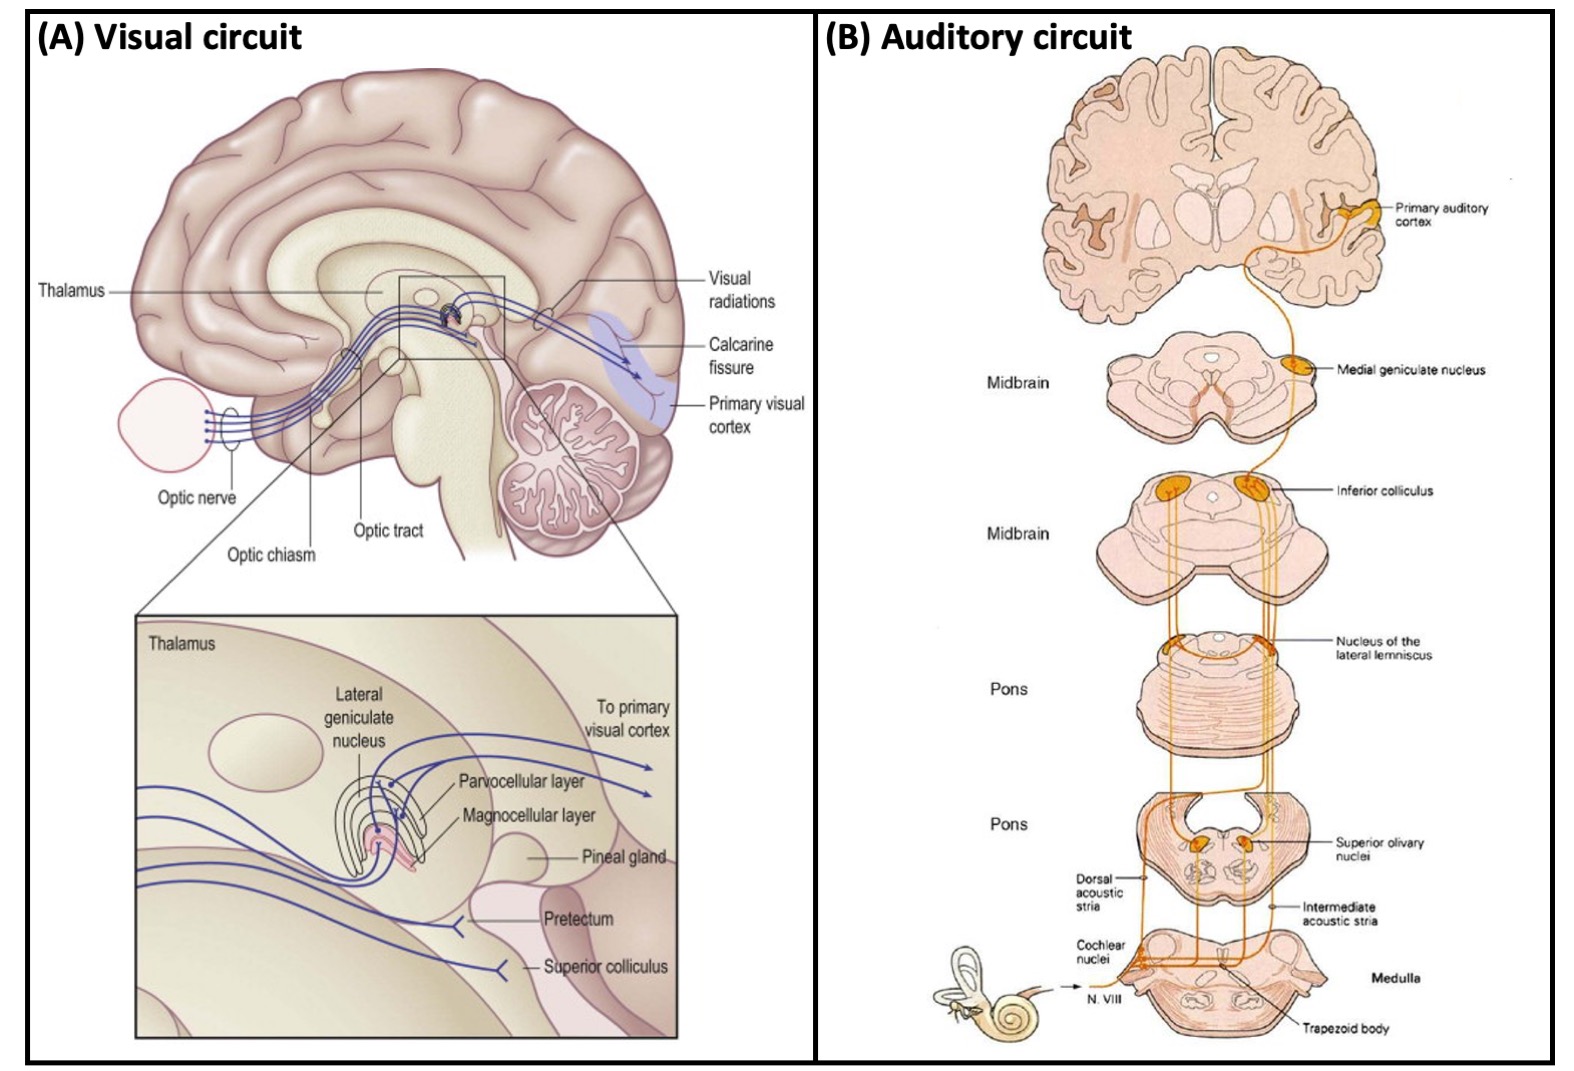
Figure 1: (A) Schematic diagram (top) showing the location of the human lateral geniculate nucleus (LG) in relationship to the rest of the brain, with a magnified view (bottom) of the LG (modified from 23). (B) Schematic diagram showing the location of the human medial geniculate nucleus (MG) and its role in auditory signal processing.
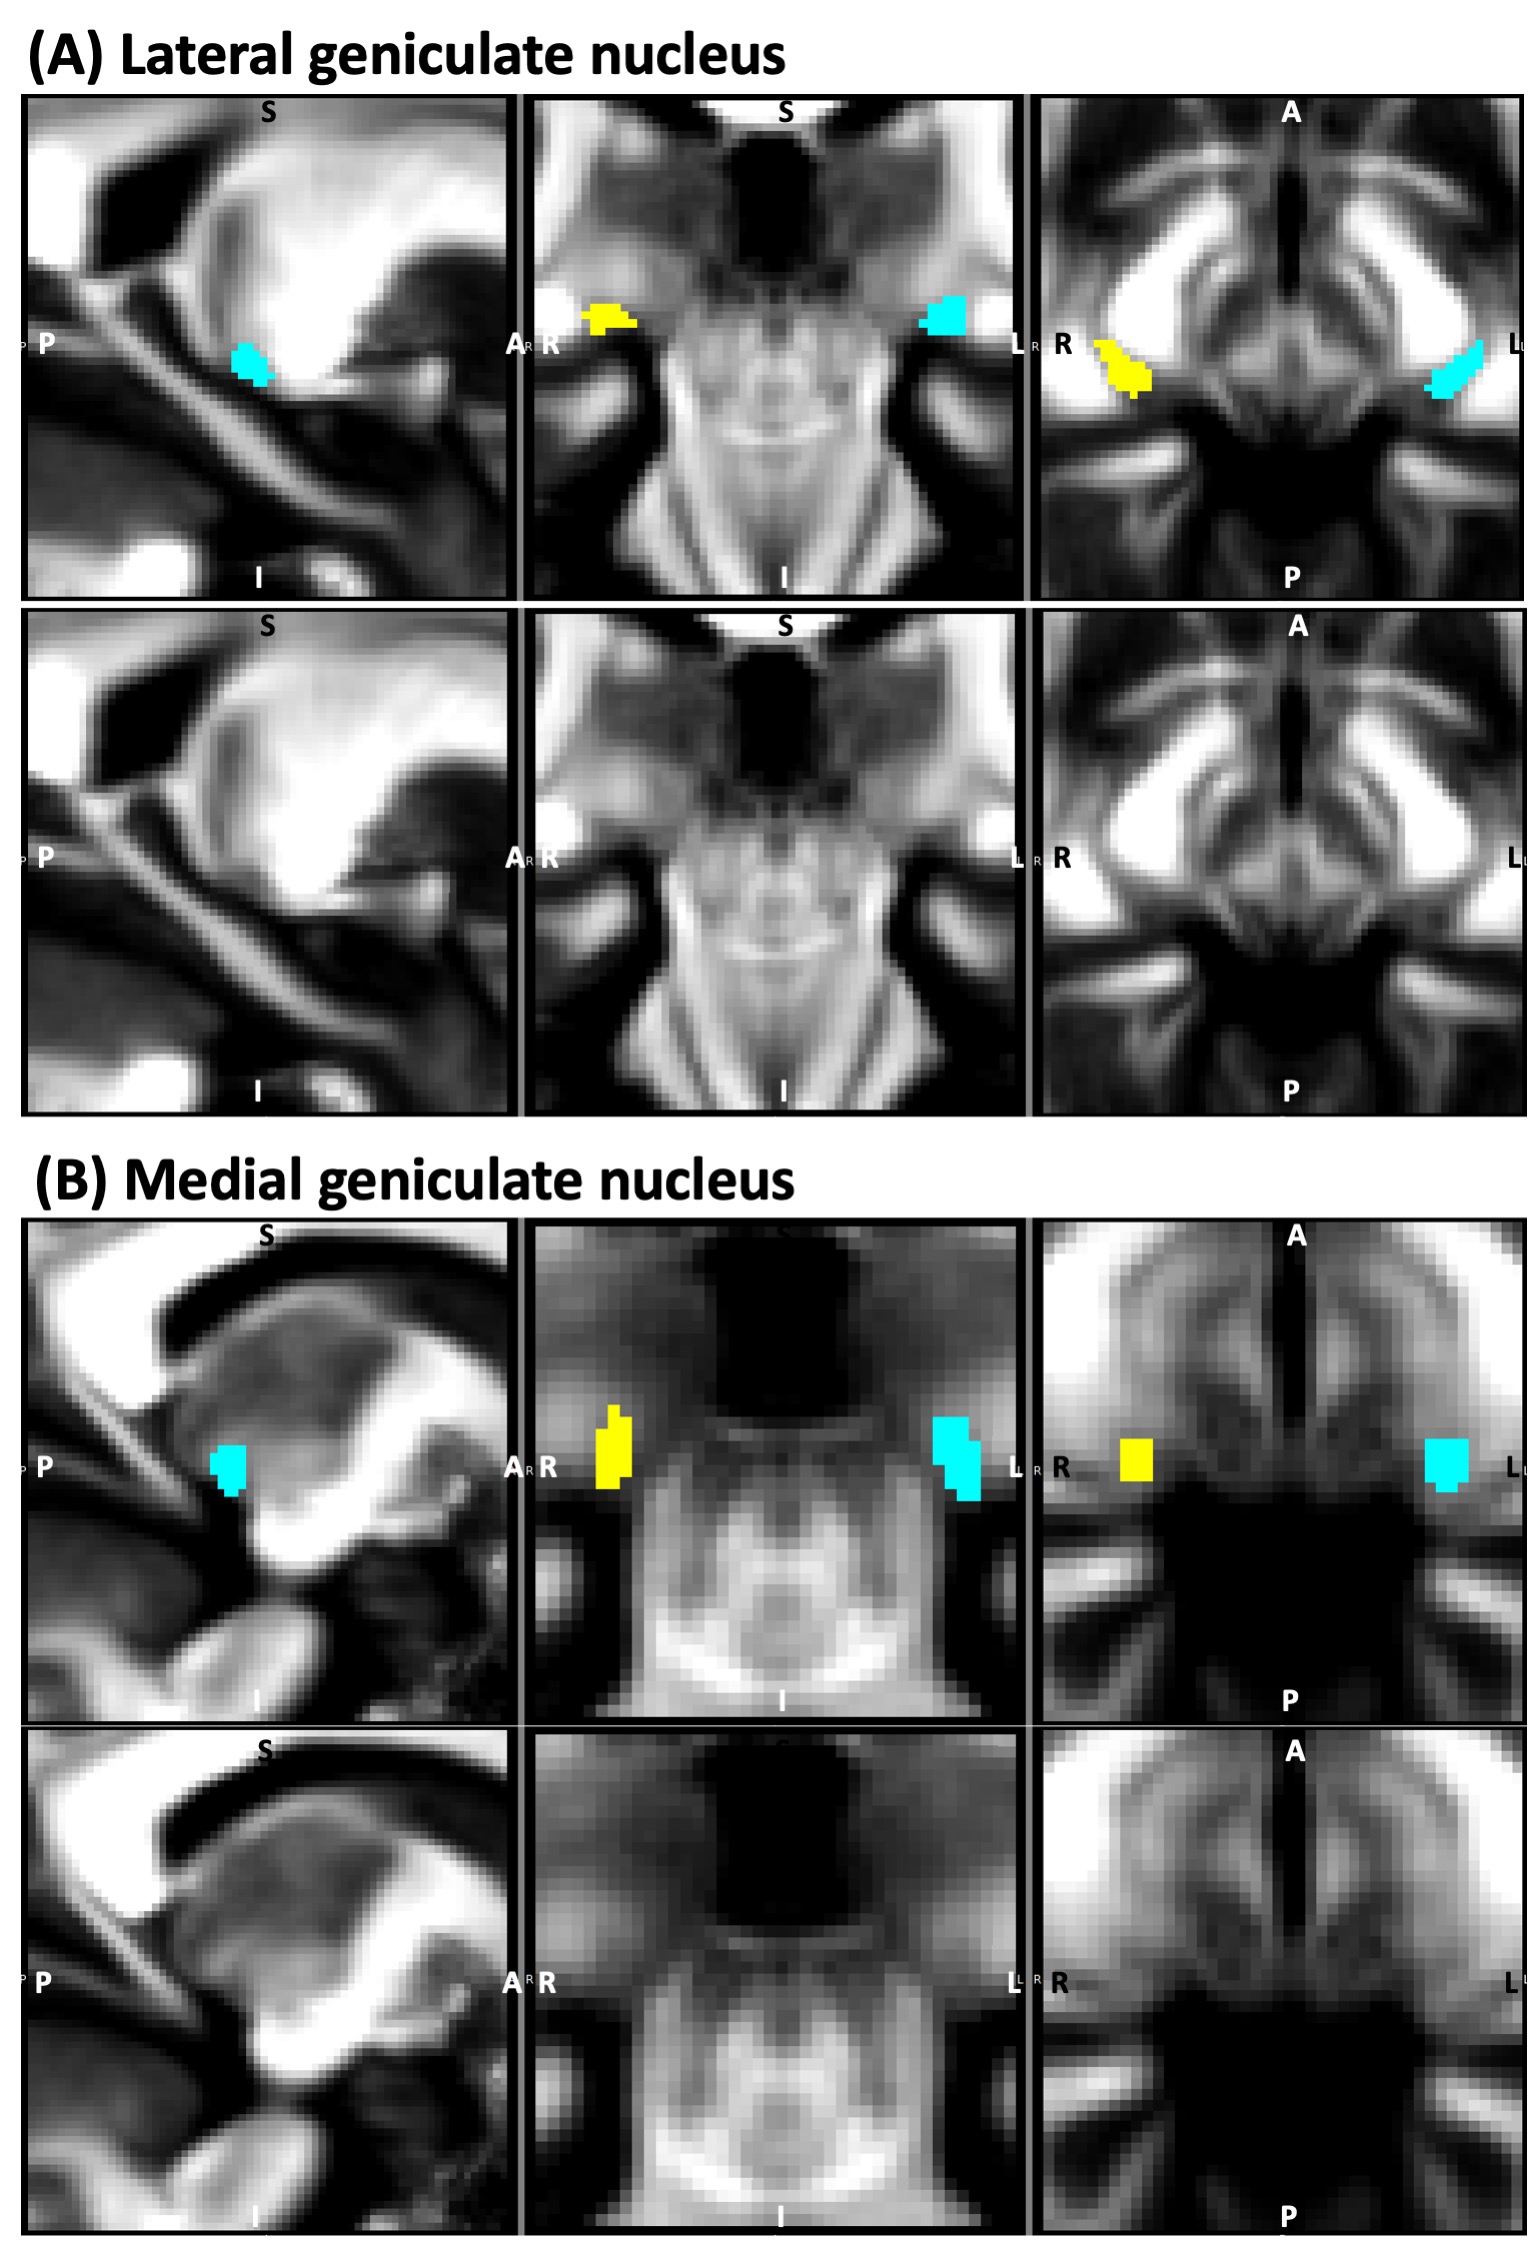
Figure 2: Atlas labels9 of (A) lateral geniculate nucleus (LG) and (B) medial geniculate nucleus (MG) –top row– overlaid on underlying fractional anisotropy (FA) map (sagittal, coronal and axial views; probabilistic atlas labels thresholded at 35 %). The latter is also shown without the atlas labels in the bottom row. The right-side nucleus is shown in yellow, and the left-side nucleus in cyan.
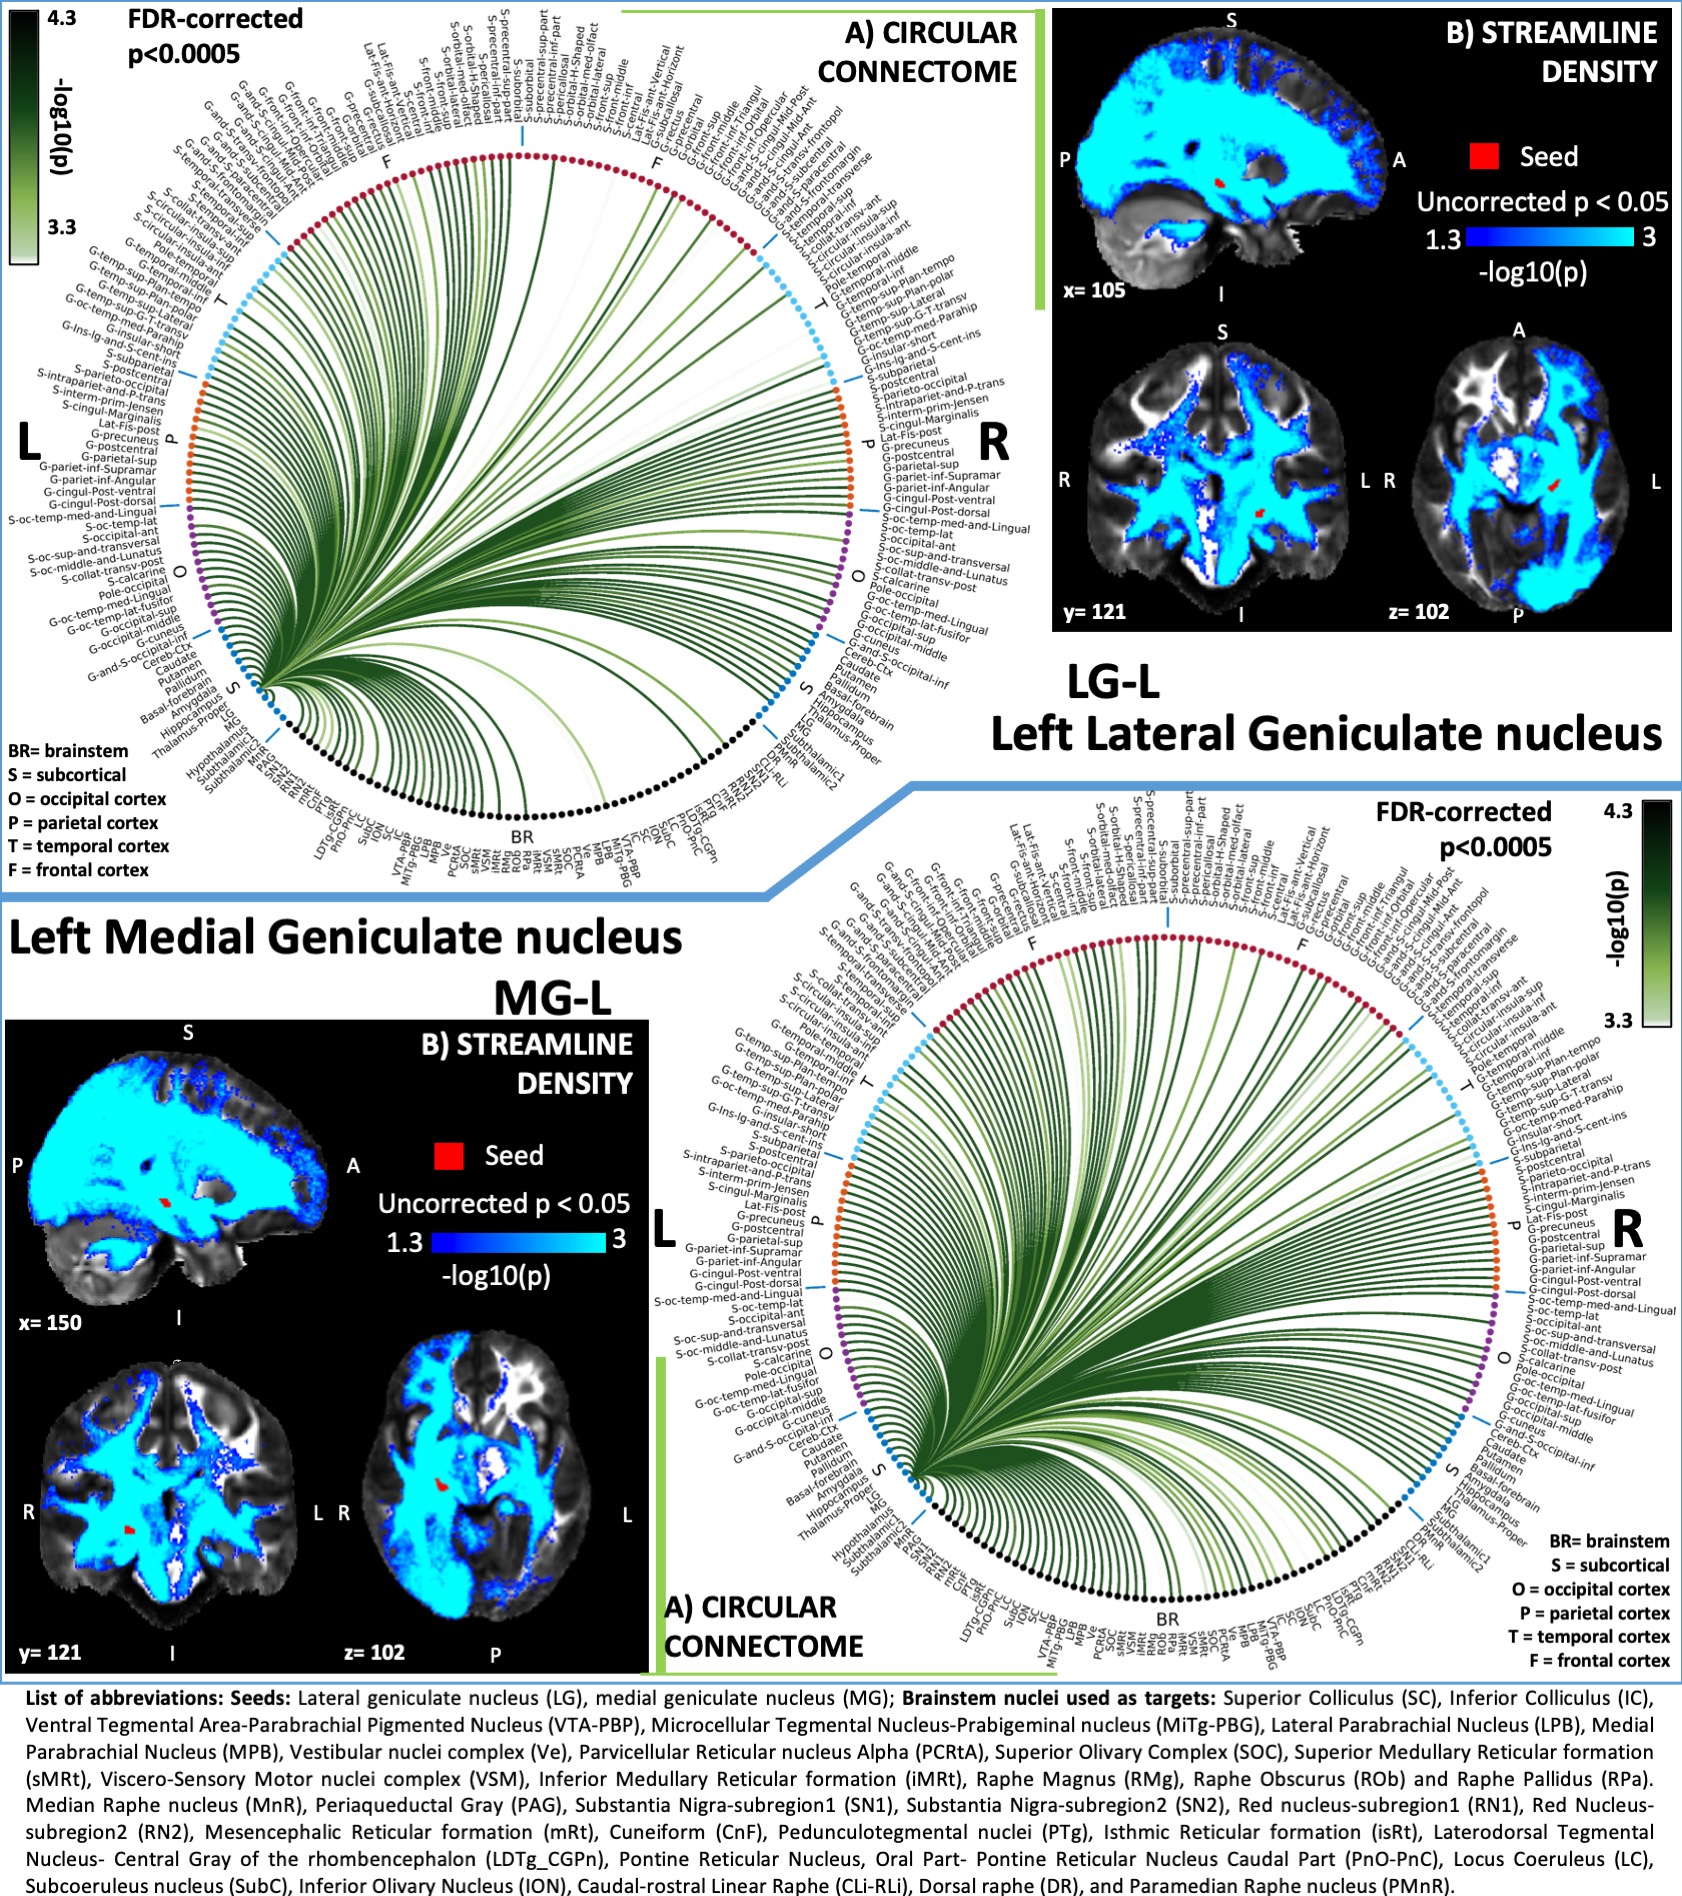
Figure 3: A) Region-based 2D structural connectome and B) Voxel-based streamline density map of left lateral geniculate nucleus – LG (top) and left medial geniculate nucleus – MG (bottom). Specifically, in A) we show the -log10(p-value) of the Wilcoxon test, thresholded at p < 0.0005 false-discovery-rate (FDR) corrected for multiple comparisons. In B) we show the -log10(p-value) of the Wilcoxon test thresholded, for display purposes, at p < 0.05; seeds are shown in red and streamlines are shown in blue-light blue.
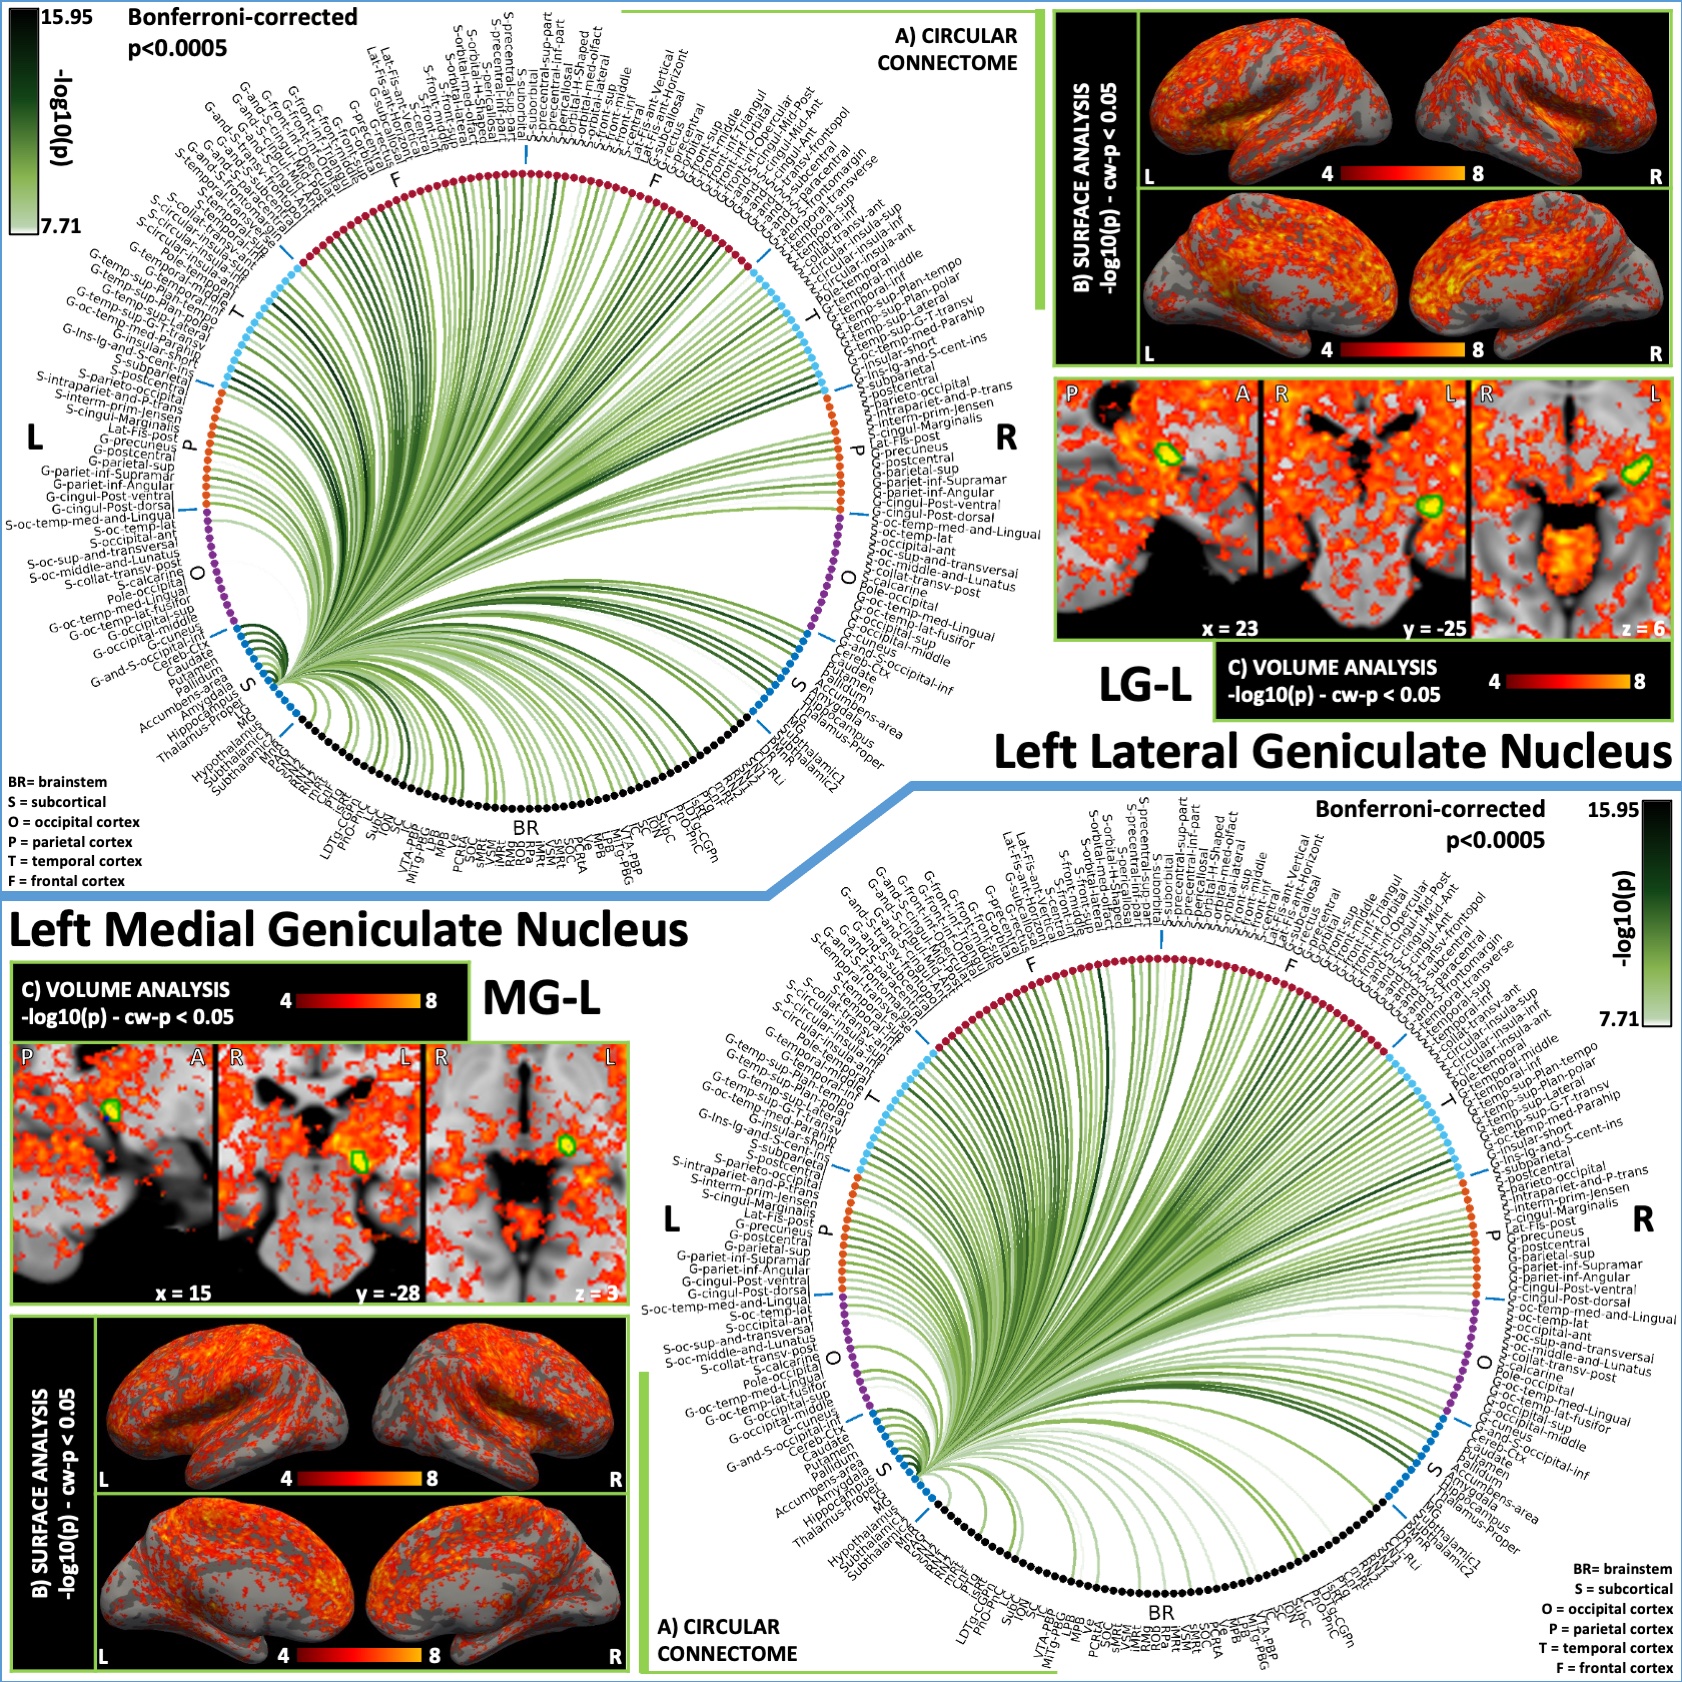
Figure 4: Functional connectivity results of left lateral geniculate nucleus – LG (top) and left medial geniculate nucleus – MG (bottom). (A) Region-based functional connectome; (B) Voxel-based cortical connectivity maps displayed on two lateral and two medial surface views; (C) Voxel-based subcortical connectivity maps, three views and MNI coordinates. The seed contour is shown in green. Refer to Figure 3 for list of abbreviations.
DOI: https://doi.org/10.58530/2022/4762