4761
Quantitative anisotropy-based fiber tractography reveals tracts moderating age-related decline in functional fitness1Beckman Institute for Advanced Science & Technology, University of Illinois at Urbana-Champaign, Urbana, IL, United States, 2Neuroscience Program, University of Illinois at Urbana-Champaign, Urbana, IL, United States, 3Interdisciplinary Health Sciences Institute, University of Illinois at Urbana Champaign, Urbana, IL, United States, 4Carle-Illinois Advanced Imaging Center, University of Illinois at Urbana-Champaign, Urbana, IL, United States, 5Bioengineering, University of Illinois at Urbana-Champaign, Urbana, IL, United States, 6Kinesiology & Community Health, University of Illinois at Urbana-Champaign, Urbana, IL, United States, 7Institute of Gerontology, Wayne State University, Detroit, MI, United States, 8Psychology, Wayne State University, Detroit, MI, United States
Synopsis
We present a moderation analysis of the effects of edge strengths from generalized q-sampling imaging-based tractography on the relationship between age and decline in functional fitness in older adults (n = 105, ages 55-79 years old, right-handed). The results of these moderation analyses suggest that the strengths of white matter structural connections involving the cerebellum, cingulum, and other areas involved in motor, sensory, and environmental perception may play a significant role in preserving functional fitness in older adults.
Introduction
White matter integrity in the brain is believed to decrease as damage to myelin sheaths accumulates with age in older adults 1–3. These alterations of white matter microstructure have been correlated with motor function decline 4, 5. Previous studies have explored these changes using traditional methods of analysis for magnetic resonance imaging (MRI) diffusion-weighted imaging (DWI), showing age-related differences in metrics obtained from diffusion tensor imaging (DTI) and DTI-based structural connectivity 3, 6-8. These methods are notably limited by modeling based on a unimodal gaussian distribution within each tensor 9. Generalized q-sampling imaging (GQI) 10, 11 processing has shown better resolution of the crossing-fibers problem 12 and more conservative estimates for tractography, resulting in less false-positive tracts than DTI-based methods 10, 11. We present a moderation analysis of the effects of GQI-based tract strengths on the relationship between age and functional fitness 10–12.Methods
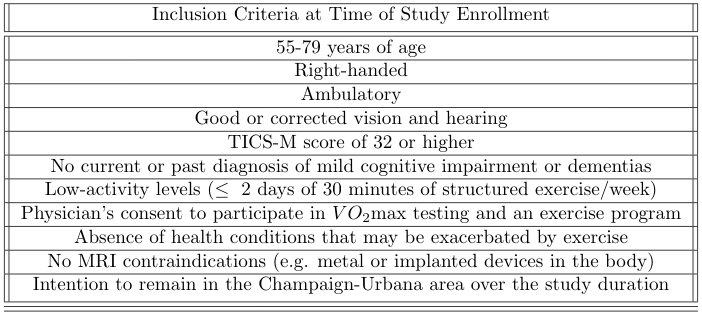
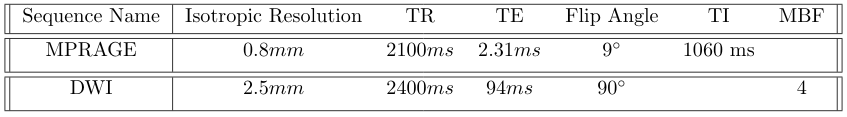
This cross-sectional data is part of an ongoing larger longitudinal study at the Exercise Psychology Laboratory of the University of Illinois at Urbana-Champaign for which all methods were approved by the local independent review board and participants were recruited (see Table 1). As part of baseline testing, participants completed a timed upward and downward stair climbing tests as a measure of fitness and functional mobility 13. MRI data (see Table 2) was collected using a Siemens 3T Prisma system (Siemens Healthineers AG, Erlangen, Germany) at the Biomedical Imaging Center of the Beckman Institute for Advanced Science & Technology.Preprocessing and diffusion reconstruction were performed using QSIPrep 0.14.3, which is based on Nipype1.6.1 14, 15, Nilearn0.8.1 16, and Dipy 17. Anatomical preprocessing followed the standard FAST QSIPrep workflow (see full details at https://qsiprep.readthedocs.io/en/latest/preprocessing.html#preprocessing-pipeline-details) 18–20. Diffusion preprocessing included MP-PCA denoising 21 with a 5-voxel window, B1 field inhomogeneity correction with the N4 algorithm 18, and DWI series mean intensity adjustment to match the mean intensity of the b=0 images matched across each separate DWI scanning sequence, head motion and Eddy current correction with FSL v6.0.3:b862cdd5 Eddy 22, 23, fieldmap-based susceptibility distortion correction similar to that described in TOPUP 24, and final interpolation using the jac method. The DWI time-series were resampled to ACPC, generating a preprocessed DWI run in ACPC space with 2mm isotropic voxel size.
Tractography was performed using diffusion orientation distribution functions (ODFs) reconstructed via generalized q-sampling imaging (GQI, 10) with a ratio of mean diffusion distance of 1.250.
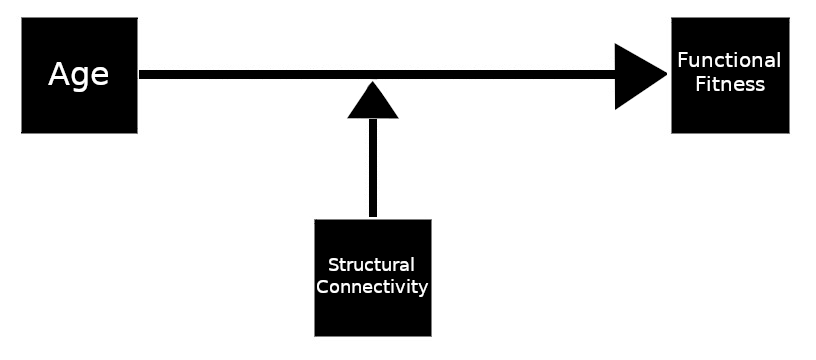
The relationship between age and time to complete the upwards or downwards stair climbing tests was determined using Pearson’s r correlation in SciPy 25. Using the PROCESS module model 1 26, moderation analyses were performed for effect of the strength of GQI-derived normalized fiber count for connections between regions defined by the AAL116 atlas 27 on the relationship between age and time to complete the upwards and downwards stair walking test (see Figure 1 for a visualization of the model). Moderation effects were rejected if the p−value was greater than 0.0005 for the age-connection strength interaction term of the model; further restricting for multiple comparisons by considering only connections for which the size of age effect on test time had magnitude greater than 0.2 (small) and significant difference between levels.
Results
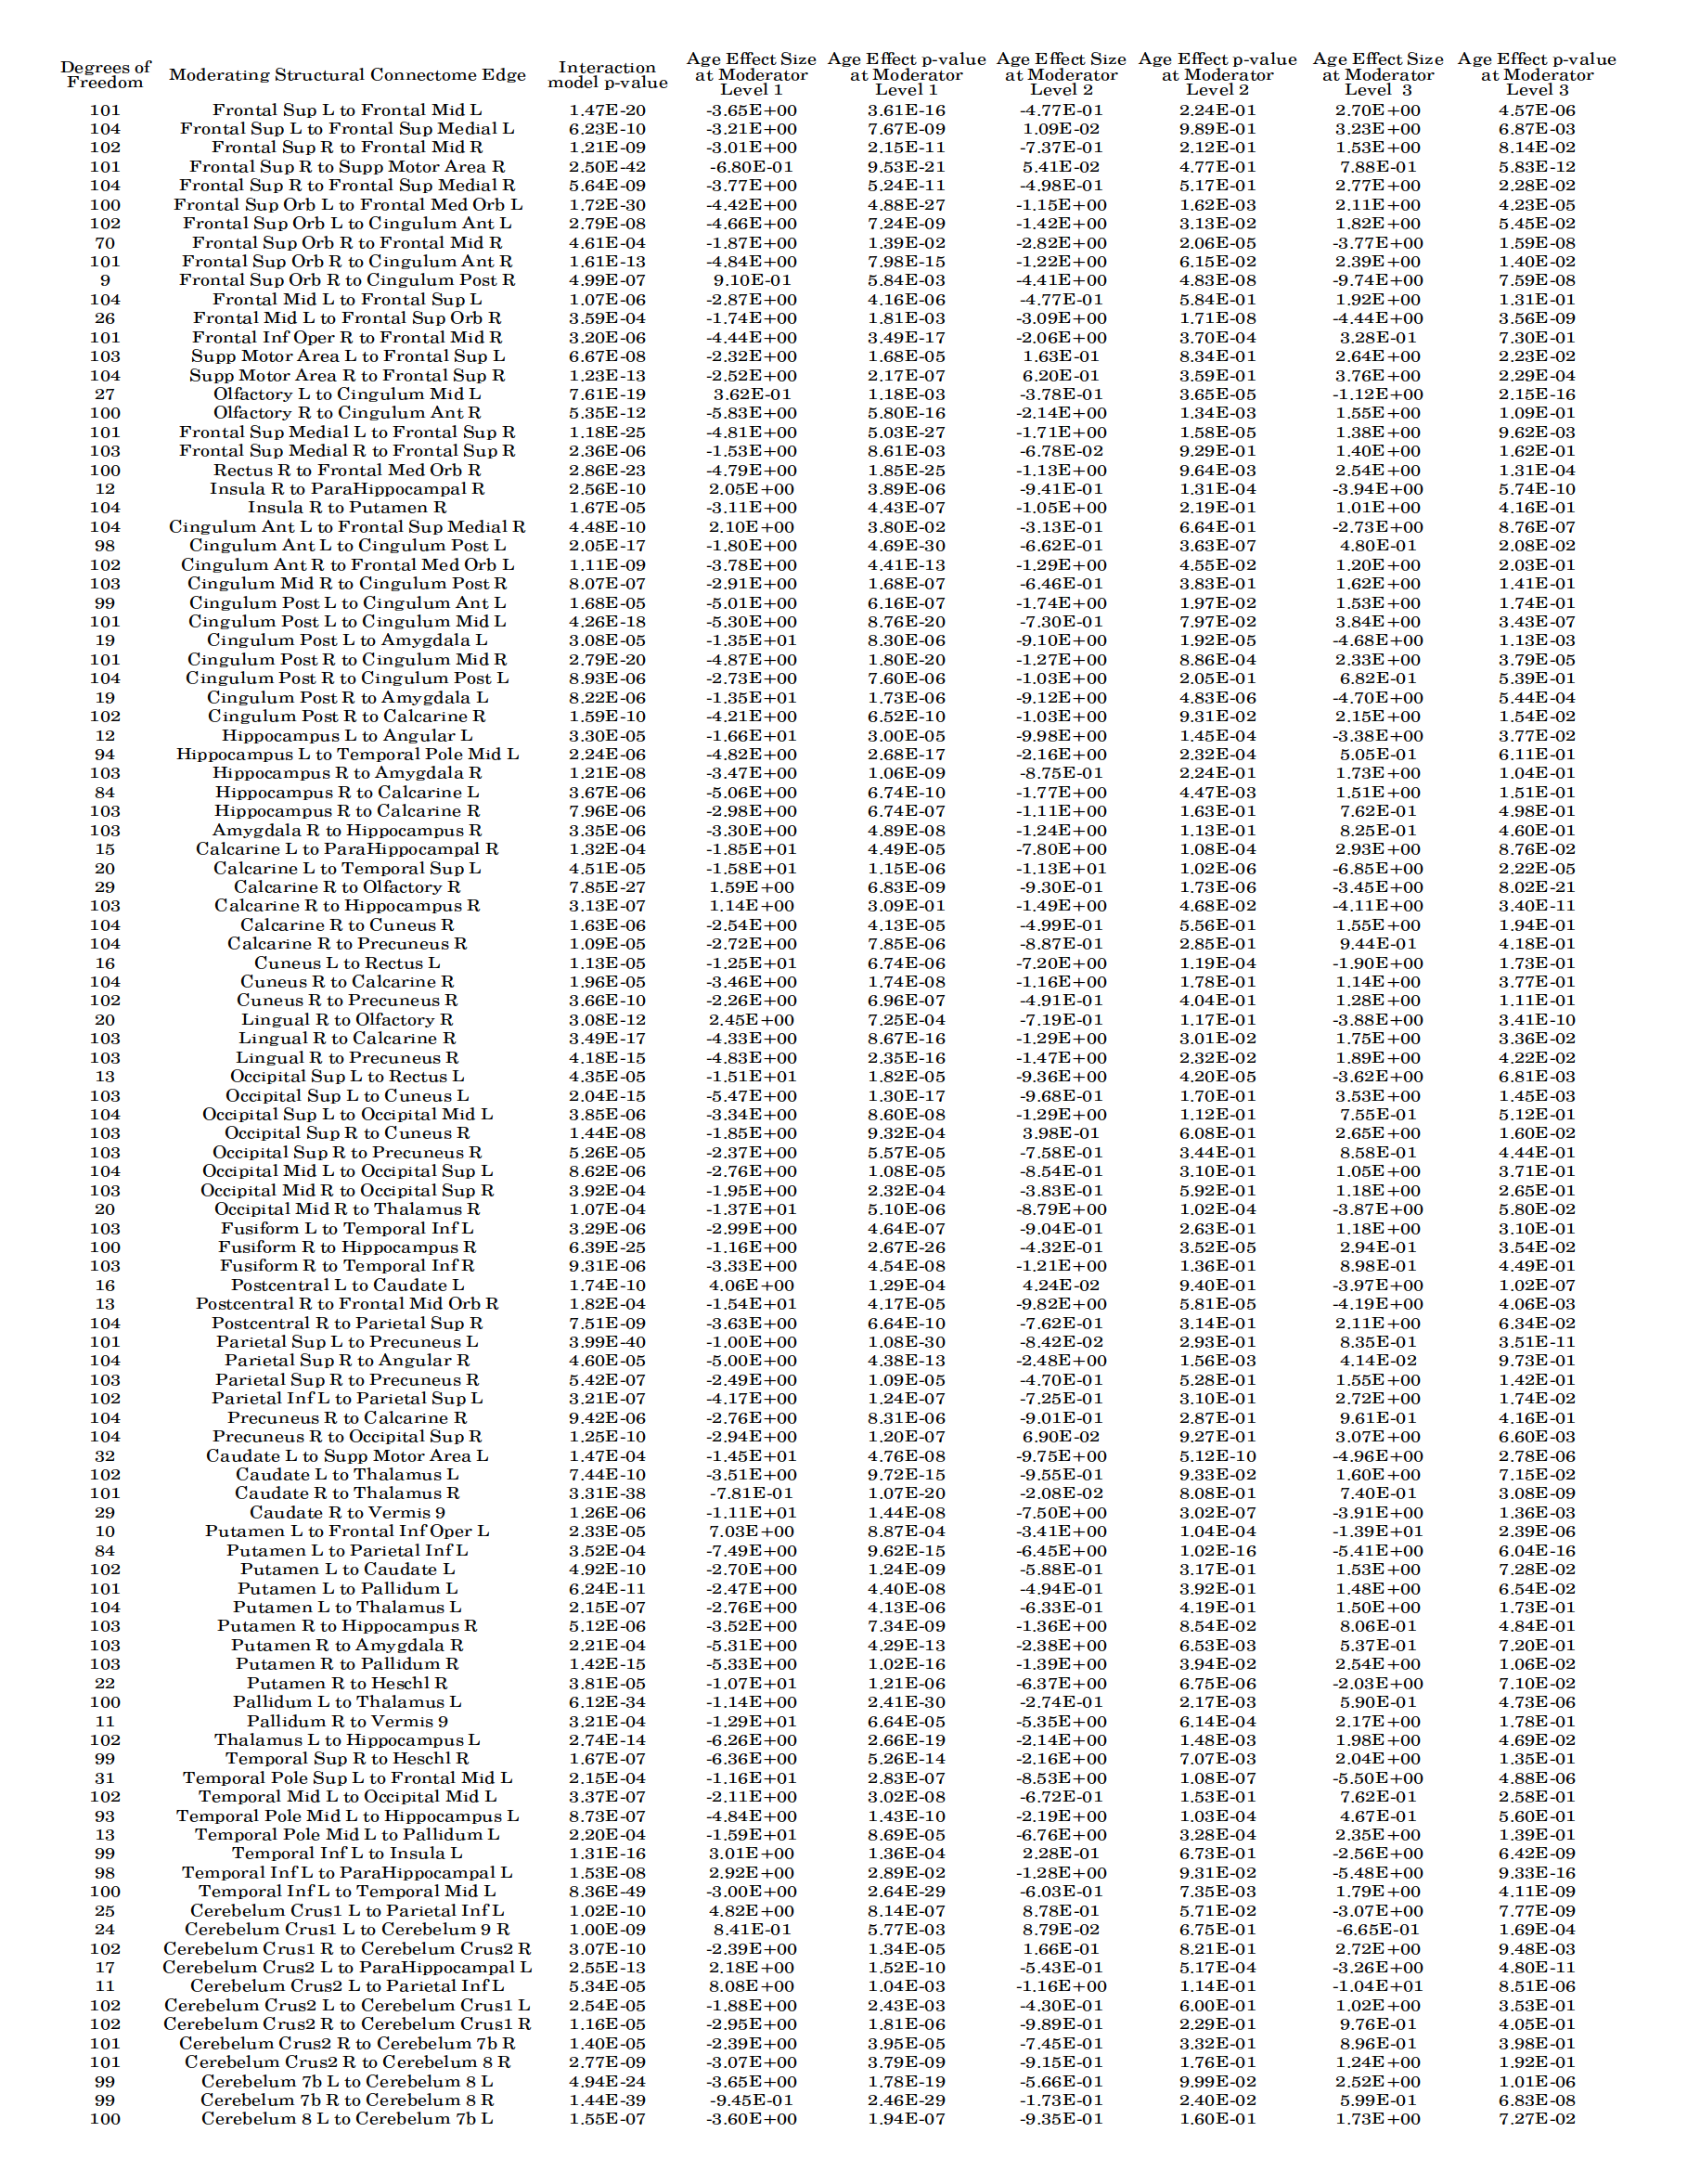
For the n = 105 participants (age: µ +/- σ = 64+/-6, 77 female), only the time to walking down a flight of stairs showed significant correlation with age (r = -0.5999, p-value = 1.3531E-11). Significant moderation on the effect of age on time to climb down a set of stairs was found for the strengths of 17 edges involving the cerebellum, 39 ipsilateral left edges, 46 ipsilateral right edges, and 8 contralateral edges (see Table 3 and Figure 2).Discussion
The high number of connections within and to the cerebellum for which the normalized fiber count showed a significantly moderated the effect of age on time to climb down a flight of stairs suggest a significant role of the cerebellum in coordination 29 for functional fitness. Similarly, connectivity within the cingulum and to other regions may be particularly important in moderating the relationship between age and coordination-demanding downward stair climbing due to the importance of the cingulum in visuospatial cognition 30 and executive control 31.Significant moderating edges also included areas associated with visual function (calcarine fissure 31, 32, cuneus 32, middle temporal gyrus 33), environmental perception and spatial awareness (precuneus 32, inferior temporal gyrus 34, 35, angular gyrus 36), motor control (putamen 37, 38, pallidum 39, thalamus 40), and sensory and motor areas (insula 41, orbital superior frontal gyrus 32, 42, 43, middle frontal gyrus 32, superior parietal gyrus 44).
Tractography based on the model-free quantitative anisotropy peak estimates produced by GQI-based reconstruction may have produced less false positive tracts 11 and better tracking in crossing fiber regions 12. This difference in density may account for some connections being detected only in a subset of participants, which limited the number of degrees of freedom for moderation analyses.
Conclusion
The results of these moderation analyses suggest that the strengths of white matter structural connections involving the cerebellum, cingulum, and other areas involved in motor, sensory, and environmental perception play a significant role in preserving functional fitness in older adults.Acknowledgements
The data used in this comparison was collected as part of a multi-arm clinical trial (Yoga, Aerobic and Stretching Exercise Effects on Neurocognition -NCT04323163) funded by the National Institute of Aging (NIA Grant AG066630) and led by principal investigator Neha P Gothe. We extend our gratitude to the NIA, members of the research staff, and all participants in the study.References
1. T. W. Chapman and R. A. Hill, “Myelin plasticity in adulthood and aging,”Neuroscience Letters, vol. 715, p. 134645,2020. [Online]. Available: https://www.sciencedirect.com/science/article/pii/S0304394019307487
2. I. Bennett and D. Madden, “Disconnected aging: Cerebral white matter integrity and age-related differences in cognition, ”Neuroscience, vol. 276, pp. 187–205, 2014, secrets of the CNS White Matter. [Online]. Available: https://www.sciencedirect.com/science/article/pii/S0306452213009731
3. P. Kochunov, D. Williamson, J. Lancaster, P. Fox, J. Cornell, J. Blangero, and D. Glahn, “Fractional anisotropy ofwater diffusion in cerebral white matter across the lifespan,”Neurobiology of Aging, vol. 33, no. 1, pp. 9–20, 2012.[Online]. Available: https://www.sciencedirect.com/science/article/pii/S0197458010000448
4. S. M. Bruijn, A. Van Impe, J. Duysens, and S. P. Swinnen, “White matter microstructural organization and gait stability in older adults,” Frontiers in Aging Neuroscience, vol. 6, p. 104, 2014. [Online]. Available: https://www.frontiersin.org/article/10.3389/fnagi.2014.00104
5. J. Oschwald,S. M ́erillat,L. J ̈ancke,and R. D. Seidler,“Fractional anisotropy in selected,motor-related white matter tracts and its cross-sectional and longitudinal associations with motor function in healthy older adults,” Frontiers in Human Neuroscience,vol. 15,p. 278,2021. [Online]. Available: https://www.frontiersin.org/article/10.3389/fnhum.2021.621263
6. A. Tsang, C. A. Lebel, S. L. Bray, B. G. Goodyear, M. Hafeez, R. C. Sotero, C. R. McCreary, and R. Frayne, “White matter structural connectivity is not correlated to cortical resting-state functional connectivityover the healthy adult lifespan,” Frontiers in Aging Neuroscience, vol. 9, p. 144, 2017. [Online]. Available: https://www.frontiersin.org/article/10.3389/fnagi.2017.00144
7. S. Hirsiger, V. Koppelmans, S. Merillat, F. Liem, B. Erdeniz, R. D. Seidler, and L. Jancke, “Structural and functional connectivity in healthy aging: Associations for cognition and motor behavior,” Human Brain Mapping, vol. 37, no. 3,pp. 855–867, 2016. [Online]. Available: https://onlinelibrary.wiley.com/doi/abs/10.1002/hbm.23067
8. S. Michielse, N. Coupland, R. Camicioli, R. Carter, P. Seres, J. Sabino, and N. Malykhin, “Selective effects of aging on brain white matter microstructure: A diffusion tensor imaging tractography study,” NeuroImage, vol. 52, no. 4, pp.1190–1201, 2010. [Online]. Available: https://www.sciencedirect.com/science/article/pii/S1053811910007263
9. M. R. Wiegell, H. B. W. Larsson, and V. J. Wedeen, “Fiber crossing in human brain depicted with diffusion tensor mr imaging,”Radiology, vol. 217, no. 3, pp. 897–903, 2000, pMID: 11110960. [Online]. Available: https://doi.org/10.1148/radiology.217.3.r00nv43897
10. F.-C. Yeh, V. J. Wedeen, and W.-Y. I. Tseng, “Generalized q-sampling imaging,” IEEE transactions on medical imaging,vol. 29, no. 9, pp. 1626–1635, 2010.
11. F.-C. Yeh, T. D. Verstynen, Y. Wang, J. C. Fernandez-Miranda, and W.-Y. I. Tseng, “Deterministic diffusion fiber tracking improved by quantitative anisotropy,” PLOS ONE, vol. 8, no. 11, p. null, 11 2013. [Online]. Available: https://doi.org/10.1371/journal.pone.0080713
12. Z. Jin, Y. Bao, Y. Wang, Z. Li, X. Zheng, S. Long, and Y. Wang, “Differences between generalized q-sampling imaging and diffusion tensor imaging in visualization of crossing neural fibers in the brain,” Surgical and radiologic anatomy: SRA, vol. 41, no. 9, p. 1019—1028, September 2019. [Online]. Available: https://europepmc.org/articles/PMC6694094
13. N. P. Gothe, J. Fanning, E. Awick, D. Chung, T. R. Wojcicki, E. A. Olson, S. P. Mullen, M. Voss, K. I. Erickson, A. F. Kramer, and E. McAuley, “Executive function processes predict mobility outcomes in older adults,”Journal of the American Geriatrics Society, vol. 62, no. 2, pp. 285–290, 2014. [Online]. Available: https://agsjournals.onlinelibrary.wiley.com/doi/abs/10.1111/jgs.12654
14. K. Gorgolewski, C. D. Burns, C. Madison, D. Clark, Y. O. Halchenko, M. L. Waskom, and S. Ghosh, “Nipype: a flexible, lightweight and extensible neuroimaging data processing framework in python,” Frontiers in Neuroinformatics, vol. 5,p. 13, 2011.
15. K. J. Gorgolewski, O. Esteban, C. J. Markiewicz, E. Ziegler, D. G. Ellis, M. P. Notter, D. Jarecka, H. Johnson,C. Burns, A. Manh ̃aes-Savio, C. Hamalainen, B. Yvernault, T. Salo, K. Jordan, M. Goncalves, M. Waskom, D. Clark,J. Wong, F. Loney, M. Modat, B. E. Dewey, C. Madison, M. Visconti di Oleggio Castello, M. G. Clark, M. Dayan, D. Clark, A. Keshavan, B. Pinsard, A. Gramfort, S. Berleant, D. M. Nielson, S. Bougacha, G. Varoquaux, B. Cipollini,R. Markello, A. Rokem, B. Moloney, Y. O. Halchenko, D. Wassermann, M. Hanke, C. Horea, J. Kaczmarzyk, G. de Hol-lander, E. DuPre, A. Gillman, D. Mordom, C. Buchanan, R. Tungaraza, W. M. Pauli, S. Iqbal, S. Sikka, M. Mancini, Y. Schwartz, I. B. Malone, M. Dubois, C. Frohlich, D. Welch, J. Forbes, J. Kent, A. Watanabe, C. Cumba, J. M.Huntenburg, E. Kastman, B. N. Nichols, A. Eshaghi, D. Ginsburg, A. Schaefer, B. Acland, S. Giavasis, J. Kleesiek, D. Erickson, R. Kuttner, C. Haselgrove, C. Correa, A. Ghayoor, F. Liem, J. Millman, D. Haehn, J. Lai, D. Zhou , R. Blair, T. Glatard, M. Renfro, S. Liu, A. E. Kahn, F. Perez-Garcıa, W. Triplett, L. Lampe, J. Stadler, X.-Z. Kong, M. Hallquist, A. Chetverikov, J. Salvatore, A. Park, R. Poldrack, R. C. Craddock, S. Inati, O. Hinds, G. Cooper, L. N.Perkins, A. Marina, A. Mattfeld, M. Noel, L. Snoek, K. Matsubara, B. Cheung, S. Rothmei, S. Urchs, J. Durnez, F. Mertz, D. Geisler, A. Floren, S. Gerhard, P. Sharp, M. Molina-Romero, A. Weinstein, W. Broderick, V. Saase,S. K. Andberg, R. Harms, K. Schlamp, J. Arias, D. Papadopoulos Orfanos, C. Tarbert, A. Tambini, A. De La Vega, T. Nickson, M. Brett, M. Falkiewicz, K. Podranski, J. Linkersdorfer, G. Flandin, E. Ort, D. Shachnev, D. McNamee, A. Davison, J. Varada, I. Schwabacher, J. Pellman, M. Perez-Guevara, R. Khanuja, N. Pannetier, C. McDermottroe, and S. Ghosh, “Nipype,” Software, 2018.
16. A. Abraham, F. Pedregosa, M. Eickenberg, P. Gervais, A. Mueller, J. Kossaifi, A. Gramfort, B. Thirion, and G. Varoquaux, “Machine learning for neuroimaging with scikit-learn,” Frontiers in Neuroinformatics, vol. 8, 2014. [Online]. Available: https://www.frontiersin.org/articles/10.3389/fninf.2014.00014/full
17. E. Garyfallidis, M. Brett, B. Amirbekian, A. Rokem, S. Van Der Walt, M. Descoteaux, and I. Nimmo-Smith, “Dipy, a library for the analysis of diffusion mri data,” Frontiers in neuroinformatics, vol. 8, p. 8, 2014.
18. N. J. Tustison, B. B. Avants, P. A. Cook, Y. Zheng, A. Egan, P. A. Yushkevich, and J. C. Gee, “N4itk: Improved n3bias correction,” IEEE Transactions on Medical Imaging, vol. 29, no. 6, pp. 1310–1320, 2010.
19. B. Avants, C. Epstein, M. Grossman, and J. Gee, “Symmetric diffeomorphic image registration with cross-correlation: Evaluating automated labeling of elderly and neurodegenerative brain,” Medical Image Analysis, vol. 12, no. 1, pp.26–41, 2008. [Online]. Available: http://www.sciencedirect.com/science/article/pii/S1361841507000606
20. Y. Zhang, M. Brady, and S. Smith, “Segmentation of brain MR images through a hidden markov random field modeland the expectation-maximization algorithm,” IEEE Transactions on Medical Imaging, vol. 20, no. 1, pp. 45–57, 2001.
21. J. Veraart, D. S. Novikov, D. Christiaens, B. Ades-Aron, J. Sijbers, and E. Fieremans, “Denoising of diffusion mri usingrandom matrix theory,” NeuroImage, vol. 142, pp. 394–406, 2016.
22. J. L. Andersson and S. N. Sotiropoulos, “An integrated approach to correction for off-resonance effects and subject movement in diffusion mr imaging,” Neuroimage, vol. 125, pp. 1063–1078, 2016.
23. J. L. Andersson, M. S. Graham, E. Zsoldos, and S. N. Sotiropoulos, “Incorporating outlier detection and replacement into a non-parametric framework for movement and distortion correction of diffusion mr images,” Neuroimage, vol. 141, pp. 556–572, 2016.
24. J. L. Andersson, S. Skare, and J. Ashburner, “How to correct susceptibility distortions in spin-echo echo-planar images: application to diffusion tensor imaging,” Neuroimage, vol. 20, no. 2, pp. 870–888, 2003.
25. P. Virtanen, R. Gommers, T. E. Oliphant, M. Haberland, T. Reddy, D. Cournapeau, E. Burovski, P. Peterson, W. Weckesser, J. Bright, S. J. van der Walt, M. Brett, J. Wilson, K. J. Millman, N. Mayorov, A. R. J. Nelson, E. Jones, R. Kern, E. Larson, C. J. Carey, ̇I. Polat, Y. Feng, E. W. Moore, J. VanderPlas, D. Laxalde, J. Perktold, R. Cimrman, I. Henriksen, E. A. Quintero, C. R. Harris, A. M. Archibald, A. H. Ribeiro, F. Pedregosa, P. van Mulbregt, and SciPy 1.0 Contributors, “SciPy 1.0: Fundamental Algorithms for Scientific Computing in Python,” Nature Methods, vol. 17, pp. 261–272, 2020.
26. A. Hayes, "Introduction to Mediation, Moderation, and Conditional Process Analysis, Second Edition: A Regression-Based Approach", ser. Methodology in the Social Sciences. Guilford Publications, 2017. [Online]. Available:https://books.google.com/books?id=8ZM6DwAAQBAJ
27. N. Tzourio-Mazoyer, B. Landeau, D. Papathanassiou, F. Crivello, O. Etard, N. Delcroix, B. Mazoyer, and M. Joliot, “Automated anatomical labeling of activations in spm using a macroscopic anatomical parcellation of the mni mrisingle-subject brain,” Neuroimage, vol. 15, no. 1, pp. 273–289, 2002.
28. M. A. Statton, A. Vazquez, S. M. Morton, E. V. Vasudevan, and A. J. Bastian, “Making sense of cerebellar contributions to perceptual and motor adaptation, ”The Cerebellum, vol. 17, no. 2, pp. 111–121, 2018.
29. C. Metzler-Baddeley, D. K. Jones, J. Steventon, L. Westacott, J. P. Aggleton, and M. J. O’Sullivan, “Cingulum microstructure predicts cognitive control in older age and mild cognitive impairment,” Journal of Neuroscience, vol. 32, no. 49, pp. 17 612–17 619, 2012.4
30. E. J. Bubb, C. Metzler-Baddeley, and J. P. Aggleton, “The cingulum bundle: Anatomy, function, and dysfunction, ”Neuroscience Biobehavioral Reviews, vol. 92, pp. 104–127, 2018. [Online]. Available: https://www.sciencedirect.com/science/article/pii/S0149763418300198
31. D. H. Hubel, “Exploration of the primary visual cortex, 1955–78,” Nature, vol. 299, pp. 515–524, 1982.
32. P. Johns, “Chapter 3 - functional neuroanatomy,” in Clinical Neuroscience, P. Johns, Ed. Churchill Livingstone, 2014, pp. 27–47. [Online]. Available: https://www.sciencedirect.com/science/article/pii/B9780443103216000035
33. C. Lopez, “Vestibular cortex,” in Brain Mapping, A. W. Toga, Ed. Waltham: Academic Press, 2015, pp. 305–312. [Online]. Available: https://www.sciencedirect.com/science/article/pii/B978012397025100227X
34. M. Spiridon, B. Fischl, and N. Kanwisher, “Location and spatial profile of category-specific regions in human extrastriate cortex,” Human Brain Mapping, vol. 27, no. 1, pp. 77–89, 2006. [Online]. Available: https://onlinelibrary.wiley.com/doi/abs/10.1002/hbm.20169
35. K. Denys, W. Vanduffel, D. Fize, K. Nelissen, H. Peuskens, D. Van Essen, and G. A. Orban, “The processing of visual shape in the cerebral cortex of human and nonhuman primates: A functional magneticresonance imaging study,” Journal of Neuroscience, vol. 24, no. 10, pp. 2551–2565, 2004. [Online]. Available: https://www.jneurosci.org/content/24/10/2551
36. M. L. Seghier, “The angular gyrus: Multiple functions and multiple subdivisions,” The Neuroscientist, vol. 19, no. 1,pp. 43–61, 2013, pMID: 22547530. [Online]. Available: https://doi.org/10.1177/1073858412440596
37. M. R. Delong, A. P. Georgopoulos, M. D. Crutcher, S. J. Mitchell, R. T. Richardson, and G. E. Alexander, "Functional Organization of the Basal Ganglia: Contributions of Single-Cell Recording Studies." John Wiley Sons, Ltd, 1984, ch. 5,pp. 64–82. [Online]. Available: https://onlinelibrary.wiley.com/doi/abs/10.1002/9780470720882.ch5
38. W. R. Marchand, J. N. Lee, J. W. Thatcher, E. W. Hsu, E. Rashkin, Y. Suchy, G. Chelune, J. Starr, and S. S. Barbera, “Putamen coactivation during motor task execution,” Neuroreport, vol. 19, no. 9, pp. 957–960, 2008.
39. M. Gillies, J. Hyam, A. Weiss, C. Antoniades, R. Bogacz, J. Fitzgerald, T. Aziz, M. A. Whittington, and A. L. Green, “The cognitive role of the globus pallidus interna; insights from disease states,” Experimental brain research, vol. 235,no. 5, p. 1455, 2017.
40. E. V. Evarts and W. T. Thach, “Motor mechanisms of the cns:Cerebrocerebellar interrelations,”Annual Review of Physiology, vol. 31, no. 1, pp. 451–498, 1969, pMID: 4885774. [Online]. Available:https://doi.org/10.1146/annurev.ph.31.030169.002315
41. L. Q. Uddin, J. S. Nomi, B. H ́ebert-Seropian, J. Ghaziri, and O. Boucher, “Structure and function of the human insula,” Journal of clinical neurophysiology: official publication of the American Electroencephalographic Society, vol. 34, no. 4,p. 300, 2017.
42. I. I. Goldberg, M. Harel, and R. Malach, “When the brain loses its self: prefrontal inactivation during sensorimotorprocessing, ”Neuron, vol. 50, no. 2, pp. 329–339, 2006.
43. A. E. Cavanna and M. R. Trimble, “The precuneus: a review of its functional anatomy and behavioural correlates,” Brain, vol. 129, no. 3, pp. 564–583, 01 2006. [Online]. Available: https://doi.org/10.1093/brain/awl004
44. S. Caspers and K. Zilles, “Microarchitecture and connectivity of the parietal lobe,” Handbook of clinical neurology, vol.151, pp. 53–72, 2018.
45. Y. Benjamini and Y. Hochberg, “Controlling the false discovery rate: a practical and powerful approach to multiple testing,” Journal of the Royal statistical society: series B (Methodological), vol. 57, no. 1, pp. 289–300, 1995.
Figures