4760
Accurate Estimation of Fiber Orientations in the Mouse Brain from Diffusion MRI Signals: Learning from Histological Ground Truth1NYU Langone Health, New York, NY, United States
Synopsis
Although dMRI tractograophy has been successfully used to examine brain connectivity, its limitation, mainly in specificity, has also been reported. In this study, we generated a comprehensive mouse brain streamline database based on 2700+ viral tracer data from Allen Institute. The database was used as a ground truth to train a deep learning network to estimate fiber orientations from diffusion MRI data of the mouse brain. Compared to conventional methods, the deep learning network provided more accurate estimation of fiber orientation leading to improved tractography.
Introduction
Diffusion MRI (dMRI) tractography can non-invasively assess macroscopic structural connectivity in the brain. Sophisticated tools (e.g. MRtrix, DSIStudio) have been developed to estimate tissue fiber orientation distribution (FOD) and reconstruct major white matter tracts. Although dMRI tractograophy has been successfully used to examine brain connectivity, its limitation, mainly in specificity1, has also been noted, and is more severe in gray matter, where complex tissue microstructural organization may interfere with estimation of FOD and tractograophy2,3.The objective of this study is to use deep learning (DL) to improve the estimation of fiber orientations from dMRI data. Based on Allen Institute’s viral tracer data, we generated a whole-brain streamline dataset representing mouse brain connectivity and used it as a ground truth to train a DL network. Our results demonstrate that our tool can improve the performance of dMRI tractography.
Materials & Methods:
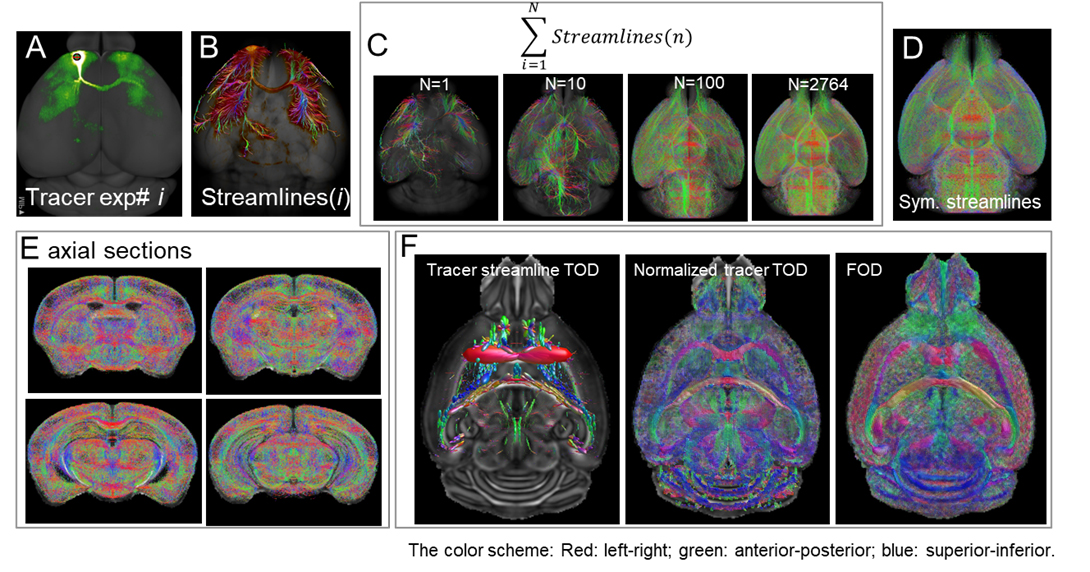
Allen tracer streamline dataset: Tracer streamlines from 2764 independent experiments were downloaded from the Allen Connectivity atlas and combined to build a whole-brain tracer streamline dataset (Fig. 1) in the Allen atlas space4. Tract orientation densities (TODs)5 were calculated from the streamline dataset, with their amplitudes normalized (Fig. 1F).dMRI experiments, FOD, and co-registration: 3D ex vivo dMRI data were acquired from C57BL/6 mice (n=10, 8 wks) with a 0.1 mm isotropic resolution and 60 diffusion encoding directions6, and FODs were estimated using MRtrix. Using mappings between each subject data and the Allen atlas space6, the tracer streamline TODs were mapped to individual subject space with necessary orientation adjustments.
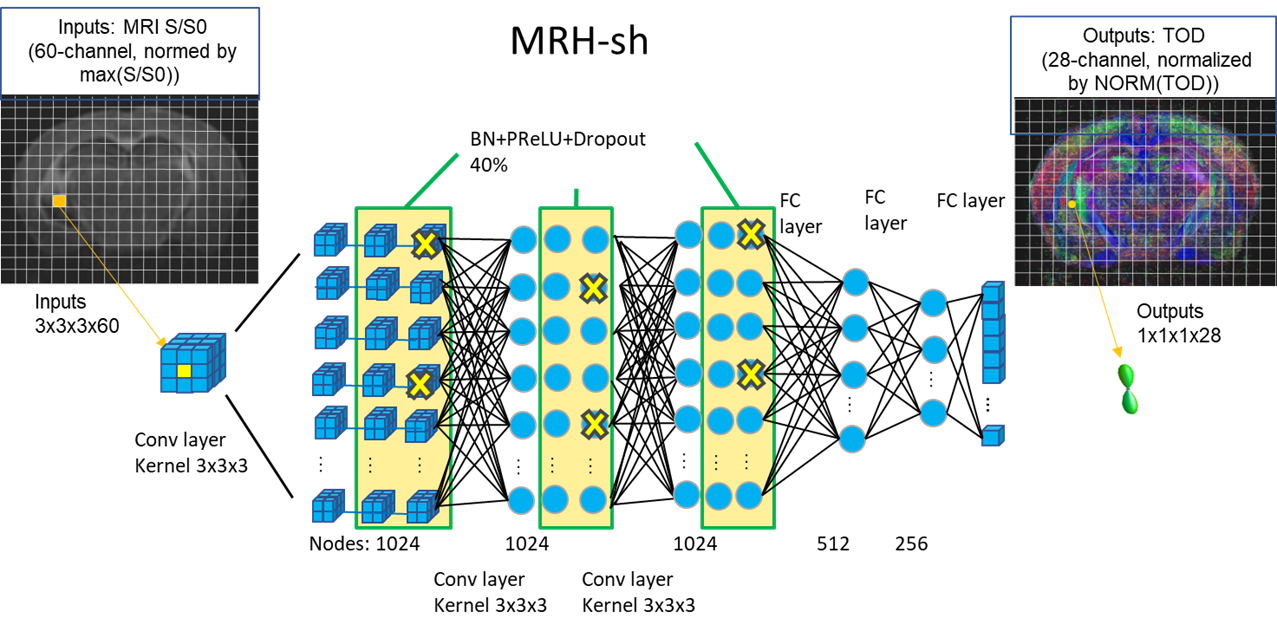
DL setup: A deep neural network similar to the previous DWI-FOD network7 was trained using ex vivo mouse brain dMRI data as input and co-registered tracer streamline TODs as target (Fig. 2). The network (MRH-sh) consisted of convolutional and full connected concatenated layers. We used small 3x3x3 image patches from the forebrain region (n=6) for training (total one million voxels, 10% of which used as validation), and the rest subjects (n=4) for testing.
Results:
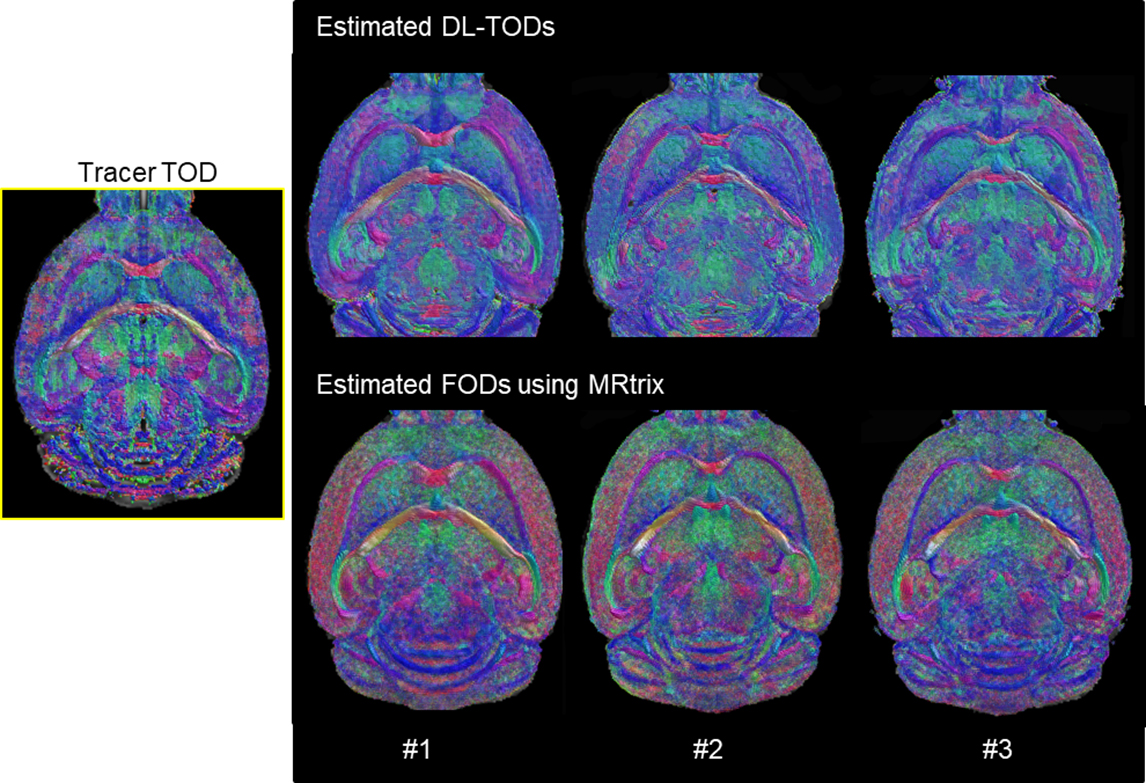
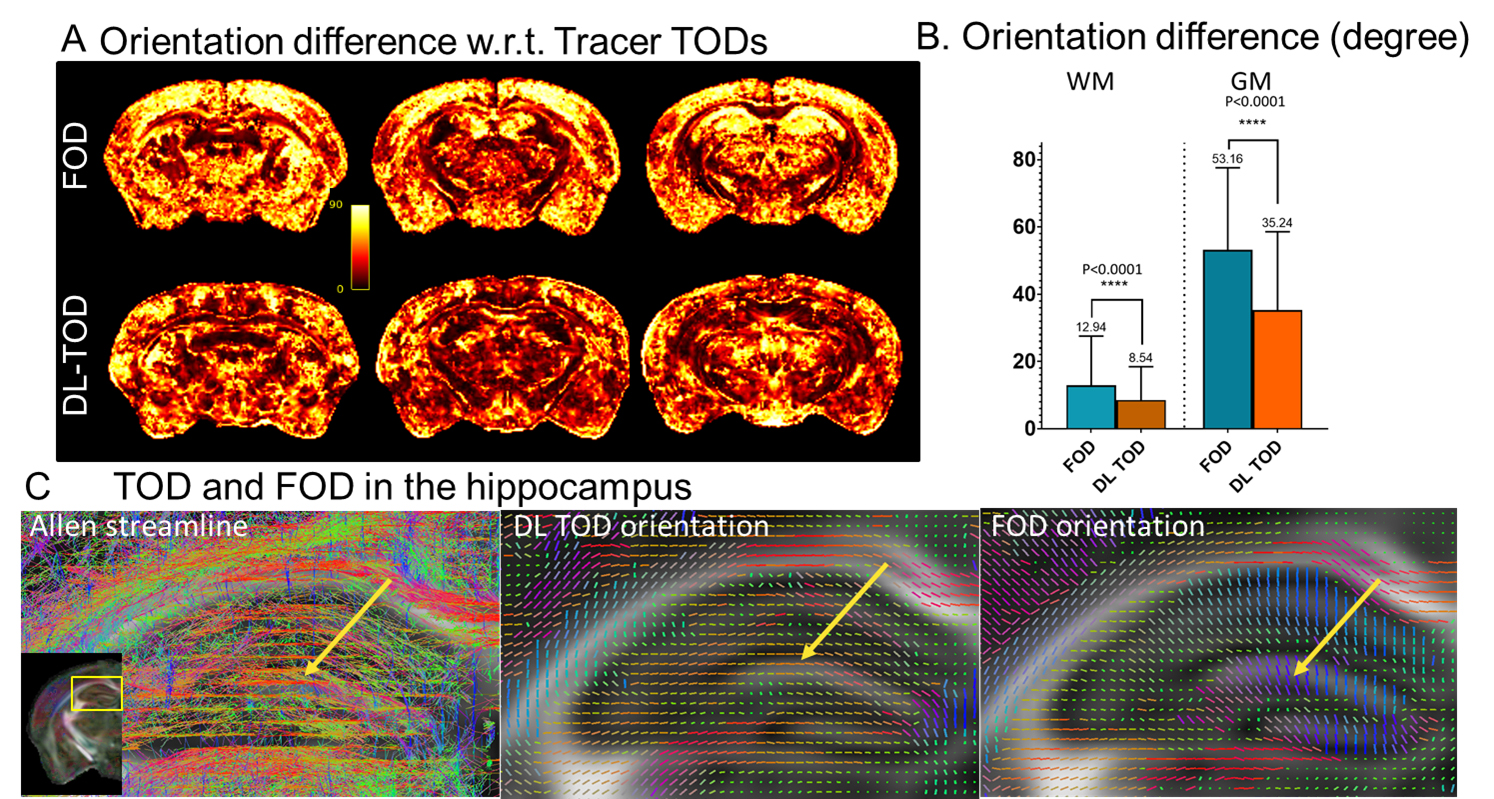
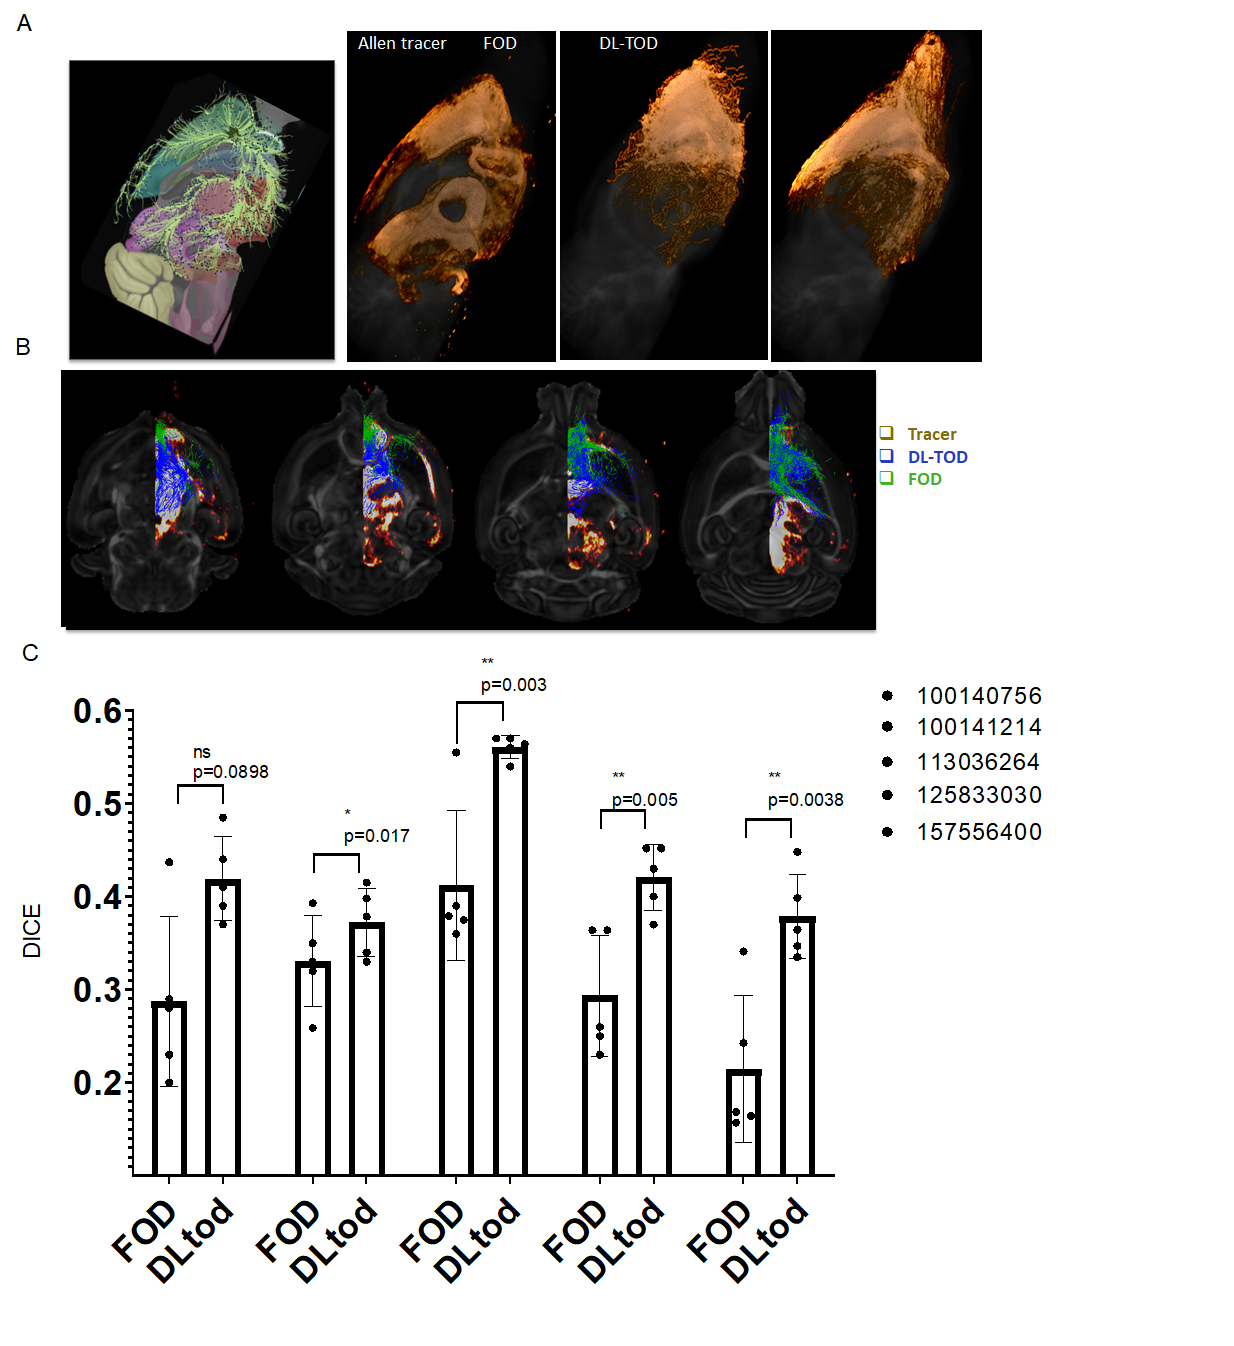
The network predicted TODs (DL-TODs) (Fig. 3) showed better agreement with the tracer streamline TODs than FODs estimated using spherical deconvolution (implemented in MRtrix), as measured by differences in orientation between the largest lobes of TOD/FODs (Fig. 4A). This was more apparent in gray matter structures (e.g. 53.2°±21° for FOD v.s. 35.2°±23° for DL-TOD, P<0.0001, Fig. 4B). In comparison, the improvements in white matters (12.9°±14° for FOD v.s. 8.5°±8° for DL-TOD, P<0.0001) were relatively minor. Fig. 4C compares tracer streamlines with DL-TOD and FOD in the hippocampus. The tracer results revealed many streamlines running in the horizontal orientation (yellow arrow), which is in agreement with our understanding of hippocampal pathways. This organization was recapitulated in the DL-TOD map but not in the FOD map, which predominantly showed vertical (dorsal-to-ventral) orientations, which reflect the dendritic network in the hippocampus.Fig. 5 compares tracer result from a single injection experiment with tractography results started from a comparable seed region based on DL-TOD and FOD maps (n=5). Visual comparisons in 3D (Fig. 5A) and horizontal sections (Fig. 5B) showed a better agreement between tracer and DL-TOD results than the FOD result. This was confirmed by higher DICE score (higher score for better spatial overlap) for the DL-TOD result than FOD. Similar comparisons were performed for other tracer experiments (Fig. 5C) and all showed that DL-TOD improved tractography in term of DICE score with respect to tracer ground truth.
Discussions & Conclusion:
Our results demonstrate that DL networks, trained with histological ground truth, can enhance the accuracy in estimating axonal fiber orientation and, thereby, improve tractography results in the mouse brain. Several groups have compared dMRI results with histology8,9,10 and found good agreement in white matter structures. In gray matter, the complex microstructural organization (e.g. dendritic network and other cellular compartments) poses a major challenge for dMRI to reveal axonal tracts. In this aspect, our results suggested that improvements in gray matter tractography is possible, as shown in Figs. 4-5. Although DL networks are often presented as a black-box, without detailed knowledge of its inner-working, we compared the estimated fiber orientation with results from conventional approaches. The result in Fig. 4C suggests that the DL network can potentially distinguish dMRI signals from the axonal compartments from others (e.g. dendrites). This provides a clue for further optimization of dMRI acquisition to improve the accuracy of tractography.The tracer streamline dataset is an important resource for development and validation of future tractography methods. Even though tracer and dMRI data were not from the same subject, the inter-subject differences are expected to be small among C57BL mouse brains. dMRI data acquired from mouse brains using other acquisition schemes than used in this study can be easily registered and compared to the tracer streamline data.
Our study has several limitations. First, the streamlines generated from viral tracer experiments may not capture or represent all mouse brain axonal connections uniformly. As a result, the number of streamlines may not correlate with actual number of axons. Second, the network was trained using mouse brain data and can not be directly translated to human data, although examining its inner-working (e.g. Fig. 4C) can bring insights into improving axonal orientation estimation.
Acknowledgements
No acknowledgement found.References
1. Cibu T., et al. Anatomical accuracy of brain connections derived from diffusion MRI tractography is inherently limited, PNAS. 2014 Nov: 18(111): no.46.
2. Dan W. and Jiangyang Z. In vivo Mapping of Macroscopic Neuronal Projections in the Mouse Hippocampus using High-resolution Diffusion MRI, Neuroimage. 2016 Jan 15; 125: 84–93.
3. Maged G., et al. Multimodal image registration and connectivity analysis for integration of connectomic data from microscopy to MRI, Nat Commun. 2019, 10: no.5504.
4. Allen Mouse Brain Atlas Version 2 (2011) Technical White Paper, https://mouse.brain-map.org/static/atlas.
5. Dhollander, T. Track orientation density imaging (TODI) and track orientation distribution (TOD) based tractography, Neuroimage, 2014, 94: 312-336.
6. White J.D. et al. Early life stress causes sex-specific changes in adult fronto-limbic connectivity that differentially drive learning. Elife. 2020 Dec 1;9:e58301.
7. Lin, Z. et al. Fast learning of fiber orientation distribution function for MR tractography using convolutional neural network, Med Phys. 2019 Jul; 46(7): 3101-3116.
8. Schilling K.G. et al. Histological validation of diffusion MRI fiber orientation distributions and dispersion. Neuroimage. 2018 Jan 15;165:200-221.
9. Mollink J. et al. Evaluating fibre orientation dispersion in white matter: Comparison of diffusion MRI, histology and polarized light imaging. Neuroimage. 2017 Aug 15;157:561-574. 10. Lin C.P., Validation of diffusion tensor magnetic resonance axonal fiber imaging with registered manganese-enhanced optic tracts. Neuroimage. 2001 Nov;14(5):1035-47.
10. Lin C.P., Validation of diffusion tensor magnetic resonance axonal fiber imaging with registered manganese-enhanced optic tracts. Neuroimage. 2001 Nov;14(5):1035-47.
Figures