4758
Diffusion MRI harmonization and thresholding improve multicentre network analysis: a demonstration in cerebral small vessel disease1Neurology, Department of Neurology and Neurosurgery, UMC Utrecht Brain Center, University Medical Center Utrecht, Utrecht, Netherlands, 2Image Sciences Institute, University Medical Center Utrecht, Utrecht University, Utrecht, Netherlands, 3Memory, Aging and Cognition Center, Department of Pharmacology, National University of Singapore, Singapore, Singapore, 4Institute for Stroke and Dementia Research (ISD), University Hospital, LMU Munich, Munich, Germany, 5Medical Image Analysis Center (MIAC) and qbig, Department of Biomedical Engineering, University of Basel, Basel, Switzerland, 6Department of Geriatric Medicine, University Medical Center Utrecht, Utrecht, Netherlands, 7Department of Geriatric Medicine, University Medical Center Utrecht, Utrecht, The Netherlands 7Division of Neurology, Department of Medicine and Therapeutics, Gerald Choa Neuroscience Centre, Faculty of Medicine, Prince of Wales Hospital, The Chinese University of Hong Kong, Hong Kong, Hong Kong
Synopsis
We investigated if network thresholding and diffusion MRI (dMRI) harmonization improve a) cross-site consistency of network architecture and b) precision and sensitivity to detect network connections disrupted in cerebral small vessel disease (SVD). Brain networks were reconstructed from dMRI in five cohorts. Consistency of network architecture was examined in age-matched controls whereas sensitivity and precision to detect disrupted connections was assessed in sporadic SVD patients. Network consistency, as well as sensitivity and precision to detect disrupted connections were improved by thresholding and harmonization. We recommend using these techniques in networks studies of SVD to leverage existing multicentre datasets.
INTRODUCTION
Disruption of structural brain networks is a potential mechanism through which cerebral small vessel disease (SVD) affects cognition1. However, network analyses in SVD have been predominantly performed at single centers with inconsistencies in network architectures and disease effects. We investigate if combining thresholding to generate consistent network architectures and harmonization to pool large multicentre data improve precision and sensitivity to detect connections most strongly affected in SVD.METHODS
Diffusion MRI of four cohorts of SVD patients (n=603) and age-matched controls (n=145) were included 2–7. Whole-brain networks were reconstructed using constrained spherical deconvolution tractography8 with l-max 6, step size of 1mm, fiber orientation distribution threshold of 0.1 and an angle of 45°. Network nodes were defined by the AAL atlas9 and edges by the average fractional anisotropy (FA) of all streamlines between two nodes. We evaluated whether network thresholding and harmonization with rotation invariant spherical harmonic (RISH) features10 improve consistency of network architecture in age-matched controls by calculating cross-site differences in connection probability and FA. Thresholding was applied by removing low-probability connections in each site until a fixed-density of 15% was achieved11,12. Harmonization was performed by scaling group-level RISH features of 15 training controls of each site to an arbitrary reference13.Subsequently, we tested if thresholding, harmonization and pooling improve precision and sensitivity to detect connections disrupted in SVD. Network-based statistics (NBS)14 was performed to compare the FA of each connection between patients and controls. Two-sample t-tests were performed at each connection and corrected for False Discovery Rate (FDR) with 105 permutations. Clearly there is no established imaging ground-truth on which tracts are affected by SVD apart from histology15. Given that sporadic SVD occurs in the elderly, who likely have co-morbid degenerative diseases, we use one cohort with pure SVD (CADASIL15) and high disease burden as reference standard to which we compared the findings in sporadic SVD cohorts. Connections with large effect sizes (Cohen’s d >0.8) that survived thresholding and FDR in the CADASIL cohort were established as reference. Precision within sites was estimated by comparing the rate of true-positives and false-positives relative to the reference. The same analysis was performed on pooled data of sporadic SVD cohorts.
RESULTS & DISCUSSION
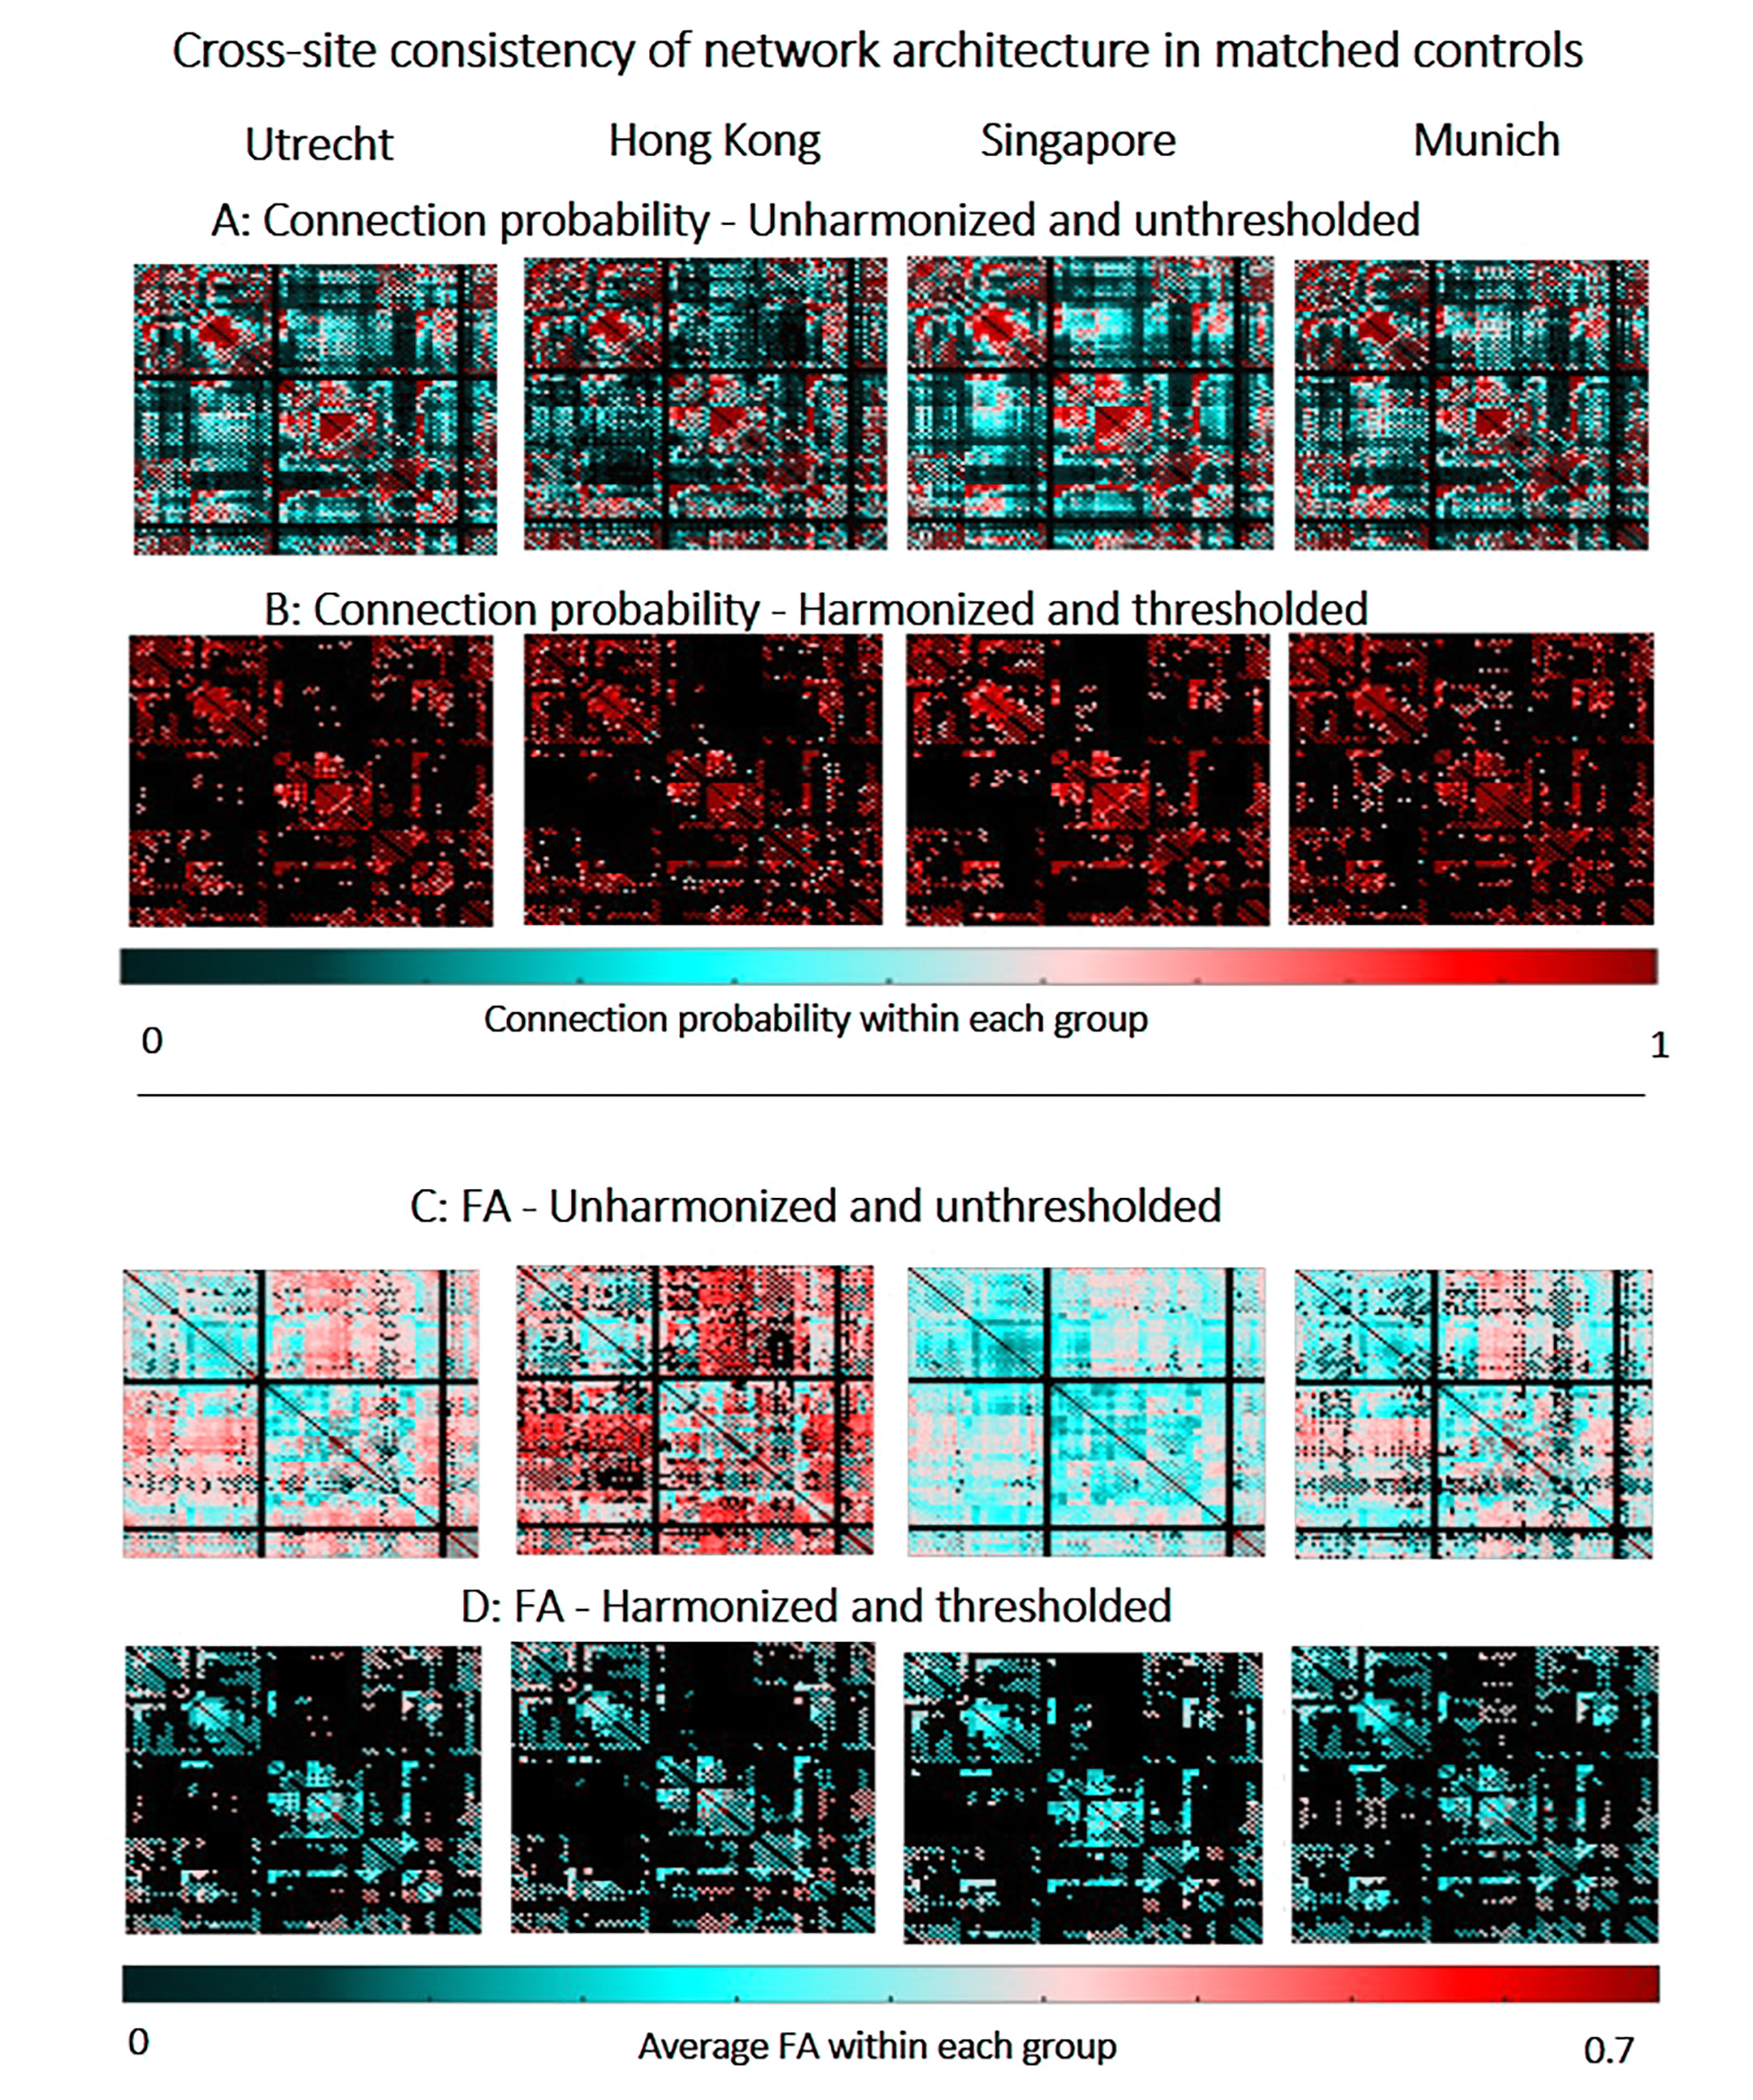
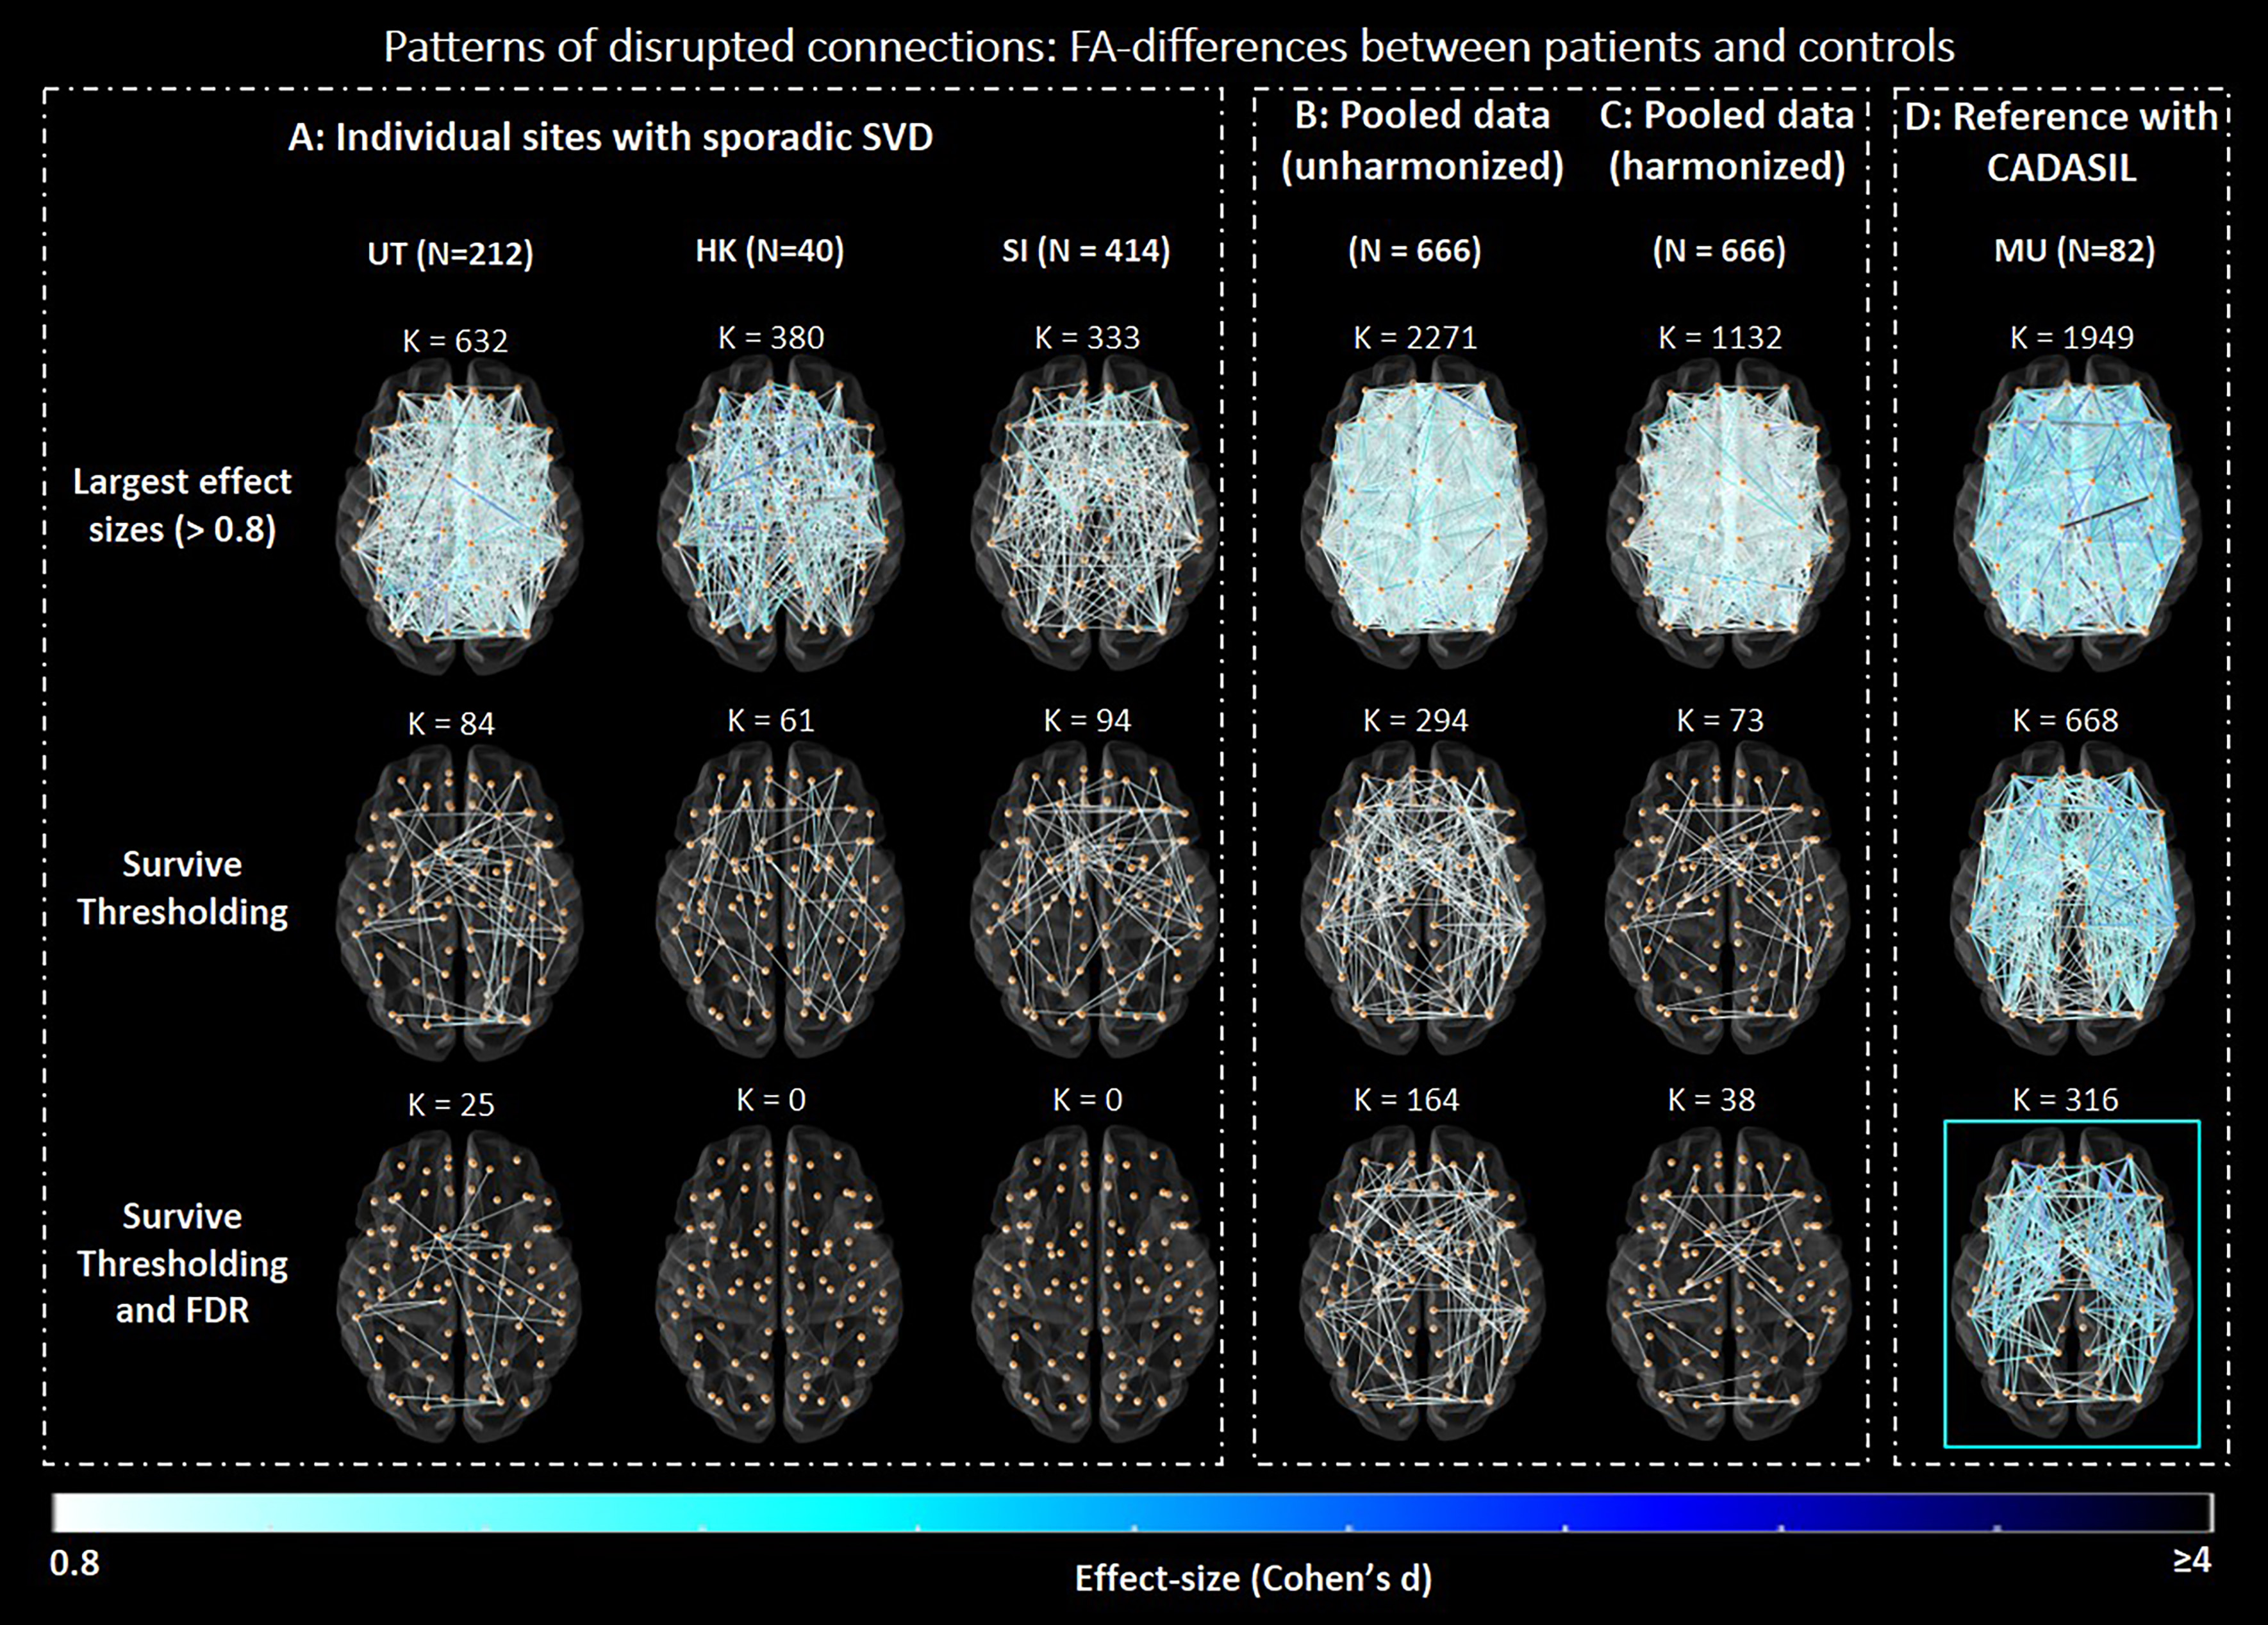
Before harmonization and thresholding, networks of age-matched controls contained many low-probability connections (i.e., connections reconstructed in few subjects, Fig.1A). These connections were not always detected in the same network location across sites, and were likely a byproduct of errors in fiber tractography16. This resulted in low consistency across sites (relative cross-site difference: 34.7% - 46.8%, Fig.1A). Harmonization did not improve cross-site consistency of connections, since it mainly impacts network weights but not tract reconstruction13. By contrast, as expected thresholding did remove low probability connections, thus improving cross-site consistency, also when combined with harmonization (relative cross-site difference: 4.5%-7.8%, Fig.1B). Before harmonization and thresholding, FA in the controls varied across sites (relative cross-site difference up to 36.9%, Fig.1C). Harmonization reduced these differences, but thresholding alone did not have an impact since even though only high-probability connections are kept in the network, their weights were still influenced by scanner-related inconsistencies. Together, thresholding and harmonization produced networks with consistent connections reconstructed in most subjects, and with more similar FA across sites (relative cross-site difference: 5.4-17.4%, Fig.1D).We observed different disease burdens in sporadic SVD cohorts as indicated by the range of effect sizes (k≈300-700 connections with d>0.8, Fig.2A, first row). Most of these large effect size connections were likely spurious as they were present in tracts of low probability. When compared to the CADASIL reference, the rate of false-positives was high, resulting in low precision within sites (precision: 0.08-0.19, Table 1). Thresholding reduced the number of false-positives and improved precision within sites (precision: 0.38-0.64, Fig.2A, second row, Table 1). Few connections after thresholding remained significant after FDR-correction (k = 25 in the Utrecht cohort), indicating low sensitivity within sites (Fig.2A, third row).
Our results with non-harmonized pooled data show that effect sizes were inflated due to scanner-related differences impacting FA, with more than 2/3 of all tested connections having large effect sizes (k=2271, Fig.2B, first row). This highlights the risk of pooling dMRI data without harmonization17. Furthermore, the bulk of large effect sizes was detected in low-probability connections. Consequently, precision was very low relative to the reference standard (precision: 0.06). After thresholding, the rate of false-positives was reduced, improving precision (precision: 0.70, Table 1). Many connections survived FDR-correction due to the larger sample size and artificially inflated effect sizes (k = 164, Fig.2B, third row). After harmonization, effect sizes were closer to those observed in individual sporadic SVD cohorts (k = 1132 connections with effect size >0.8, Fig.2C, first row). Again, additional thresholding reduced the rate of false-positives and improved precision (0.97). This increase in precision was also accompanied by improved sensitivity since more connections survived FDR, as compared to individual sites (k = 38, Fig.2C, third row).
CONCLUSION
In a multicentre dataset of patients with SVD, we demonstrated that sensitivity and precision to detect disease effects in specific network connections is improved by network thresholding and dMRI harmonization. We recommend applying these techniques in the SVD research field to leverage large existing datasets.Acknowledgements
This work was supported by ZonMw, The Netherlands Organisation for Health Research and Development (VICI grant 91816616 to G.J. Biessels). The research of A. Leemans is supported by VIDI Grant 639.072.411 from the Netherlands Organization for Scientific Research (NWO). Zoom@SVDs is part of the SVDs@target project. SVDs@target has received funding from the European Union’s Horizon2020 research and innovation program under grant agreement No 666881. The CUHK-RI is supported by General Research Fund (grant number GRF CUHK 471911), the Lui CheWoo Institute of Innovative Medicine, and Therese Pei Fong Chow Research Centre for Prevention of Dementia (in memory of Donald H. K. Chow). Funding for the EDIS study was provided by the National Medical Research Council of Singapore. We thank all patients and controls for study participation. We thank Mathias Hübner for technical assistance and Angelika Doerr as study nurse for her help in the VASCAMY study in Munich.
References
1. Petersen M, Frey BM, Schlemm E, et al. Network Localisation of White Matter Damage in Cerebral Small Vessel Disease. Sci Rep. 2020;10(1):1-9. doi:10.1038/s41598-020-66013-w
2. Aalten P, Ramakers IHGB, Biessels GJ, et al. The Dutch Parelsnoer Institute - Neurodegenerative diseases; methods, design and baseline results. BMC Neurol. 2014;14(1):1-8. doi:10.1186/s12883-014-0254-4
3. Reijmer YD, Leemans A, Brundel M, Kappelle LJ, Biessels GJ. Disruption of the cerebral white matter network is related to slowing of information processing speed in patients with type 2 diabetes. Diabetes. 2013;62(6):2112-2115. doi:10.2337/db12-1644
4. Lam BYK, Leung KT, Yiu B, et al. Peak width of skeletonized mean diffusivity and its association with age-related cognitive alterations and vascular risk factors. Alzheimer’s Dement Diagnosis, Assess Dis Monit. 2019;11:721-729. doi:10.1016/j.dadm.2019.09.003
5. Baykara E, Gesierich B, Adam R, et al. A Novel Imaging Marker for Small Vessel Disease Based on Skeletonization of White Matter Tracts and Diffusion Histograms. Ann Neurol. 2016;80(4):581-592. doi:10.1002/ana.24758
6. Brink H Van Den, Kopczak A, Arts T, et al. Cerebral Circulation - Cognition and Behavior Zooming in on cerebral small vessel function in small vessel diseases with 7T MRI : Rationale and design of the “ ZOOM @ SVDs ” study. Cereb Circ - Cogn Behav. 2021;2(April):100013. doi:10.1016/j.cccb.2021.100013
7. Hilal S, Ikram MK, Saini M, et al. Prevalence of cognitive impairment in Chinese: Epidemiology of Dementia in Singapore study. J Neurol Neurosurg Psychiatry. 2013;84(6):686-692. doi:10.1136/jnnp-2012-304080
8. Jeurissen B, Leemans A, Jones DK, Tournier JD, Sijbers J. Probabilistic fiber tracking using the residual bootstrap with constrained spherical deconvolution. Hum Brain Mapp. 2011;32(3):461-479. doi:10.1002/hbm.21032
9. Tzourio-Mazoyer N, Landeau B, Papathanassiou D, et al. Automated anatomical labeling of activations in SPM using a macroscopic anatomical parcellation of the MNI MRI single-subject brain. Neuroimage. 2002;15(1):273-289. doi:10.1006/nimg.2001.0978
10. Mirzaalian H, De Pierrefeu A, Savadjiev P, et al. Harmonizing diffusion MRI data across multiple sites and scanners. Lect Notes Comput Sci (including Subser Lect Notes Artif Intell Lect Notes Bioinformatics). 2015;9349:12-19. doi:10.1007/978-3-319-24553-9_2
11. Robalo BMDB, Vlegels N, Leemans A, Biessels GJ, Reijmer YD. Fixed-density thresholding in structural brain networks : a requirement for clinical studies ? :771.
12. Roberts JA, Perry A, Roberts G, Mitchell PB, Breakspear M. Consistency-based thresholding of the human connectome. Neuroimage. 2017;145(September 2016):118-129. doi:10.1016/j.neuroimage.2016.09.053
13. Cetin Karayumak S, Bouix S, Ning L, et al. Retrospective harmonization of multi-site diffusion MRI data acquired with different acquisition parameters. Neuroimage. 2019;184:180-200. doi:10.1016/j.neuroimage.2018.08.073
14. Zalesky A, Fornito A, Bullmore ET. Network-based statistic: Identifying differences in brain networks. Neuroimage. 2010;53(4):1197-1207. doi:10.1016/j.neuroimage.2010.06.041
15. Craggs LJL, Yamamoto Y, Ihara M, et al. White matter pathology and disconnection in the frontal lobe in cerebral autosomal dominant arteriopathy with subcortical infarcts and leukoencephalopathy ( CADASIL ). 2014;44:591-602. doi:10.1111/nan.12073
16. Hein KHM, Neher P, Christophe J, Alexandre M. Tractography ‐ based connectomes are dominated by false ‐ positive connections. bioRxiv. Published online 2016:1-23. doi:10.1101/084137
17. Ning L, Bonet-Carne E, Grussu F, et al. Cross-scanner and cross-protocol multi-shell diffusion MRI data harmonization: Algorithms and results. Neuroimage. 2020;221(October 2019). doi:10.1016/j.neuroimage.2020.117128
Figures