4757
Microstructural Basis of Fractional Anisotropy Difference Associated with b-value in Diffusion MRI1Center for Brain Imaging Science and Technology, College of Biomedical Engineering and Instrumental, Zhejiang University, Hangzhou, China, 2Wellcome Centre for Integrative Neuroimaging, FMRIB, Nuffield Department of Clinical Neurosciences, University of Oxford, London, United Kingdom, 3State Key Laboratory of Magnetic Resonance and Atomic and Molecular Physics, Innovation Academy for Precision Measurement Science and Technology, Chinese Academy of Sciences, Wuhan, China, 4Department of Neurology in Second Affiliated Hospital, Key Laboratory of Medical Neurobiology of Zhejiang Province, and Department of Neurobiology, Zhejiang University, Hangzhou, China, 5National Human Brain Bank for Health and Disease, School of Brain Science and Brain Medicine, Zhejiang University, Hangzhou, China, 6Department of Imaging Sciences, University of Rochester, Rochester, NY, United States
Synopsis
The microstructural basis of b-value dependence on FA was investigated in the human brain, using in vivo MRI and a formalin-fixed human brain hemisphere. Consistent decreases of FA with increasing b-values were observed both in vivo and ex vivo. The percentage difference of FA (pdFA) between high and low b-value datasets was found to increase with neurite density estimated from NODDI, which was further validated using histology and a multi-compartment model simulation. Results indicate that the b-value dependence of FA can be explained by compartmental differences between intra- and extra-neurites.
Introduction
In diffusion magnetic resonance imaging (dMRI), it has been previously reported that higher b-values are associated with a decreased fractional anisotropy (FA).1–6 This association has been previously attributed to either contributions from rectified noise to the measured signal,1,2,4 or non-gaussian diffusion effects driven by tissue microstructure.5 In this abstract, we investigated whether the different diffusion profiles of intra- and extra-neurite compartments of white matter caused the FA dependence using in-vivo and ex-vivo MRI, alongside histological staining.Methods
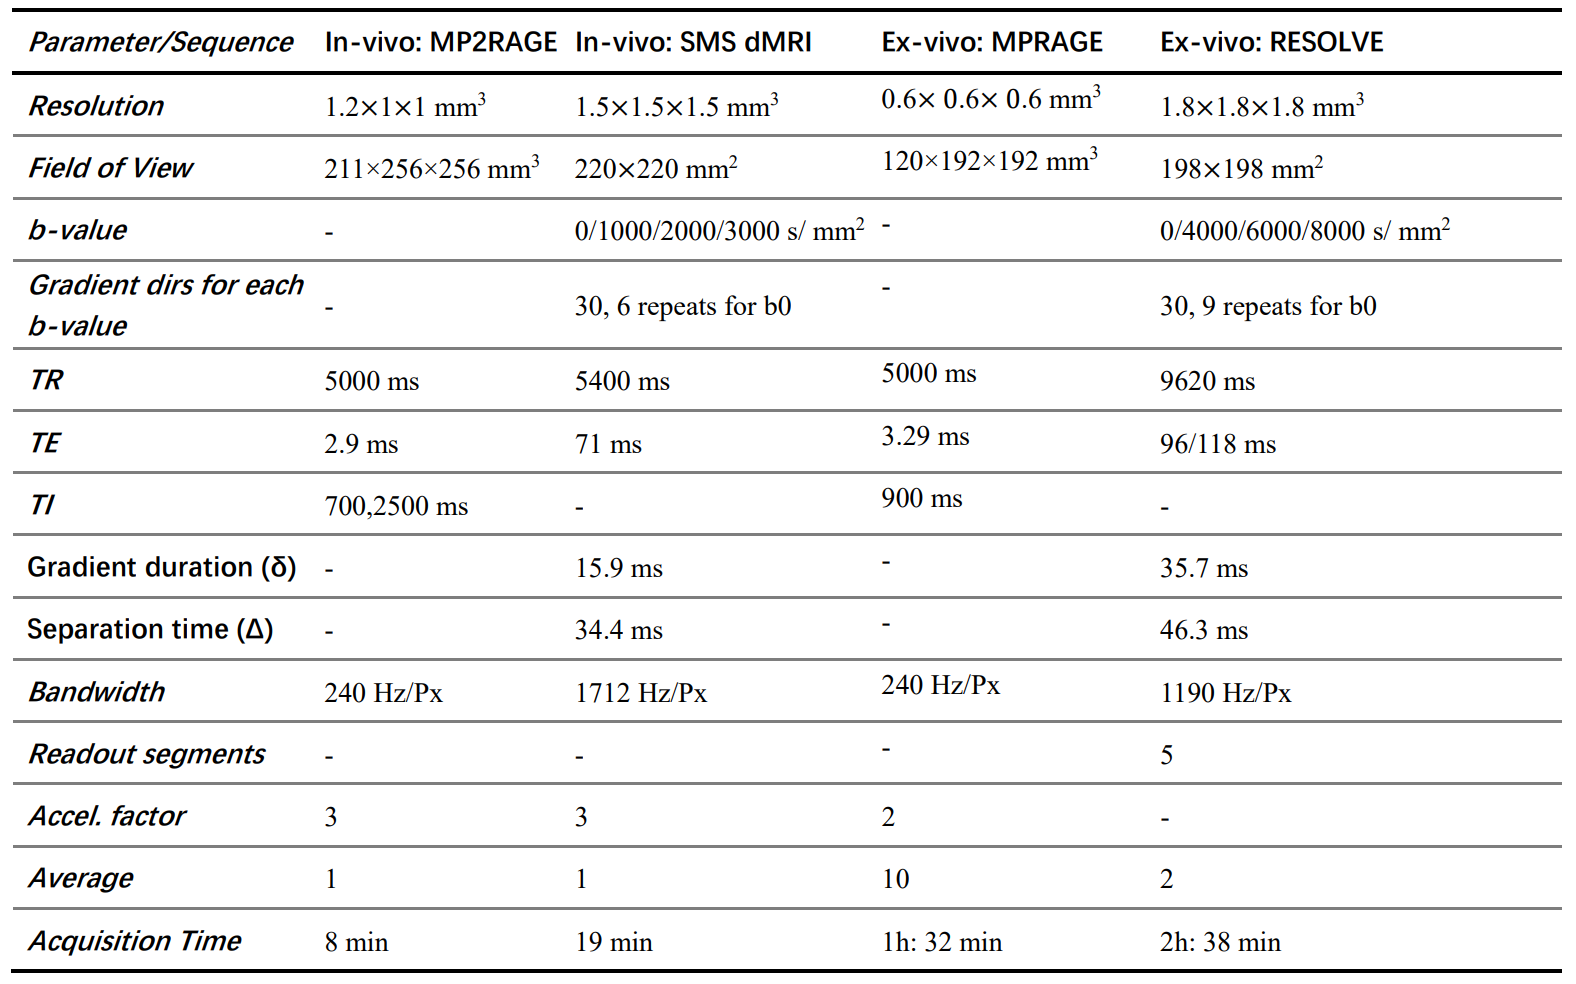
In this study, 61 healthy volunteers were recruited for in vivo imaging. In addition, a formalin-fixed human brain hemisphere (left) was obtained from the National Human Brain Bank for Health and Disease for post-mortem imaging, and prepared for scanning as described previously.7Image acquisition was performed using a 3T MAGNETOM Prisma scanner (64-channel head-neck coil). A simultaneous multi-slice (SMS) EPI sequence with b-value of 1000-, 2000-, 3000 s/mm2 and a Readout-Segmented Echo-Planar Imaging (RS-EPI) sequence with b-value of 4000-, 6000-, 8000 s/mm2 were used for in-vivo and ex-vivo brains, respectively. Full details of the sequences and parameters are listed in Table 1.8–10
For the dMRI analysis, the diffusion weighted imaging (DWI) datasets were denoised using MRtrix3,11 with field map estimation, distortion correction, and head motion correction performed using FSL.12,13 Diffusion tensors estimates were calculated independently from each b-shell. The ex-vivo DWI data were processed similarly to the in-vivo data. In addition, the three-shell in-vivo data were fitted to the NODDI model to get NDI-NODDI .14
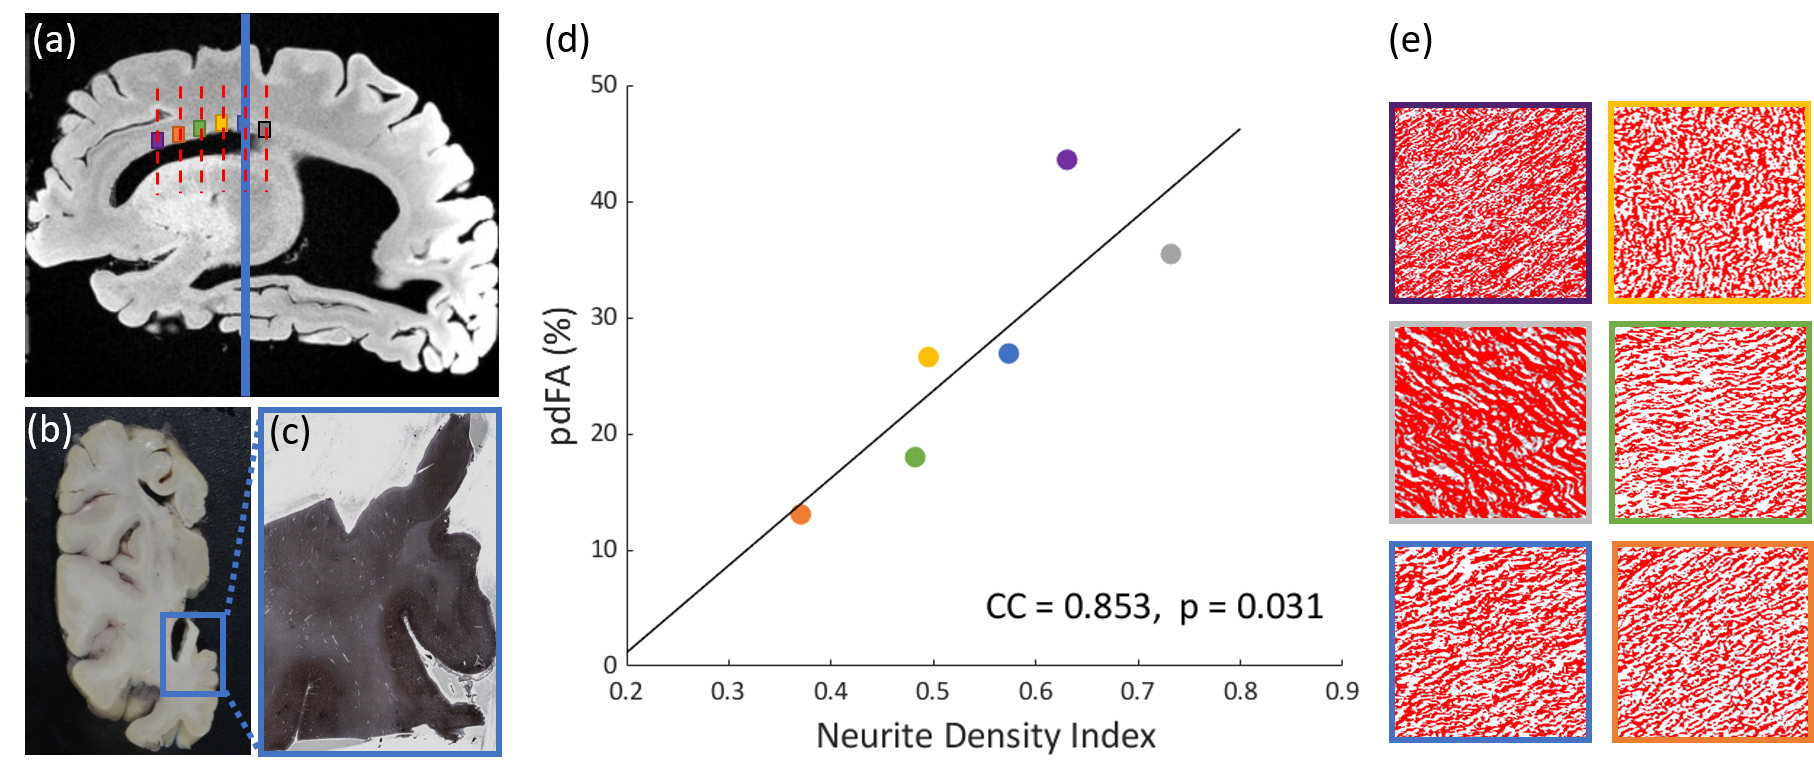
Postmortem tissue over the corpus callosum was sectioned and stained using Bielschowsky’s silver impregnation (BIEL) technique.15 Neurite density (NDI-histology) in the corpus callosum was quantified from the BIEL-stained sections using Image-J.16,17
In order to quantify FA variations, a percentage difference of FA (pdFA) between b-values was defined as:
$$pdFA_{ab}= \frac{FA(b_a)-FA(b_b)}{(FA(b_a)+FA(b_b))/2}\times 100\textrm{%},\left ( b_a<b_b \right )$$
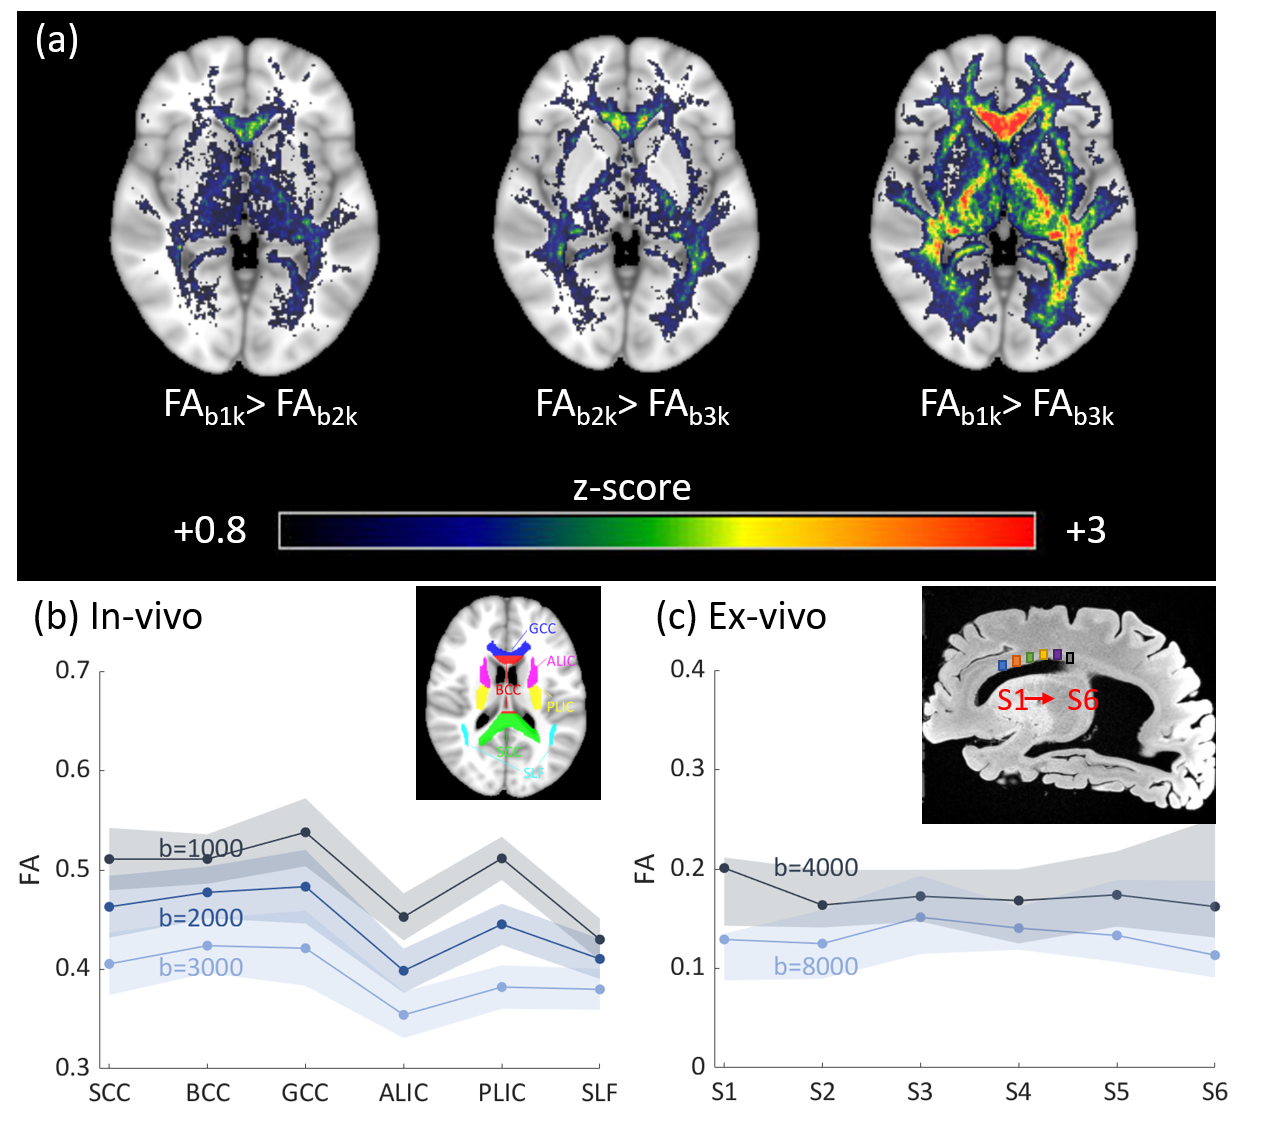
Voxel-wise one-sided student’s paired t-tests were performed over the whole brain to investigate if the FA decreased significantly as b-values increased, as reported previously.1–6 Diffusion metrics and pdFA were subsequently averaged within regions of interest (ROIs) defined by the JHU DTI-based white-matter atlases (Fig.1(b)). For the ex-vivo analysis, ROIs were manually drawn using MRIcron (Fig.1(c)) for both MRI analysis and histological staining. ROIs were restricted to the corpus callosum which has highly parallel-aligned fiber bundles.
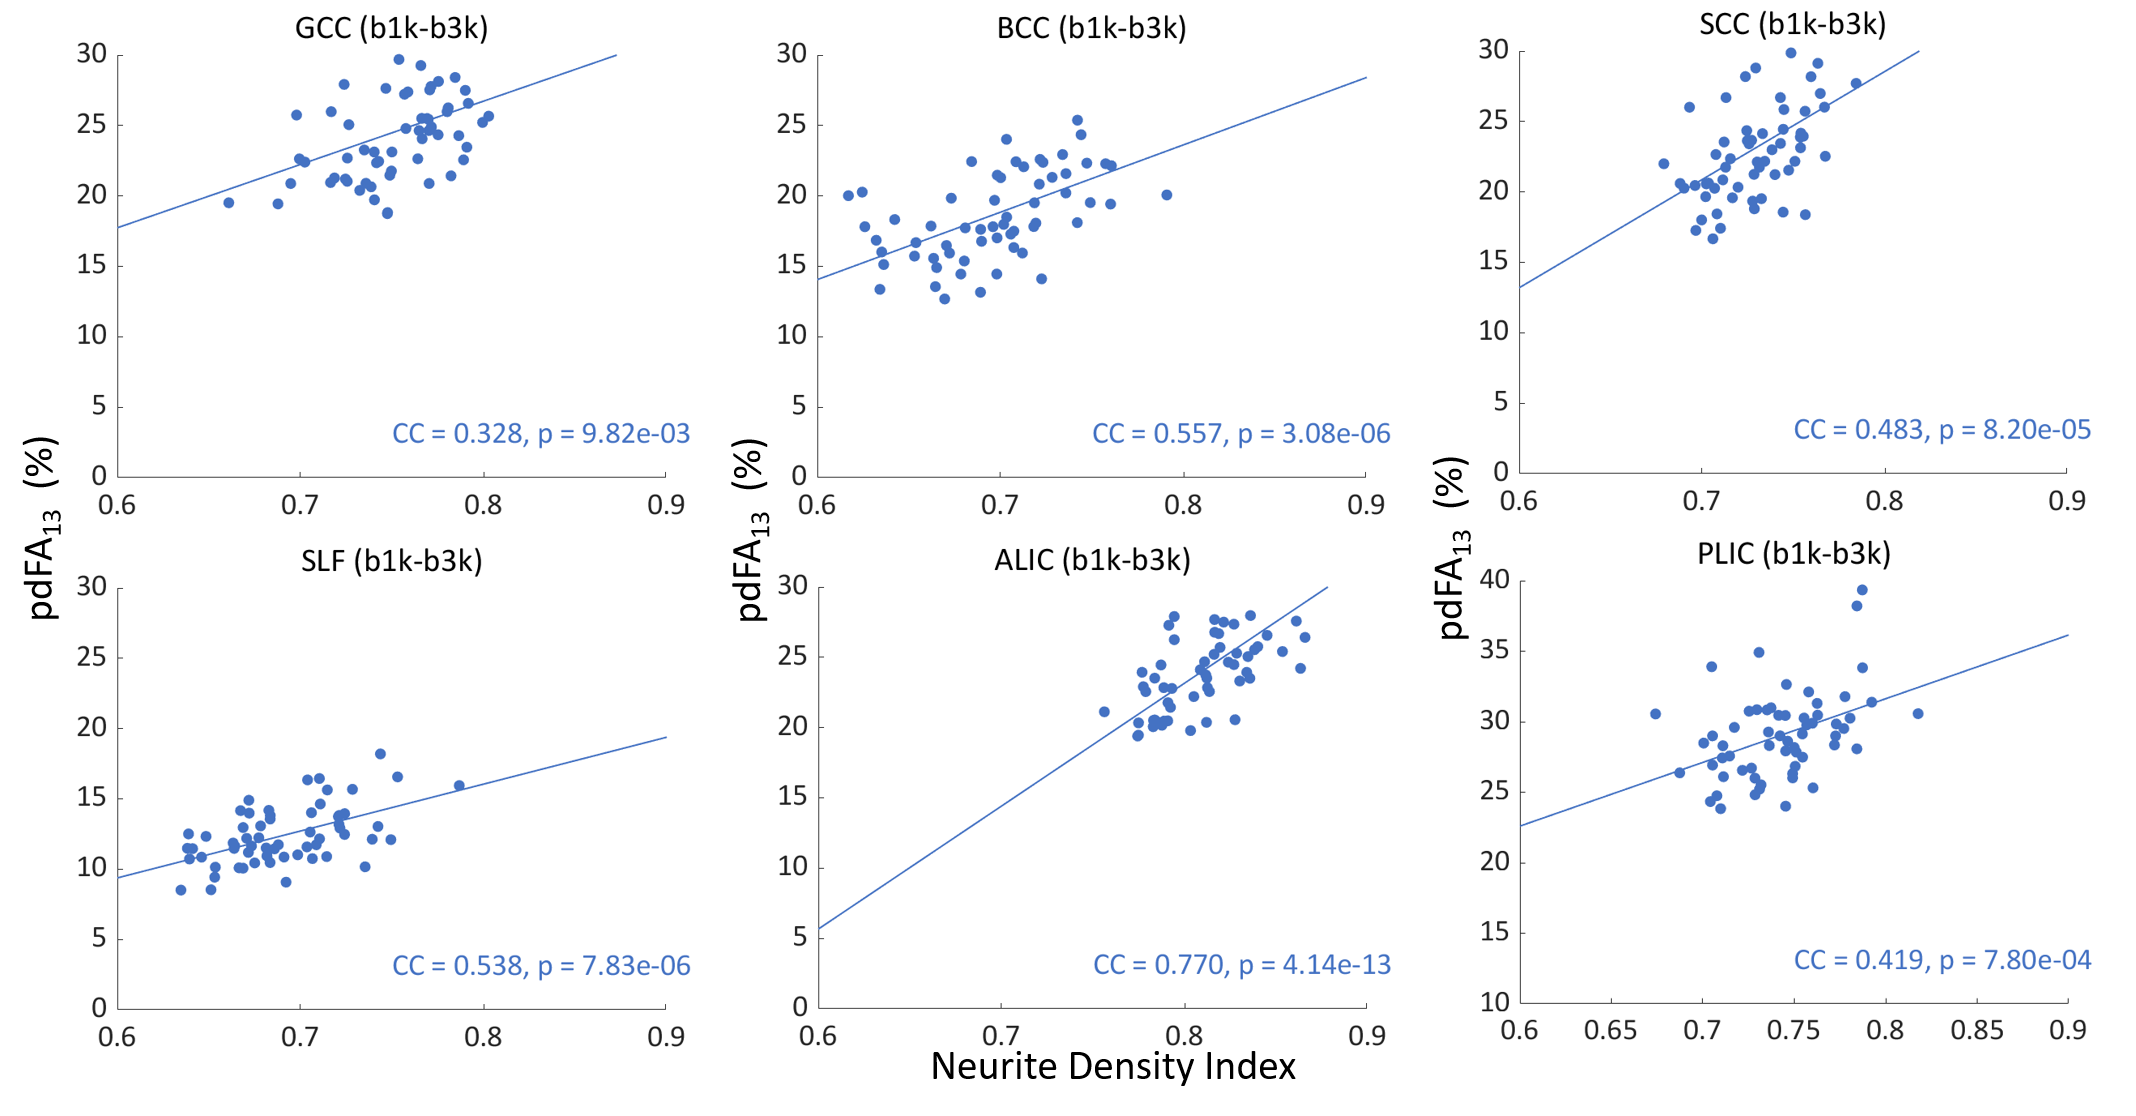
Pearson’s correlations between pdFA and NDI-NODDI (in vivo) and NDI-histology (ex vivo) for each ROI were computed to idenetify the strength of association. All analyses were performed using MATLAB 2019b.
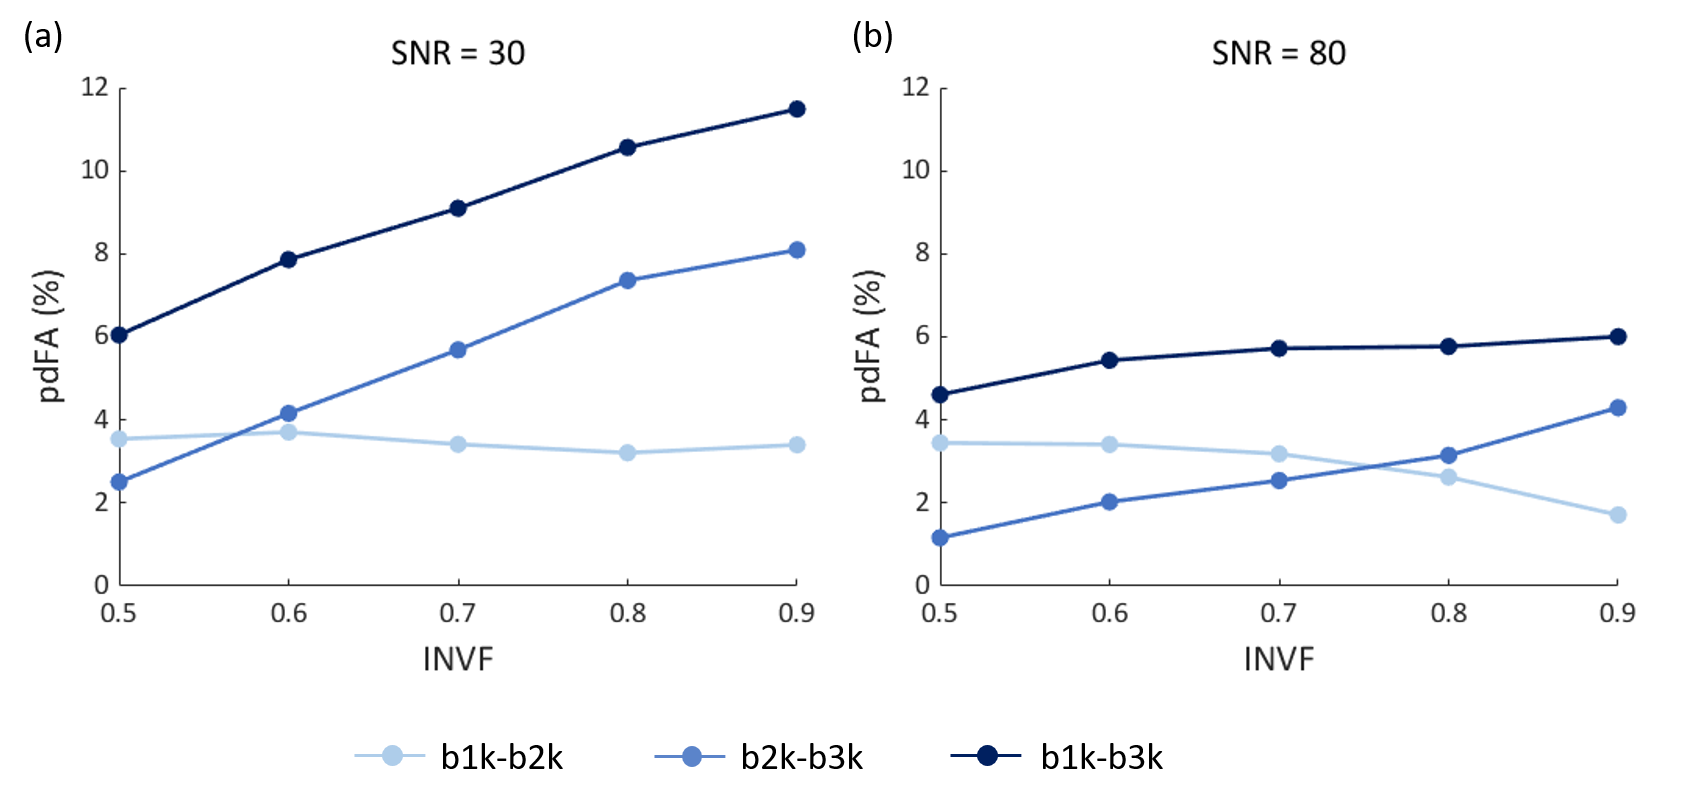
To further explore how intra-neurite volume fraction (INVF) contributes to FA change over different b-values, a multi-compartment WM configuration was numerically simulated.18 The intra-neurite compartment (INC) was modeled as a collection of infinitely long cylinders, with the extra-neurite compartment (ENC) assumed to behave as a Gaussian anisotropic medium.19–22 The INC diffusivity were set to be higher than the ENC.20,23,24 For simplicity, sub-bundles were not considered. INVFs were set to [0.5, 0.6, 0.7, 0.8, 0.9], as existed in white matter tissue,25 at SNR=30 (the level of experimental data) and 80 (the magnitude MR signal was simulated for 1000 random Rician noise realizations). The diffusion gradient tables of the simulated data were identical to the in-vivo data protocol. All the simulated diffusion signals were fitted with a diffusion tensor and NODDI model to estimate FA and NDI.
Results & Discussion
The group-level t-test shows that as the b-value increased, FA consistently decreased in white matter (Fig. 1). The pdFAs were found to be significantly positively correlated with NDI-NODDI in the selected ROIs of the in-vivo dataset (Fig. 2). Importantly, given the general poor specificity of dMRI data, the ex-vivo experiment further supports these in-vivo findings as reflecting a true correlation of pdFA with neurite density. Figure 3(d) shows that the region-wise pdFA48 was significantly correlated (p=0.031) with NDI-histology computed from BIEL staining (Fig. 3 (a, c)).Our simulations investigated the effect of INVF on pdFA (Fig. 4). Simulations with varying INVF at SNR = 30 & 80 revealed that the in vivo difference in FA was largest between b=1000 & 3000 s/mm2 (pdFA13). A slight increase of pdFA13 was found at SNR = 80, and it was amplified to 6-12% at SNR = 30. A similar trend was seen with pdFA23. The simulation revealed that the trend of pdFA against b-values could be driven by differences of diffusion coefficient between INC and ENC,20 with the noise floor increasing the FA difference. This suggests that when the b-value is small, the INC contributes more to the observed diffusion signal, due to its larger diffusivity than the ENC, whereas when the b-value is large, the INC contributes less. As the INC is much more anisotropic than ENC, the observed FA would be expected to decrease at a larger b-value. As a result, increasing diffusion weighting will lead to an FA to resemble that of a compartment with lower diffusion coefficients.
Conclusion
We demonstrated the FA dependence on b-values using experimental results from in-vivo and ex-vivo human brain data, alongside model simulations. The pdFA between high and low b-values was observed to rise with intra-neurite volume fraction. These findings suggest that the multi-compartment microstructure of axons may be responsible for FA’s b-value dependence, while noise in acquisition also contribute.Acknowledgements
This work was supported by the National Key R&D Program of China(2020AAA0109500), National Natural Science Foundation of China(81871428), Fundamental Research Funds for the Central Universities(2021FZZX002-19).References
1. Farrell JAD, Landman BA, Jones CK, et al. Effects of signal-to-noise ratio on the accuracy and reproducibility of diffusion tensor imaging–derived fractional anisotropy, mean diffusivity, and principal eigenvector measurements at 1.5T. J Magn Reson Imaging. 2007;26(3):756-767. doi:10.1002/jmri.21053
2. Jones DK, Basser PJ. “Squashing peanuts and smashing pumpkins”: How noise distorts diffusion-weighted MR data. Magn Reson Med. 2004;52(5):979-993. doi:10.1002/mrm.20283
3. Landman BA, Farrell JAD, Jones CK, Smith SA, Prince JL, Mori S. Effects of diffusion weighting schemes on the reproducibility of DTI-derived fractional anisotropy, mean diffusivity, and principal eigenvector measurements at 1.5T. Neuroimage. 2007;36(4):1123-1138. doi:10.1016/j.neuroimage.2007.02.056
4. Mukherjee P, Chung SW, Berman JI, Hess CP, Henry RG. Diffusion Tensor MR Imaging and Fiber Tractography: Technical Considerations. Am J Neuroradiol. 2008;29(5):843-852. doi:10.3174/ajnr.a1052
5. Veraart J, Poot DHJ, Hecke W Van, et al. More Accurate Estimation of Diffusion Tensor Parameters Using Diffusion Kurtosis Imaging. 2011;145:138-145. doi:10.1002/mrm.22603
6. Lerma-Usabiaga G, Mukherjee P, Ren Z, Perry ML, Wandell BA. Replication and generalization in applied neuroimaging. Neuroimage. 2019;202:116048. doi:10.1016/j.neuroimage.2019.116048
7. Jonkman LE, Graaf YG de, Bulk M, et al. Normal Aging Brain Collection Amsterdam (NABCA): A comprehensive collection of postmortem high-field imaging, neuropathological and morphometric datasets of non-neurological controls. NeuroImage Clin. 2019;22(January):101698. doi:10.1016/j.nicl.2019.101698
8. Marques JP, Kober T, Krueger G, van der Zwaag W, Van de Moortele PF, Gruetter R. MP2RAGE, a self bias-field corrected sequence for improved segmentation and T1-mapping at high field. Neuroimage. 2010;49(2):1271-1281. doi:10.1016/j.neuroimage.2009.10.002
9. Setsompop K, Gagoski BA, Polimeni JR, Witzel T, Wedeen VJ, Wald LL. Blipped-controlled aliasing in parallel imaging for simultaneous multislice echo planar imaging with reduced g -factor penalty. Magn Reson Med. 2012;67(5):1210-1224. doi:10.1002/mrm.23097
10. Porter DA, Heidemann RM. High resolution diffusion-weighted imaging using readout-segmented echo-planar imaging, parallel imaging and a two-dimensional navigator-based reacquisition. Magn Reson Med. 2009;62(2):468-475. doi:10.1002/mrm.22024
11. Veraart J, Fieremans E, Novikov DS. Diffusion MRI noise mapping using random matrix theory. Magn Reson Med. 2016;76(5):1582-1593. doi:10.1002/mrm.26059
12. Andersson JLR, Skare S, Ashburner J. How to correct susceptibility distortions in spin-echo echo-planar images: application to diffusion tensor imaging. Neuroimage. 2003;20(2):870-888. doi:10.1016/s1053-8119(03)00336-7
13. Andersson JLR, Sotiropoulos SN. An integrated approach to correction for off-resonance effects and subject movement in diffusion MR imaging. Neuroimage. 2016;125:1063-1078. doi:10.1016/j.neuroimage.2015.10.019
14. Zhang H, Schneider T, Wheeler-Kingshott CA, Alexander DC. NODDI: Practical in vivo neurite orientation dispersion and density imaging of the human brain. Neuroimage. 2012;61(4):1000-1016. doi:10.1016/j.neuroimage.2012.03.072
15. Schmierer K, Scaravilli F, Altmann DR, Barker GJ, Miller DH. Magnetization transfer ratio and myelin in postmortem multiple sclerosis brain. Ann Neurol. 2004;56(3):407-415. doi:10.1002/ana.20202
16. Bagnato F, Hametner S, Boyd E, et al. Untangling the R2* contrast in multiple sclerosis: A combined MRI-histology study at 7.0 Tesla. PLoS One. 2018;13(3):e0193839. doi:10.1371/journal.pone.0193839
17. Zhou Z, Tong Q, Zhang L, et al. Evaluation of the diffusion MRI white matter tract integrity model using myelin histology and Monte-Carlo simulations. Neuroimage. 2020;223:117313. doi:10.1016/j.neuroimage.2020.117313
18. Behrens TEJ, Woolrich MW, Jenkinson M, et al. Characterization and propagation of uncertainty in diffusion-weighted MR imaging. Magn Reson Med. 2003;50(5):1077-1088. doi:10.1002/mrm.10609
19. Harms RL, Fritz FJ, Tobisch A, Goebel R, Roebroeck A. Robust and fast nonlinear optimization of diffusion MRI microstructure models. Neuroimage. 2017;155:82-96. doi:10.1016/j.neuroimage.2017.04.064
20. Kunz N, Da Silva AR, Jelescu IO. Intra- and extra-axonal axial diffusivities in the white matter: Which one is faster? Neuroimage. 2018;181:314-322. doi:10.1016/j.neuroimage.2018.07.020
21. Alexander DC, Hubbard PL, Hall MG, et al. Orientationally invariant indices of axon diameter and density from diffusion MRI. Neuroimage. 2010;52(4):1374-1389. doi:10.1016/j.neuroimage.2010.05.043
22. Zhang H, Hubbard PL, Parker GJM, Alexander DC. Axon diameter mapping in the presence of orientation dispersion with diffusion MRI. Neuroimage. 2011;56(3):1301-1315. doi:https://doi.org/10.1016/j.neuroimage.2011.01.084
23. Dhital B, Reisert M, Kellner E, Kiselev VG. Intra-axonal diffusivity in brain white matter. Neuroimage. 2019;189:543-550. doi:10.1016/j.neuroimage.2019.01.015
24. Jespersen SN, Olesen JL, Hansen B, Shemesh N. Diffusion time dependence of microstructural parameters in fixed spinal cord. Neuroimage. 2018;182:329-342. doi:10.1016/j.neuroimage.2017.08.039
25. Chang YS, Owen JP, Pojman NJ, et al. White Matter Changes of Neurite Density and Fiber Orientation Dispersion during Human Brain Maturation. PLoS One. 2015;10(6):e0123656. doi:10.1371/journal.pone.0123656
Figures