4753
Single-Shell Free Water Imaging by Synthetic Q-Space Learning1Graduate School of Information Sciences, Hiroshima City University, Hiroshima, Japan, 2Hiroshima Heiwa Clinic, Hiroshima, Japan
Synopsis
Free water imaging (FWI) belongs to the dMRI family, and is an extention of the DTI model by adding the isotropic diffusion compartment. Conventionally, FWI parameters have been obtained by numerical fitting to measured signal values of DWI of single-shell or multi-shell. It has been reported that it is harder to obtain robust results in single shell data. Recently, machine learning techniques have shown promising results in dMRI parameter inference. In this study, we aimed at FWI parameter inference from single-shall dMRI data by using synthetic Q-space learning. Several validation experiments by quantitative and visual assessments were performed.
Introduction
Free water imaging (FWI) belongs to the diffusion MRI (dMRI) model family, and is an extention of the diffusion tensor imaging (DTI) model by adding the isotropic and constant diffusion compartment [1]. The original DTI captures water diffusion as a mixture of intra-cellular and extra-cellular compartments. However, when we need to see the details of diffusion environment, such as hydrocephalus ex vacuo caused by neural loss in Alzheimer's disease (AD), FWI is more useful. The FWI signal model equation is in a simple form by extending that of DTI, and the signal decay ratio of FWI; $$$E$$$ is expressed as;$$E=(1-f)\cdot\exp(-b\cdot g^{T}Dg)+f\cdot\exp(-b\cdot d_{fw})$$ where $$$b$$$ is the b-value, $$$g$$$ is MPG direction, $$$D$$$ is 2nd-order diffusion tensor with free water elimination, $$$f$$$ is volume fraction of isotropic diffusion compartment, and $$$d_{fw}$$$ is the fixed value of diffusion coefficient of free water; 3.0 x 10$$$^{-3}$$$ $$$mm^{2}/s$$$. Conventionally, those FWI parameters have been obtained by numerical fitting to measured signal values of diffusion weighted image (DWI) [1]. The DWI dataset can be in single-shell or multi-shell. However, the former requires a certain assumption [2] and it is harder to obtain robust results [3]. Recently, machine learning (ML) techniques have shown promising results in dMRI parameter inference [4]. Especially, training with synthetic data based on signal model equations and noise simulation showed certain advantages, which is called synthetic Q-space learning [5,6]. In this study, we aimed at FWI parameter inference from single-shall dMRI data by using synthetic Q-space learning. Several validation experiments by quantitative and visual assessments were performed.
Materials and Methods
We obtained single-shell data sets of healthy volunteer with 30, 72 and 150 Q-space samples with 1000 $$$s/mm^{2}$$$ of b-value, by using a clinical 3T scanner. For comparison, we used a two-shell data set of 72 Q-space samples provided with NODDI Matlab Toolbox [7]. Synthetic data sets were prepared for training and testing, according to the Q-space sample locations of the real data above. First, we randomly generated non diffusion-weighted signal $$$S_{0}$$$ (500~8000), eigenvectors (uniformly distributed) and eigenvalues (0.2~6.0 x 10$$$^{-3}$$$ $$$mm^{2}/s$$$) of $$$D$$$, and volume fraction of free water $$$f$$$ (0.0~1.0). Next, DWI signal $$$S$$$ for each Q-space sample location was obtained with the FWI signal model equation above. Then, the signals; $$$S_{0}$$$ and $$$S$$$ were contaminated with noise of the simple Rician model [8]. The signal value $$$S’$$$ contaminetd with Rician noise of standard deviation; $$$σ$$$ is; $$$S'=\sqrt{S^2+N(0,\sigma)^2}$$$. In this study, we defined noise level by $$$σ/S_{0}$$$, and prepared data sets with the level of 0.00, 0.01, and 0.05. A single sample of synthetic data consists of gold standard values of mean diffusivity (MD) and fractional anisotropy (FA) of $$$D$$$ and $$$f$$$ with $$$E’=S’/S_{0}’$$$ at all the Q-space sample locations. Finally, five million sample sets for each noise level were generated for both training and testing with different random seeds. We employed the multi-layer perceptron (MLP) for regressors, which outputs a single FWI model parameter; MD, FA or $$$f$$$. Note that the parameter inference was performed in voxel-by-voxel manner in this scheme. Based on our preliminary experiments, logarithm values of $$$E’$$$ were used for the inputs. The dimension of the MLP is; five layers in total, input units of Q-space sample number; 200, 400 or 800 in the three mid-layers for 30, 72 or 150 Q-space samples respectively, and a single unit for the output. The other training settings are; activation function of ReLU, 100 epochs, 10000 batches and no dropouts.Results and Summary
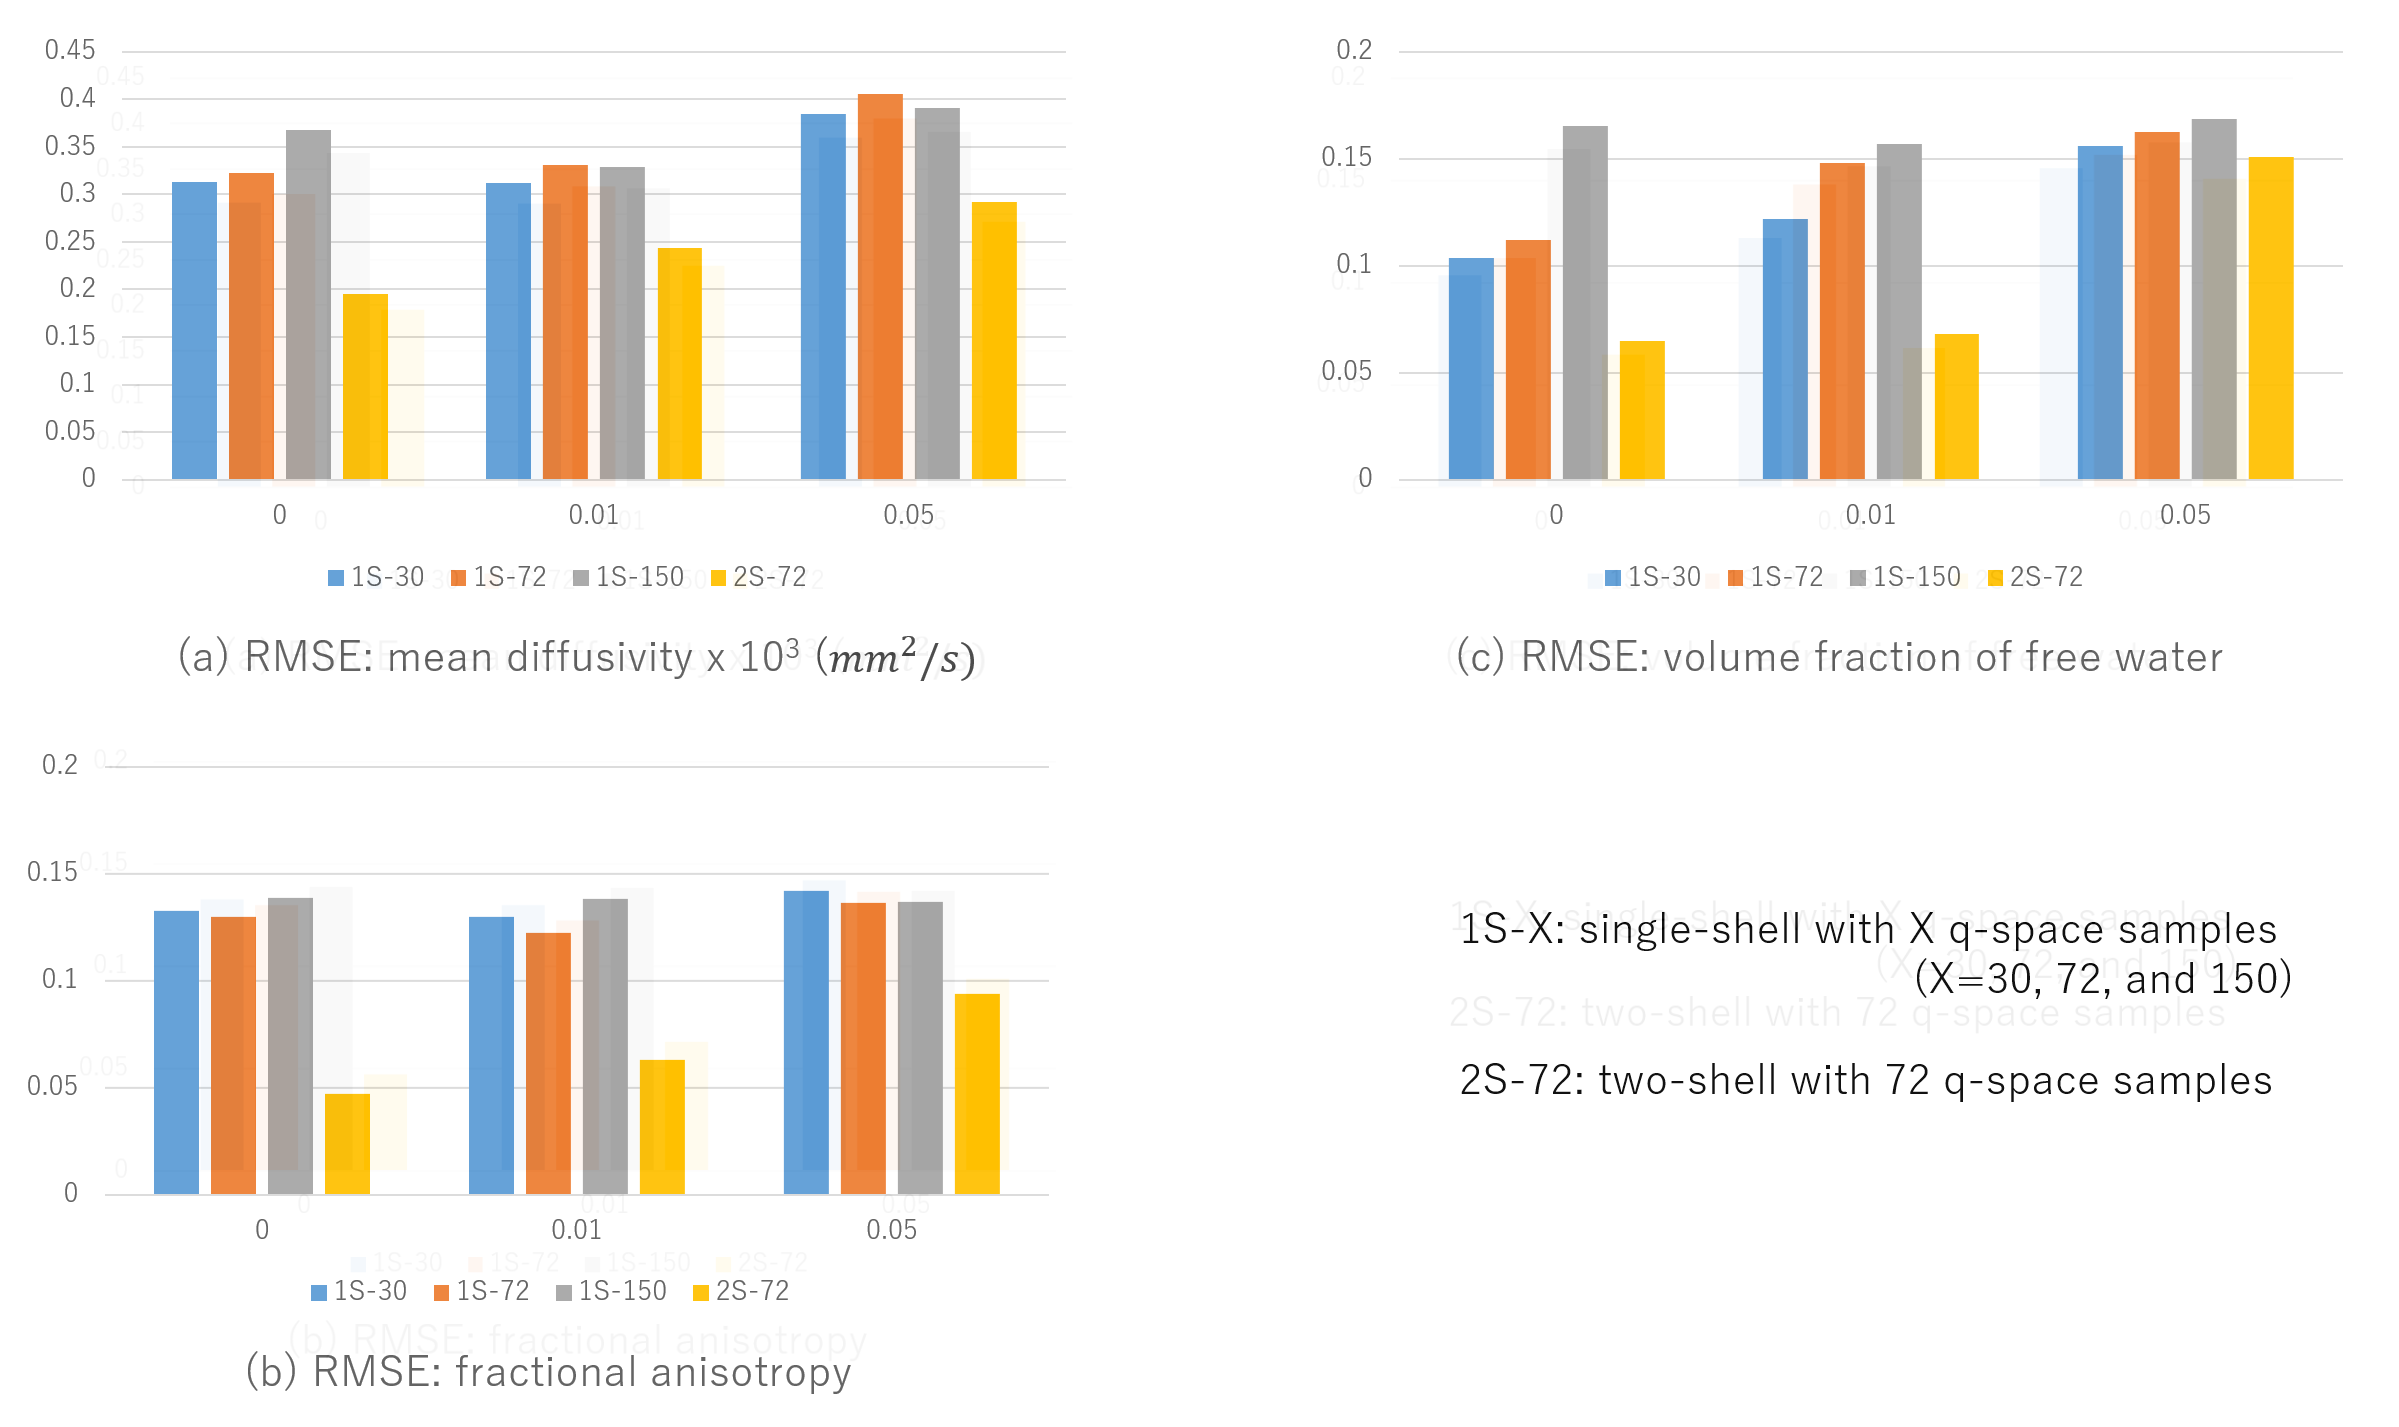
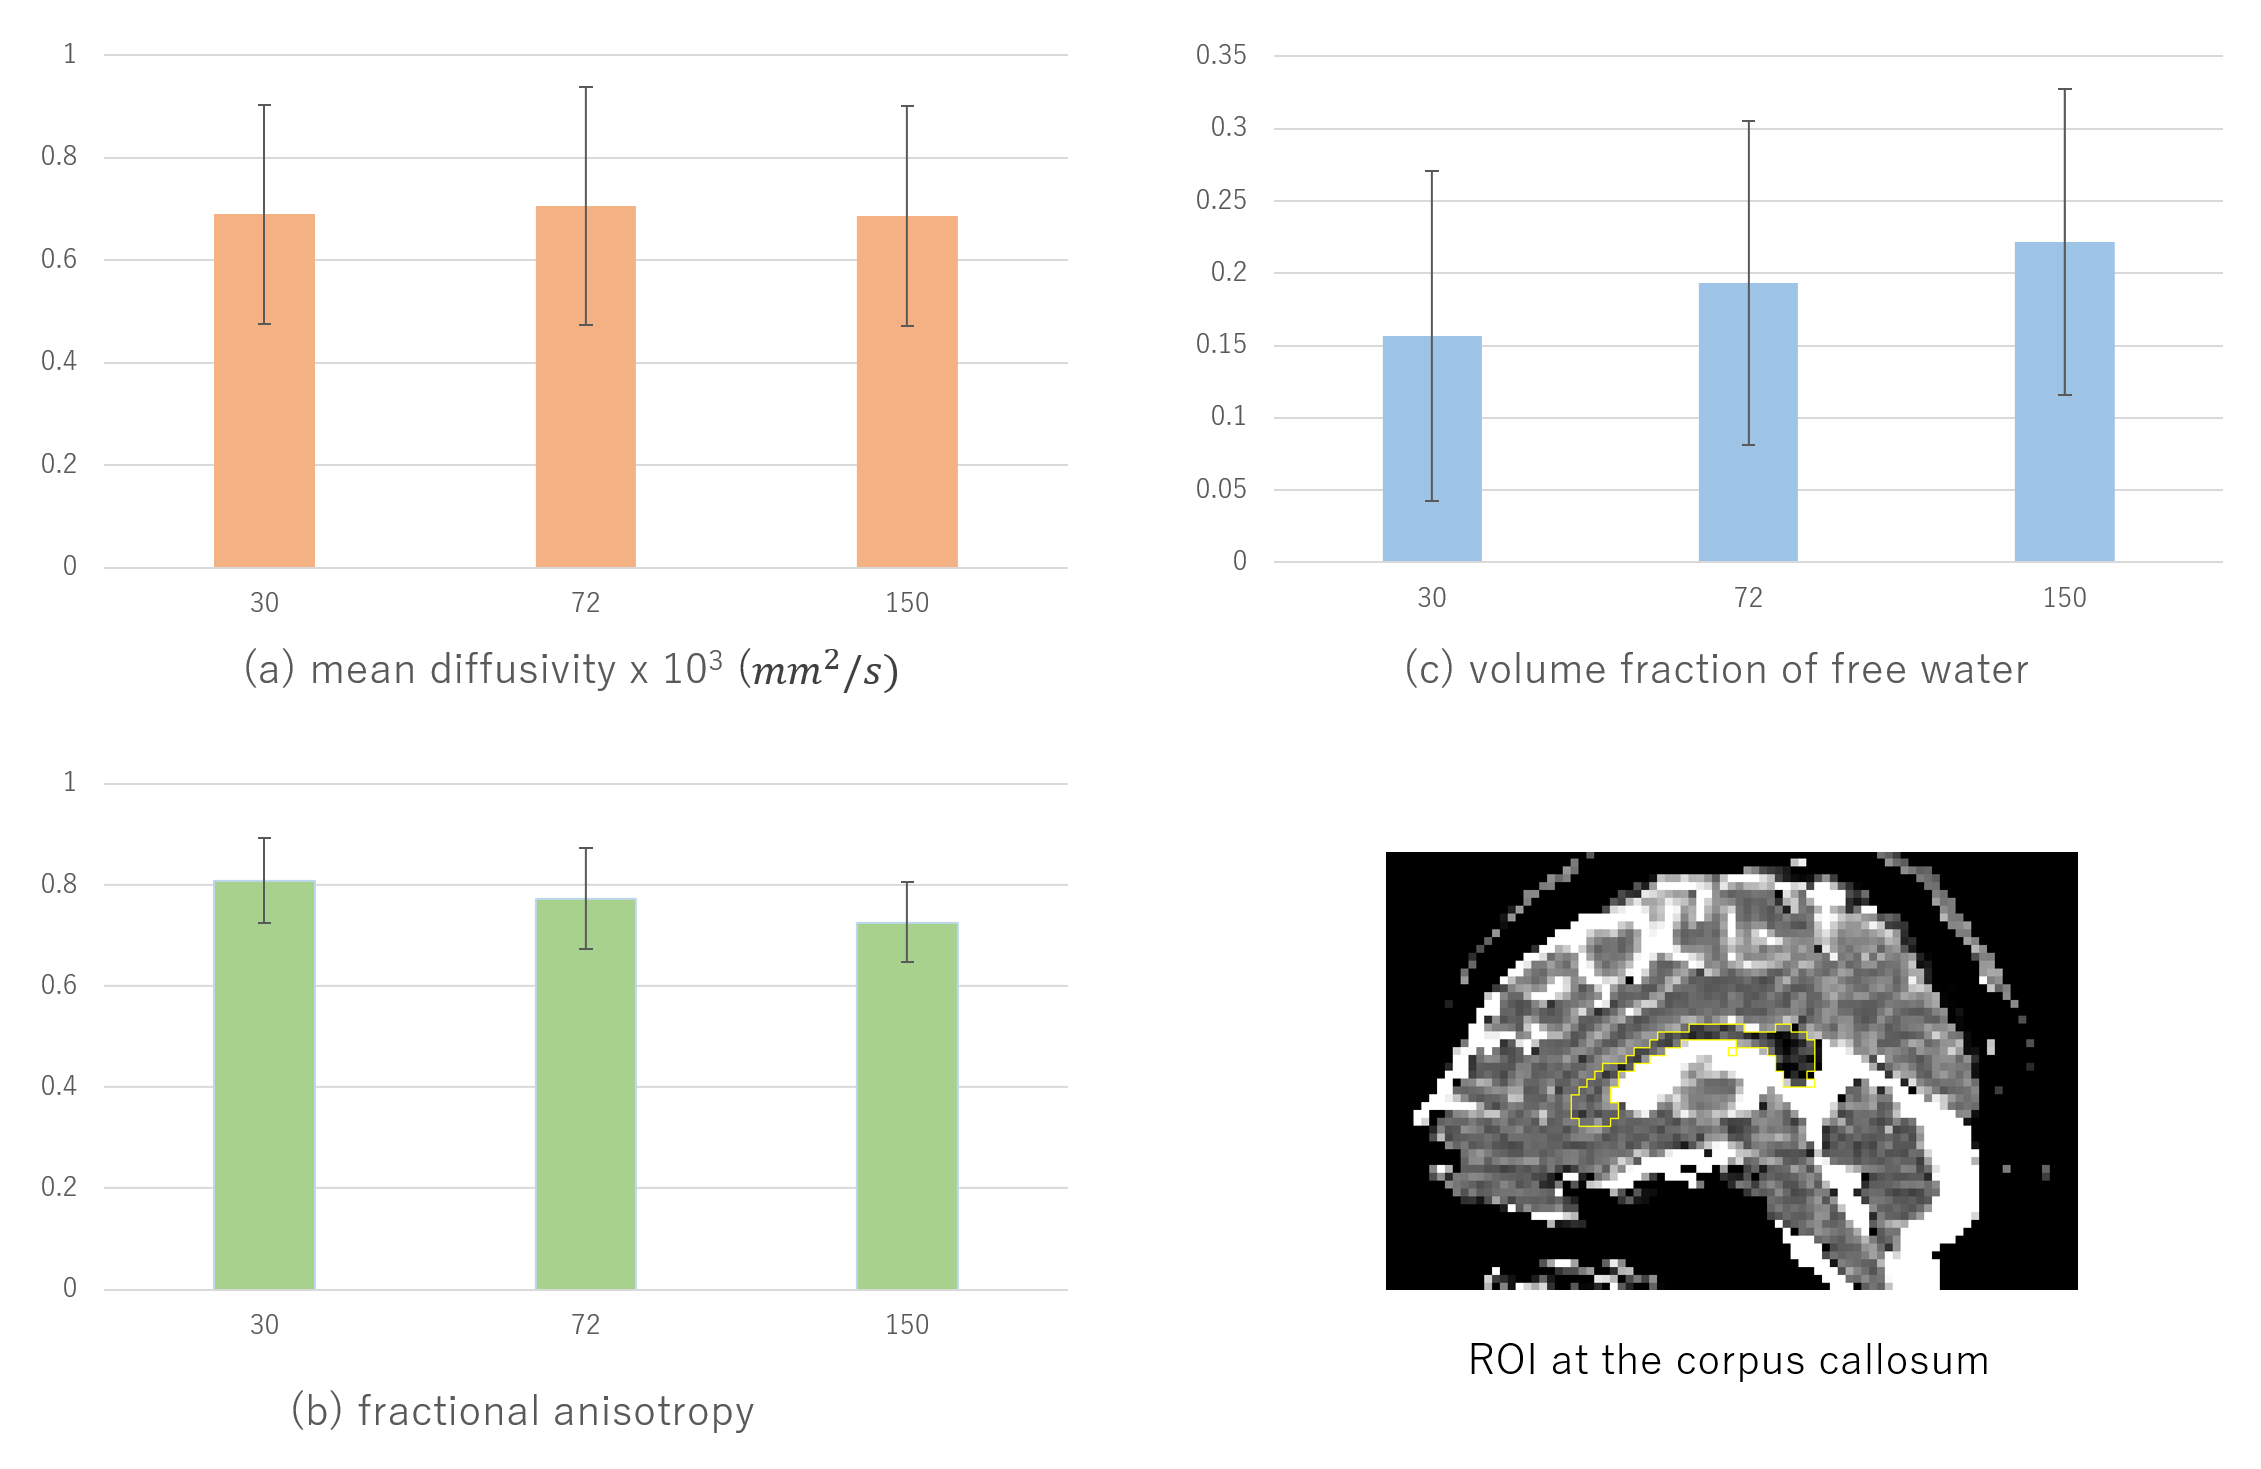
Quantitative assessments were performed with the synthetic test data by root mean square errors (RMSE). Note that we used the same noise level between training and testing based on the previous study [6]. Fig.1 shows the RMSE for the all the data sets. It is natural that the RMSE increases according to elevation of noise level, and the single-shell errors were larger than those of two-shell. For all the parameters inferred for the single-shell data, the error ranged 5-20% of the true value range while those of the two-shell are lower than 10%. Also, it is interesting that more MPG directions might not necessarily yield robust results. Especially, more MPG directions yielded higher RMSE for $$$f$$$, and further investigation is needed. Before visual assessments, the optimal noise level; 0.05 was confirmed as shown in Fig.2. Also, parameter inference for the real two-shell data was performed for reference (Fig.3). Fig.4 shows parameter map of MD, FA and $$$f$$$ in the coronal plane including the corticospinal tract (CST) for the real single-shell data (30, 72 and 150) by training noise level of 0.05. High FA and low $$$f$$$ were observed at the CST with some variations. Then, for quantitative assessment, inferred values were compared within the corpus callosum (Fig.5). The inferred parameters were slightly different due to number of MPG directions except MD. In summary, our study implies single-shell FWI by synthetic Q-space learning is feasible though it is harder than that in two-shell data. Currently, further investigations are in progress by use of more data sets with various training settings, comparison with other inference methods by fitting, and comparison with other models including free water compartment such as NODDI [9] .Acknowledgements
The authors are grateful for all the research collaborators for valuable comments, advice and discussion. This research was partially supported by JST CREST Grant #JPMJCR15D1 and JSPS KAKENHI #21K12650.References
1. Pasternak O, et al., Free Water Elimination and Mapping from Diffusion MRI, Magn Reson Med 62:717–730, 2009
2. Bergmann Ø, et al., Fast and accurate initialization of the free-water imaging model parameters from multi-shell diffusion MRI, NMR Biomed 33(3):e4219, 2020
3. Pasternak O, et al., The Estimation of Free-Water Corrected Diffusion Tensors, Visualization and Processing of Tensors and Higher Order Descriptors for Multi-Valued Data, pp.249-270, Springer, 2014
4. Golkov V, et al., Q-space deep learning: twelve-fold shorter and model-free diffusion MRI scans, IEEE Trans Med Img 35(5): 1344–1351, 2016
5. Ye C, et al., Q-space learning with synthesized training data, Proc. CDMRI 2018, Sep. 2018.
6. Masutani Y. Noise level matching improves robustness in diffusion MRI parameter inference by synthetic Q-space learning, proc. IEEE ISBI 2019, 2019
7. NODDI Matlab Toolbox, http://mig.cs.ucl.ac.uk/index.php?n=Tutorial.NODDImatlab
8. Jensen JH, et al., Diffusional kurtosis imaging: the quantification of non-Gaussian water diffusion by means of magnetic resonance imaging. Magn Reson Med 53:1432–1440, 2005
9. Zhang H, et al., NODDI: Practical in-vivo neurite orientation dispersion and density imaging of the human brain, NeuroImage 61:1000–1016, 2012
Figures