4751
MPPCA denoising before GRAPPA reconstruction improves the precision of microscopic anisotropy in the gray matter1Department of Radiology, Juntendo University, Tokyo, Japan, 2Department of Radiology, Toho University, Tokyo, Japan, 3Department of Radiology, The University of Tokyo, Tokyo, Japan, 4Department of Radiological Sciences, Komazawa University, Tokyo, Japan, 5Siemens Healthcare K.K., Tokyo, Japan, 6Siemens Healthcare GmbH, Erlangen, Germany
Synopsis
The ability of double diffusion encoding to estimate tissue microscopic anisotropy has gained increasing attention in clinical studies. However, the estimation of smaller values of microscopic anisotropy is known to be less precise, posing a challenge for clinical translation because many tissues of interest including the gray matter exhibit smaller values. In this study, we adopted the recently proposed denoising strategy where Marcenko‐Pastur principal component analysis (MPPCA) is applied to coil data before GRAPPA reconstruction. The results suggested this strategy is effective for improving the scan-rescan repeatability of microscopic anisotropy in the gray matter.
Introduction
Double diffusion encoding (DDE) has gained increasing attention in biomedical studies 1. One of the unique metrics available with DDE is microscopic anisotropy (μA), or its normalized version (microscopic fractional anisotropy [μFA]) 2,3. While clinical studies investigating the utility of μFA are emerging 4,5, precision issues have been pointed out 6 due to the limited SNR, in tissues with smaller values of μFA like gray matter. Nevertheless, μFA of the gray matter is an attractive target for both basic and clinical research 7,8. To boost SNR, a common practice is to apply noise reduction algorithms like Marcenko‐Pastur principal component analysis (MPPCA) 9. Recently, enhancement of denoising performance was proposed for MPPCA 10,11 by accounting for the noise correlations induced by filling the under-sampled k-space data 10,12. In this study, we compared the precision of μFA in terms of scan-rescan repeatability among three different denoising strategies; 1) no denoising, 2) standard MPPCA applied to magnitude image, 3) MPPCA applied to coil data before GRAPPA reconstruction.Methods
Participants: Five healthy volunteers (4 males and 1 female, aged 27-39 years) underwent two scanning sessions on the same day. The Institutional Review Board approved this study.Image Acquisition: All MRI data were acquired using a 3T system (MAGNETOM Prisma, Siemens Healthcare, Erlangen, Germany) equipped with a 32-channel head coil. The DDE data was acquired using a twice-refocused spin-echo DDE prototype sequence 13 with diffusion-sensitizing gradient scheme according to the 5-design 2. Each diffusion-sensitizing block had an equal magnitude (b = 750 s/mm2, ⊿ = 27.9 ms, δ = 13.5 ms) and was separated by a mixing time of 8.1 ms. The other scan parameters included TE = 105 ms, TR = 5700 ms, 2.2 mm3 isotropic voxel, 68 slices, SMS acceleration factor 2, GRAPPA in-plane acceleration factor 3, and partial Fourier 6/8. Six b=0 volumes, interspersed every 14 diffusion-weighted volumes, were also acquired. We also acquired one b=0 volume with reversed phase encoding. The scan time for DDE was about 8.5 minutes. In each session, we also acquired structural T1-weighted images (T1w) using a 3D MPRAGE sequence.
Image reconstruction and denoising: We compared among three conditions (Figure 1).
1) No denoising (‘Original’)
2) MPPCA applied to the magnitude image (‘MPPCA’)
The reconstructed magnitude images were denoised by applying MPPCA to the matrix with size $$$N_x{\times}N_r$$$ ($$$N_x$$$: the number of voxels in the $$$5{\times}5{\times}5$$$ spatial patch, $$$N_r$$$: the number of image volumes).
3) MPPCA applied before GRAPPA reconstruction (‘Coil-MPPCA’)
The k-space data in the middle of reconstruction were extracted. After phase estimation and unwinding, MPPCA was applied to the matrix with size $$$(N_x{\times}N_c){\times}N_r$$$ ($$$N_c$$$: number of coils), considering only the sampled k-space lines. Then, the denoised coil data was restored to its original k-space format to undergo the remaining steps of reconstruction. To deal with data before GRAPPA reconstruction, dMRI images were reconstructed from the raw data using Gadgetron 14. For fair comparison, both 1) Original and 2) MPPCA used magnitude images reconstructed with Gadgetron, too.
Image processing: The reconstructed and denoised dMRI images were corrected for Gibbs artifact 15, eddy currents and motion 16, B1 inhomogeneity 17, and signal drift 18. The measures of microscopic anisotropy were computed as 1-3,6 $${\mu}A^{2}=\log\left(\frac{\overline{S_{\parallel}}}{\overline{S_{\perp}}}\right)b^{-2}$$ $${\mu}FA^{2}=\frac{3}{2}\frac{{\mu}A^{2}}{{\mu}A^{2}+\frac{3}{5}MD^{2}}$$, where $$$S_{\parallel}$$$ and $$$S_{\perp}$$$ is the powder average of the signals acquired with parallel and orthogonal diffusion-sensitizing gradient pairs, respectively. The T1w was linearly registered to the pre-processed dMRI and processed using FreeSurfer.
Regions of interests (ROIs): ROIs representing cortex with higher myelin content 19 (the primary motor area, the primary sensory area, the primary visual area, the posterior cingulate), cortex with lower myelin content 19 (the rostral-anterior cingulate and the insula), and the subcortical gray matter (the putamen) were selected using Brodmann atlas and Desikan-Killiany atlas.
Statistical analyses: The precision was evaluated by test-retest variability (TRV) defined for a parameter $$$\theta$$$ as
$$TRV=\frac{\sqrt{\pi}}{2}\frac{1}{N}\sum_{i=1}^{N}\frac{|\Delta_{\theta}|}{\mu_{\theta}}$$, where $$$N$$$ is the number of subjects, $$$\mu_{\theta}$$$ is the mean of two sessions, and $$$\Delta_{\theta}$$$ is the difference between the sessions. Within-ROI heterogeneity was evaluated using the coefficient of variation (CV).
Results
- Figure 2 shows representative diffusion-weighted images. Coil-MPPCA yielded greater SNR gain than MPPCA.
- Without denoising, μA2 and μFA2 maps were noisy with many voxels having negative values. The appearance was improved with MPPCA and Coil-MPPCA (Figure 3).
- ROI-wise μA2 and μFA2 demonstrated contrast among different anatomical regions, where MD and FA showed little differences (Figure 4). Greater values of μA2 and μFA2 were observed in the cortices with higher myelin content, consistent with the previous study 19.
- Both TRV and within-ROI CV of μA2 and μFA2 were reduced by denoising, especially by Coil-MPPCA (Figure 4).
- Figure 5 shows Bland-Altman plots for voxel-wise comparison between the two sessions.
Discussion & Conclusion
Applying MPPCA prior to GRAPPA reconstruction is effective for improving the precision of μFA in the gray matter, especially in regions with smaller values of μFA. Small values of μFA are encountered not only in the gray matter but also in many targets of clinical studies, like diseased white matter 4,19 and tumors 20. We expect the present results to aid future studies searching for the potential of μFA as a clinical biomarker.Acknowledgements
This study was supported by Japan Society for the Promotion of Science (JSPS) [21K07629].References
1. Henriques RN, Palombo M, Jespersen SN, et al. Double diffusion encoding and applications for biomedical imaging. J Neurosci Methods 2021;348:108989.
2. Jespersen SN, Lundell H, Sønderby CK, et al. Orientationally invariant metrics of apparent compartment eccentricity from double pulsed field gradient diffusion experiments. NMR Biomed 2013;26:1647–62.
3. Jespersen SN, Lundell H, Sønderby CK, et al. Erratum: Orientationally invariant metrics of apparent compartment eccentricity from double pulsed field gradient diffusion experiments. NMR Biomed 2014;27:738–738.
4. Yang G, Tian Q, Leuze C, et al. Double diffusion encoding MRI for the clinic. Magn Reson Med 2018;80:507–20.
5. Kamiya K, Kamagata K, Ogaki K, et al. Brain White-Matter Degeneration Due to Aging and Parkinson Disease as Revealed by Double Diffusion Encoding. Front Neurosci 2020;14:584510.
6. Kerkelä L, Henriques RN, Hall MG, et al. Validation and noise robustness assessment of microscopic anisotropy estimation with clinically feasible double diffusion encoding MRI. Magn Reson Med 2020;83:1698–710.
7. Lawrenz M, Finsterbusch J. Detection of microscopic diffusion anisotropy in human cortical gray matter in vivo with double diffusion encoding. Magn Reson Med 2019;81:1296–306.
8. Lawrenz M, Brassen S, Finsterbusch J. Microscopic diffusion anisotropy in the human brain: Age-related changes. Neuroimage 2016;141:313–25.
9. Veraart J, Novikov DS, Christiaens D, et al. Denoising of diffusion MRI using random matrix theory. Neuroimage 2016;142:394–406.
10. Cordero-Grande L, Christiaens D, Hutter J, et al. Complex diffusion-weighted image estimation via matrix recovery under general noise models. Neuroimage 2019;200:391–404.
11. Lemberskiy G, Baete SH, Veraart J, et al. Achieving sub-mm clinical diffusion MRI resolution by removing noise during reconstruction using random matrix theory. In: Proc ISMRM.; 2019:0770.
12. Sprenger T, Sperl JI, Fernandez B, et al. Real valued diffusion-weighted imaging using decorrelated phase filtering. Magn Reson Med 2017;77:559–70.
13. Novello L, Tambalo T, Feiweier T, et al. Double-Diffusion-Encoding MRI: phantom evaluation of concomitant gradient effects with single- and twice-refocused sequences. In: Proc ISMRM.; 2020:4502.
14. Hansen MS, Sørensen TS. Gadgetron: an open source framework for medical image reconstruction. Magn Reson Med 2013;69:1768–76.
15. Lee H-H, Novikov DS, Fieremans E. Removal of partial Fourier-induced Gibbs (RPG) ringing artifacts in MRI. Magn Reson Med 2021;86:2733-50.
16. Andersson JLR, Sotiropoulos SN. An integrated approach to correction for off-resonance effects and subject movement in diffusion MR imaging. Neuroimage 2016;125:1063–78.
17. Tustison NJ, Avants BB, Cook PA, et al. N4ITK: improved N3 bias correction. IEEE Trans Med Imaging 2010;29:1310–20.
18. Vos SB, Tax CMW, Luijten PR, et al. The importance of correcting for signal drift in diffusion MRI. Magn Reson Med 2017;77:285–99.
19. Lampinen B, Szczepankiewicz F, Novén M, et al. Searching for the neurite density with diffusion MRI: Challenges for biophysical modeling. Hum Brain Mapp 2019;40:2529–45.
20. Szczepankiewicz F, van Westen D, Englund E, et al. The link between diffusion MRI and tumor heterogeneity: Mapping cell eccentricity and density by diffusional variance decomposition (DIVIDE). Neuroimage 2016;142:522–32.
Figures
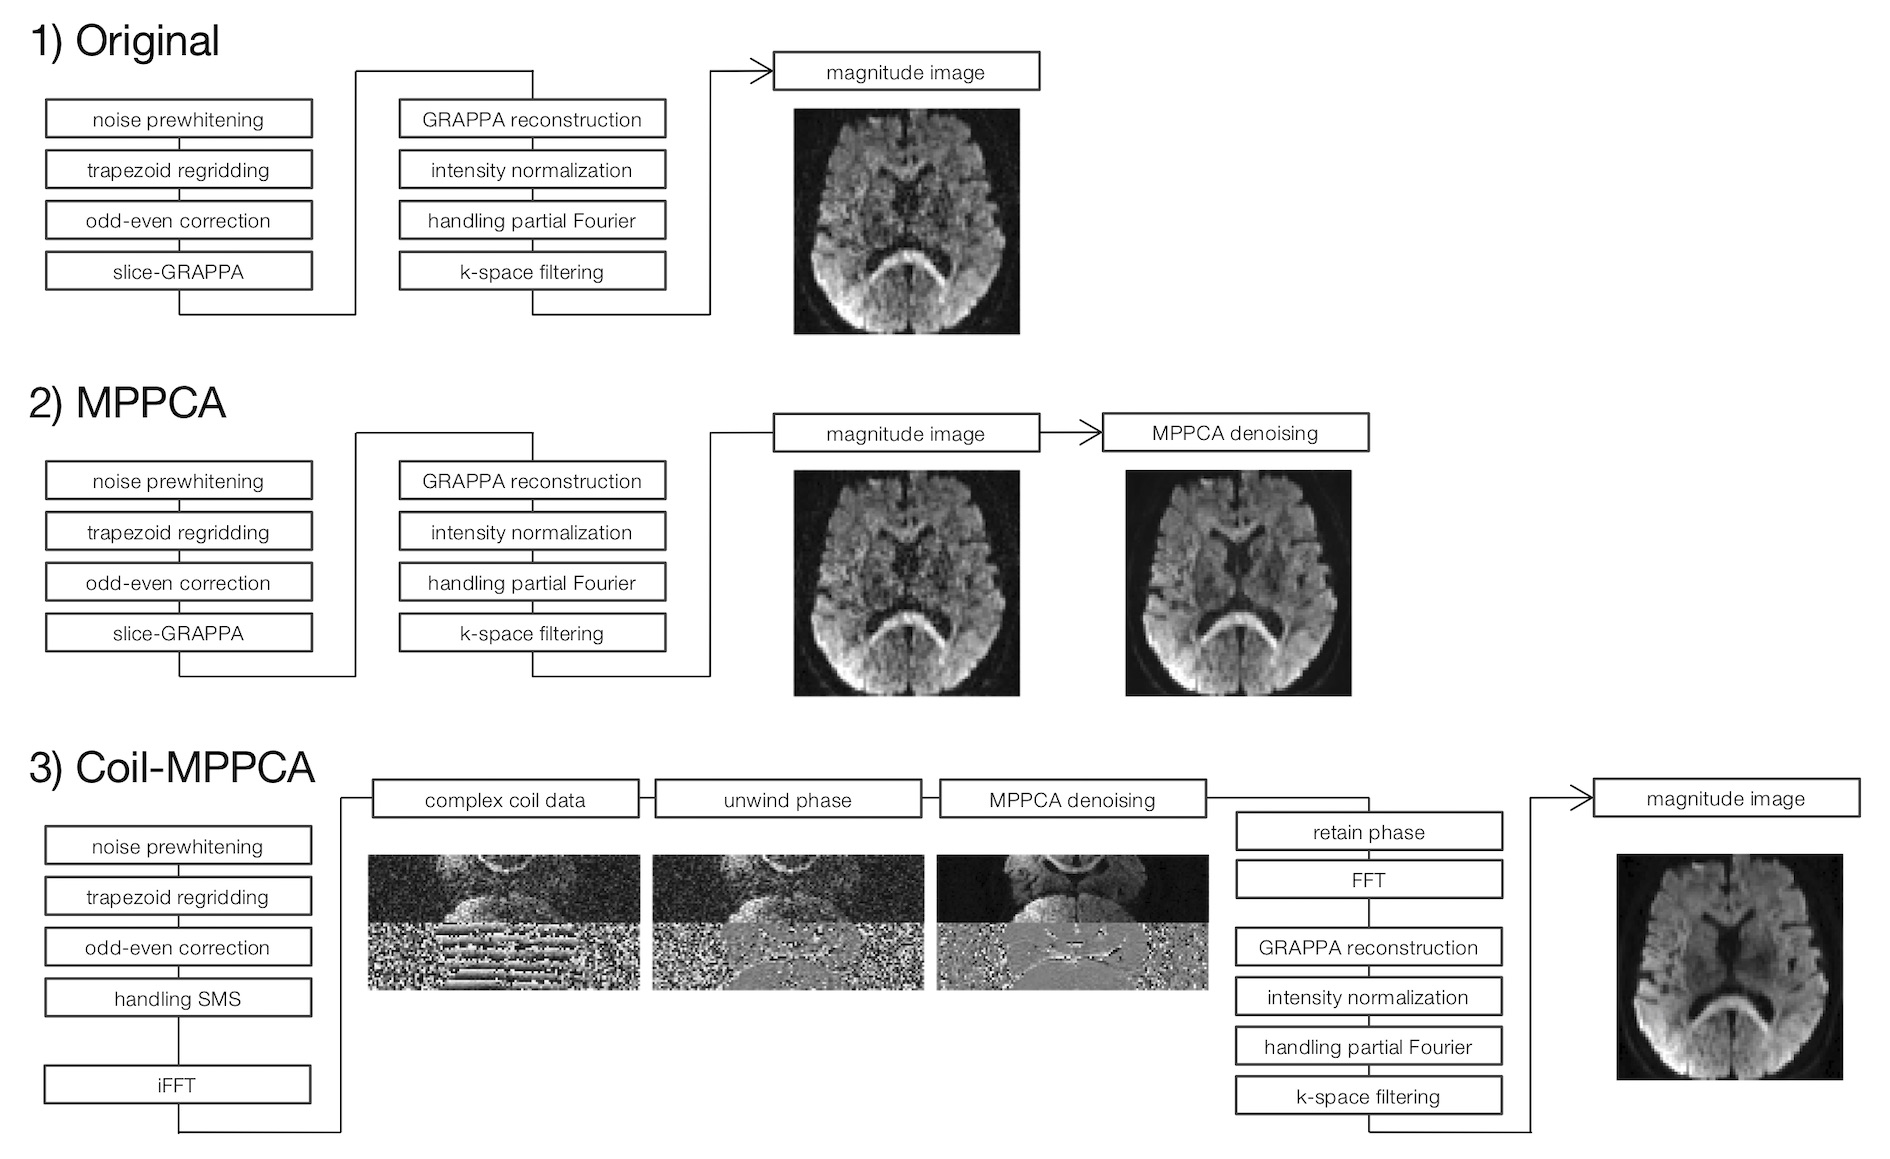
Figure 1 Three conditions of denoising were compared in this study. 1) Original: The reconstructed magnitude images were used without denoising. 2) MPPCA: The reconstructed magnitude images were denoised using MPPCA. 3) Coil-MPPCA: The k-space data before GRAPPA reconstruction were extracted, denoised with MPPCA, and then returned to the reconstruction pipeline.
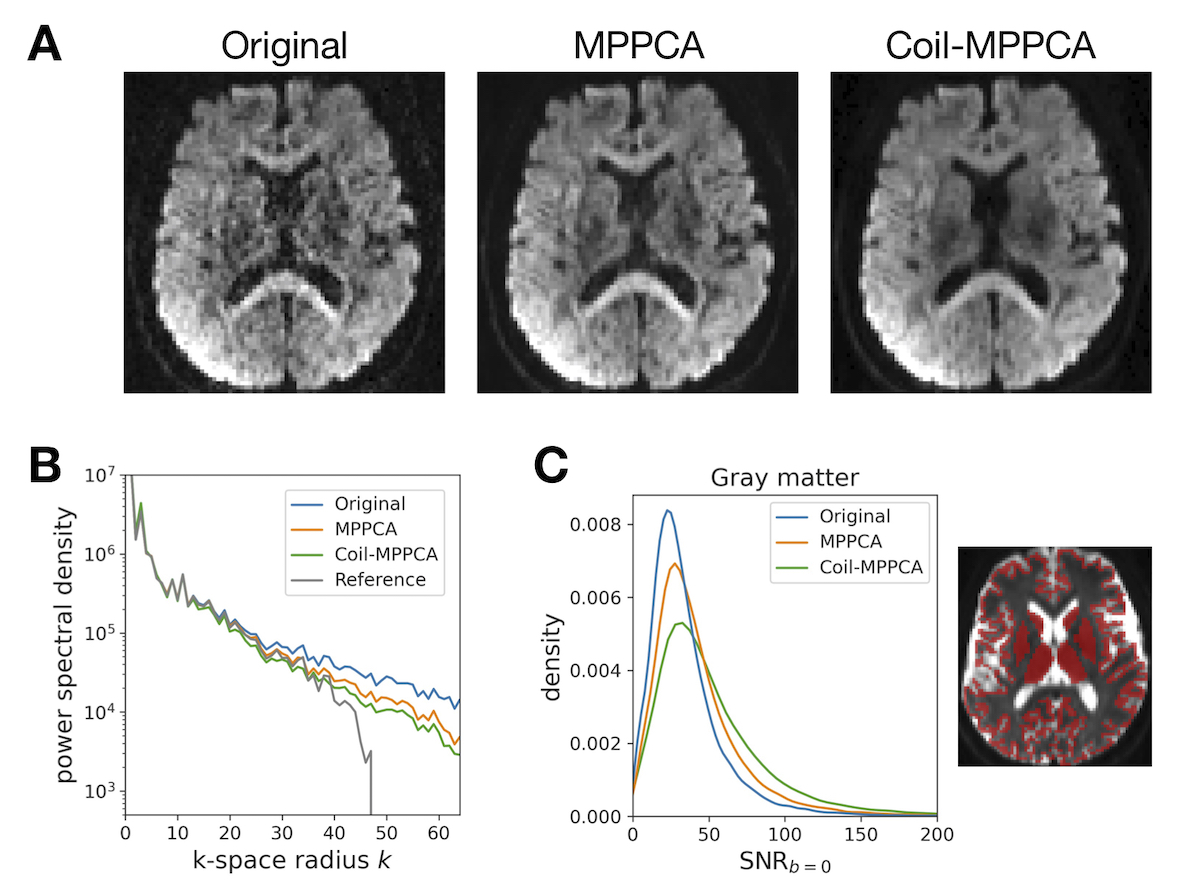
Figure 2 (A) Representative diffusion-weighted images after the denoising step. (B) Power spectral density of the images shown in (A). The gray line shows the reference power spectral density predicted from Original and the noise power σ2 estimated by MPPCA (see REF 9). Both MPPCA and Coil-MPPCA suppress noise without over-removing the higher frequencies. (C) Histogram showing SNR in the gray matter voxels (calculated from the six b=0 images).
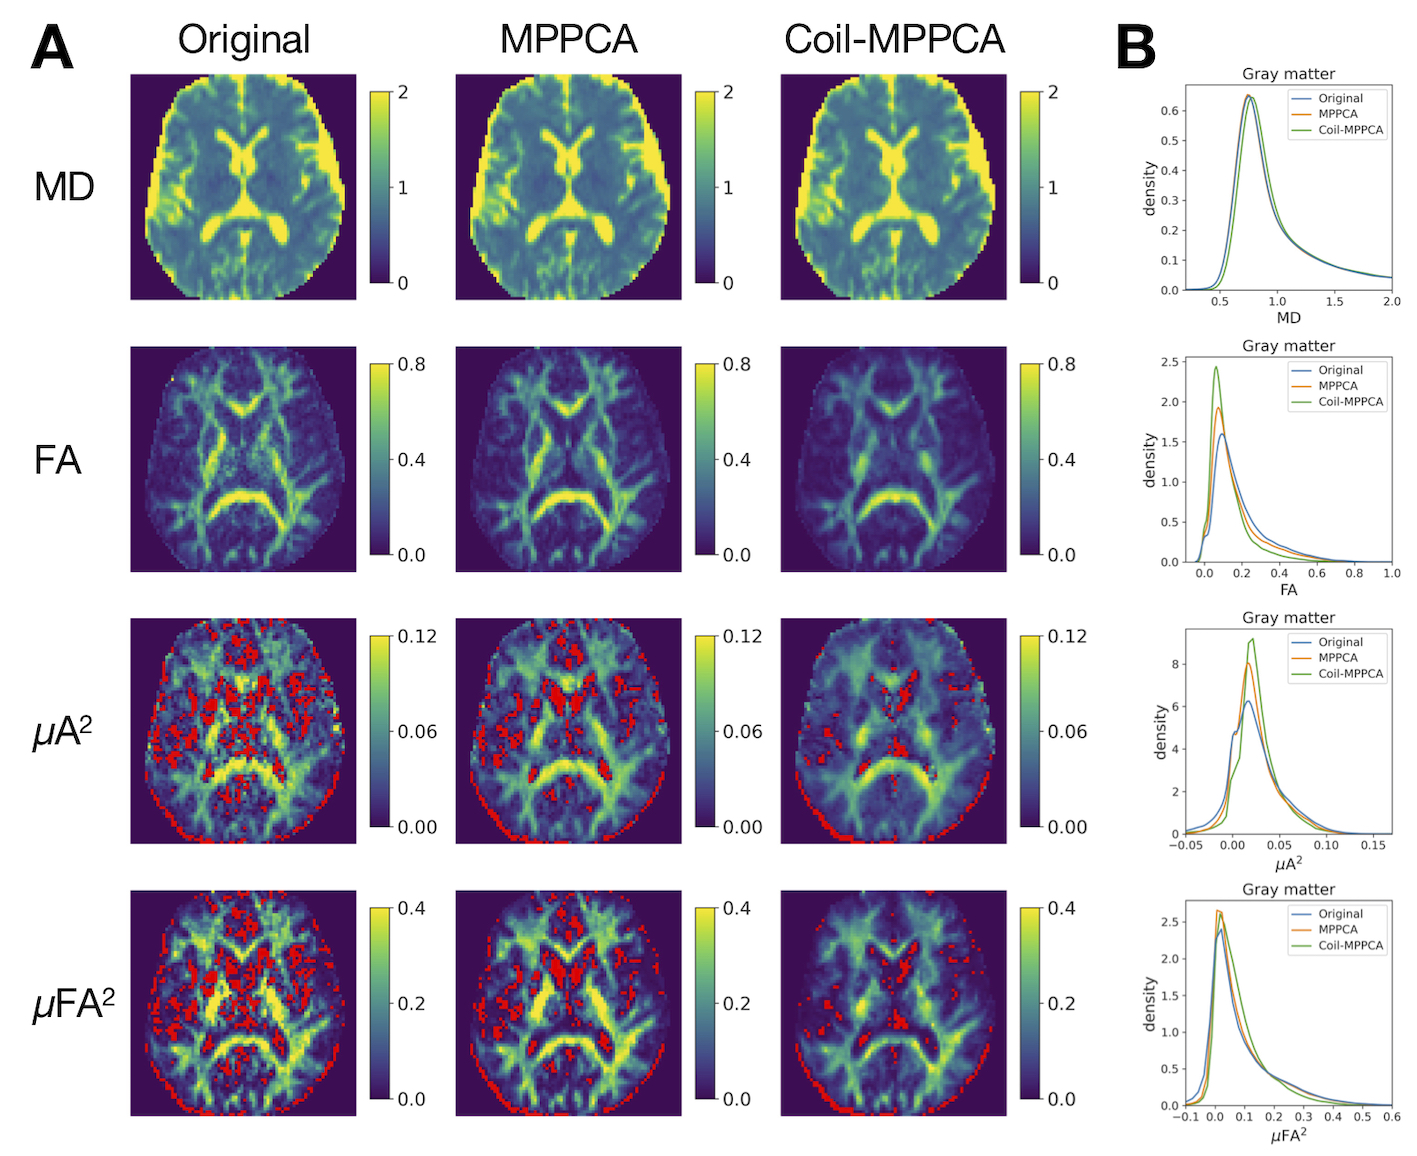
Figure 3 (A) Maps of the diffusion metrics in a representative subject. Voxels with negative values of μA2 and μFA2 are shown in red color. (B) Histograms of voxel values in the gray matter mask.
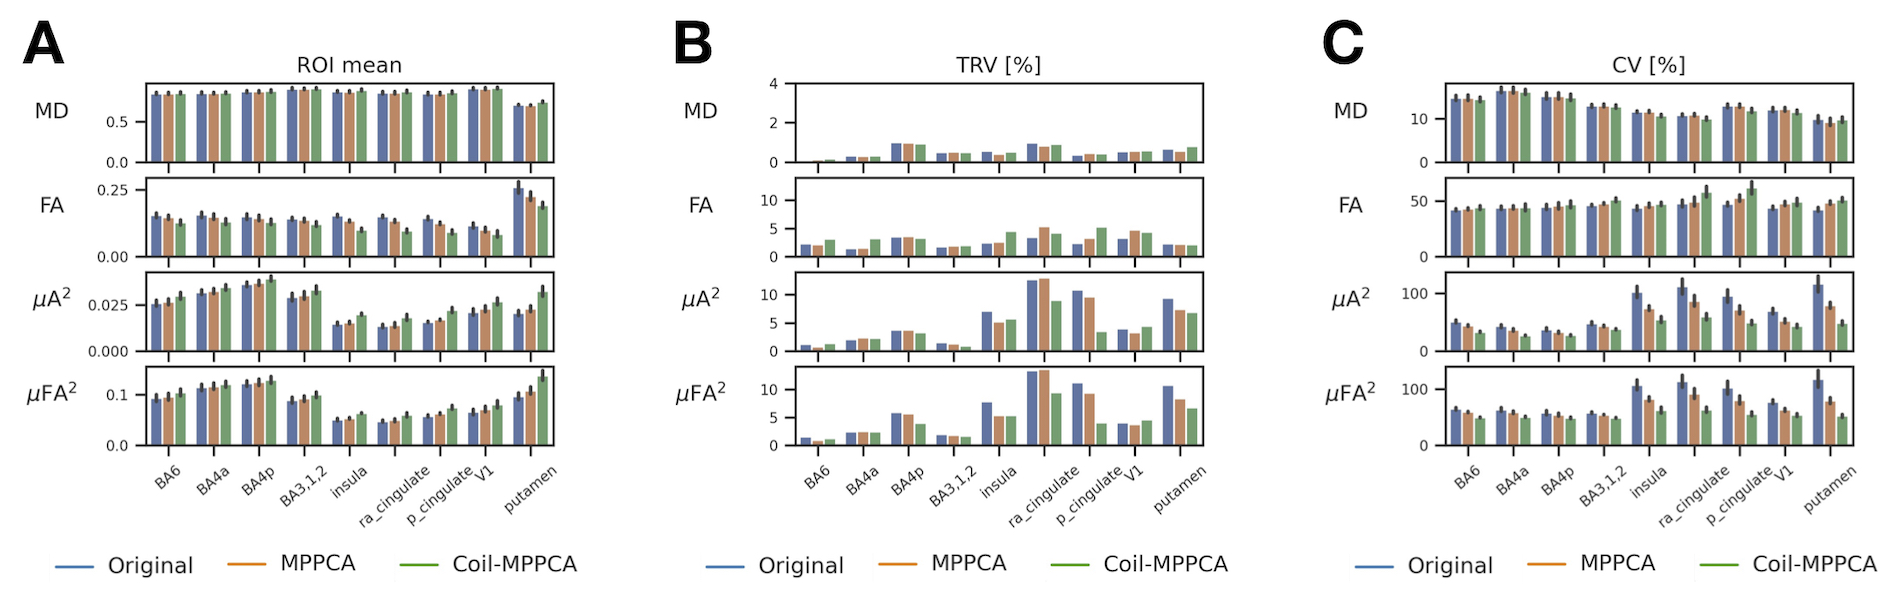
Figure 4 ROI-based analyses of the diffusion metrics. (A) The mean of two sessions. (B) Test-retest variability (TRV). (C) Within-ROI coefficient of variation (CV). The error bars indicate the standard deviation across subjects. BA = Brodmann area; p-cingulate = posterior cingulate; ra-cingulate = rostral-anterior cingulate; V1 = primary visual area.
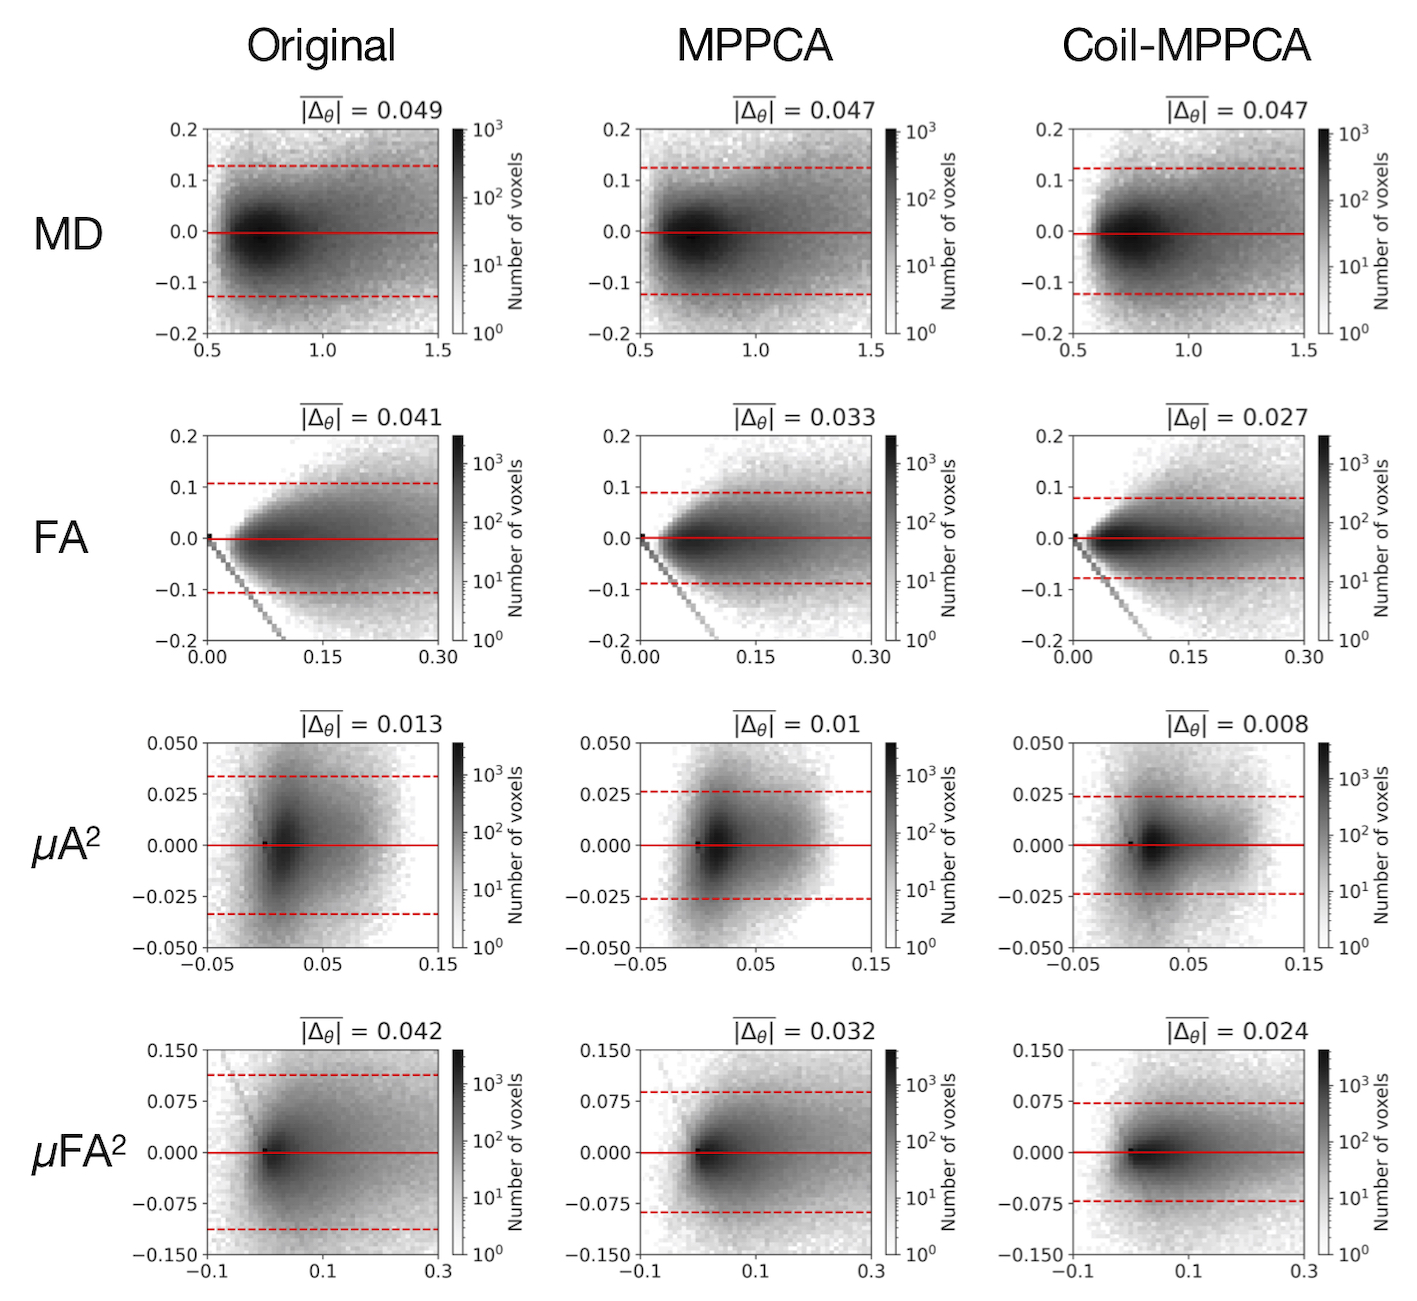
Figure 5 Bland-Altman plots (2D histogram, 50×50 bins) comparing voxel values within the gray matter mask between the two sessions. The images from the second session were registered to those from the first session by rigid transformation using ANTs. The red horizontal lines represent (mean difference) ± 1.96 × (standard deviation of the difference). The mean absolute difference between the two sessions is shown in the number above each plot.