4750
Discriminating Rectal Cancer Grades using Restriction Spectrum Imaging1Paul C. Lauterbur Centre for Biomedical Imaging, Shenzhen Institutes of Advanced Technology, Chinese Academy of Sciences, Shenzhen, China, 2Department of Radiology, Sun Yat-sen University Cancer Center, State Key Laboratory of Oncology in Southern China, Guangzhou, China, 3Central Research Institute, United Imaging Healthcare, Shanghai, China
Synopsis
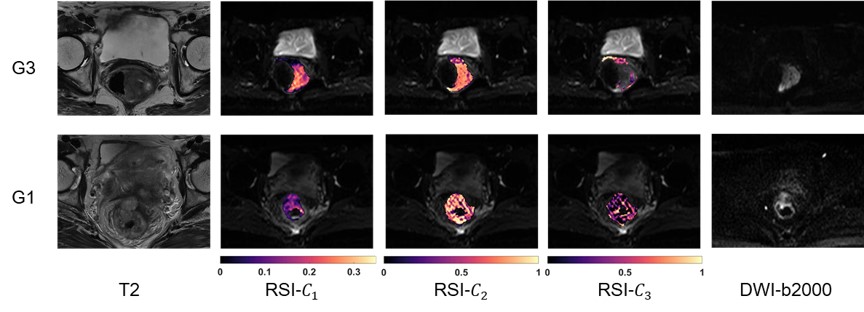
Restriction spectrum imaging (RSI) is a novel diffusion model that captures the distinct diffusion behavior of tumors. It separates water diffusion into several microscopic compartments. The restricted compartment correlating to the tumor cellularity is expected to be a potential indicator of rectal cancer aggressiveness. To assess the ability of RSI model for rectal tumor grading, we applied a three-compartment RSI model to DWI images of patients with different histopathological grades of rectal cancer. The RSI model demonstrated its ability to discriminate the rectal cancer of low and high grades, and the results outperforms the traditional ADC model and DKI model.
INTRODUCTION
Rectal cancer has become the fourth most common cancer and the second leading cause of mortality1, 2. Accurate localization and tumor grading are of great importance for the disease management3, 4. Diffusion-weighted MRI (DWI) has showed its power as an imaging biomarker of tumor aggressiveness and a treatment responder of chemoradiotherapy for rectal cancer5-9. Restriction spectrum imaging (RSI) is a novel DWI model that separates water diffusion into several microscopic compartments10, 11. The restricted compartment correlating to the tumor cellularity is expected to be a potential indicator of rectal cancer aggressiveness12, 13. To assess the ability of RSI model for rectal tumor grading, we applied a three-compartment RSI model to DWI images of patients with different histopathological grades of rectal cancer and compared it to the traditional DKI and ADC models.METHODS
Fifty-eight patients with different rectal cancer grading confirmed by biopsy were involved in this retrospective study. DWI acquisitions were performed on a 3T whole-body scanner (uMR 780, Shanghai United Imaging Healthcare, Shanghai, China) using a combination of a body coil and a spine coil. DWI was performed using Single Shot-Echo Planar Imaging (SS-EPI) at b values of 0 – 2000 s/mm2 with 3 directions at each respective nonzero b value. Other parameters of DWI were: TR/TE = 4600.0/86.2 ms, FOV = 180 × 240 mm2, matrix = 168 × 224, slice thickness = 4 mm, intersection gap = 1 mm, number of slices = 20, scanning time = 5 min, average number for each b value = 3. DWI data underwent several corrections including eddy current, motion, and EPI distortion correction by TORTOISE14, 15. Cancer ROIs were delineated manually on DWI images under supervision of two experienced radiologists who were blinded to the results of histopathological examination. The RSI model used in this study separates water diffusion into 3 different compartments, including one compartment of restricted diffusion, one compartment of hindered diffusion, and one compartment of free water diffusion. It is represented as the combination of multiple exponential attenuation functions:$$S(b)=C_{1}e^{-bD_{1}}+C_{2}e^{-bD_{2}}+C_{3}e^{-bD_{3}}, D_{1}<D_{2}<D_{3}$$
S(b) represents the signal attenuation at each b-value by dividing the DWI images to the S0 image (b = 0). C1, C2, and C3 are the volume fractions of restricted diffusion, hindered diffusion, and free water diffusion compartments, respectively. D1, D2, and D3 denote the ADCs of the corresponding compartments. They were globally determined as 0.5×10⁻³ mm2/s, 1.3×10⁻³ mm2/s, and 3.0×10⁻³ mm2/s. The values are determined based on theoretical values and experimental trials16. The restricted diffusion coefficient was set to 0.5×10⁻³ mm2/s referring to the previous study17. The theoretical value of free water diffusion was set to 3.0×10⁻³ mm2/s16. The value of D2 in RSI model was set to the fitting results of “pure tissue diffusion” estimated from the ADC model18, which was found to be 1.3×10⁻³ mm2/s. The D values were determined and fixed to prevent overfitting16 during the fitting process.
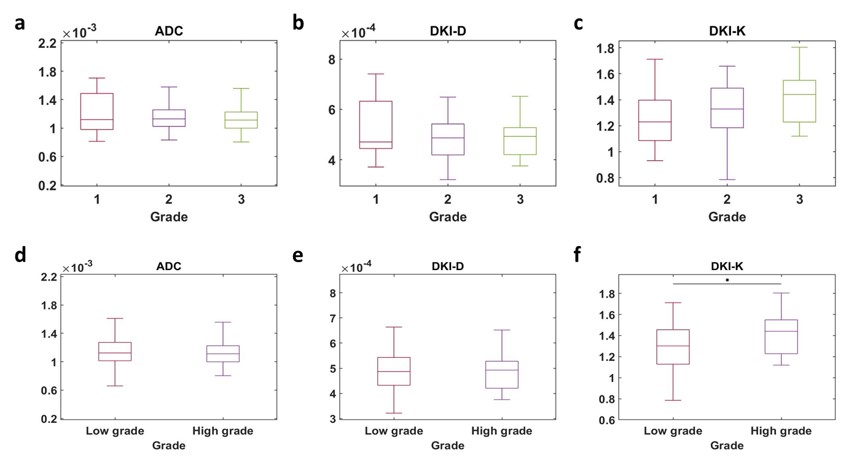
Apart from RSI, apparent diffusion coefficient (ADC) model and diffusion kurtosis imaging (DKI) model were also applied. Receiver operating characteristic curves (ROC) and area under the curve (AUC) were used to compare the performance of the three models in differentiating the low-grade (G1+G2) and high-grade (G3). Mean ± Standard Deviation, analysis of variance (ANOVA) followed by the Tukey’s test, ROC analysis, correlation analysis were used in this study. P < 0.01 was considered statistically significant.
RESULTS
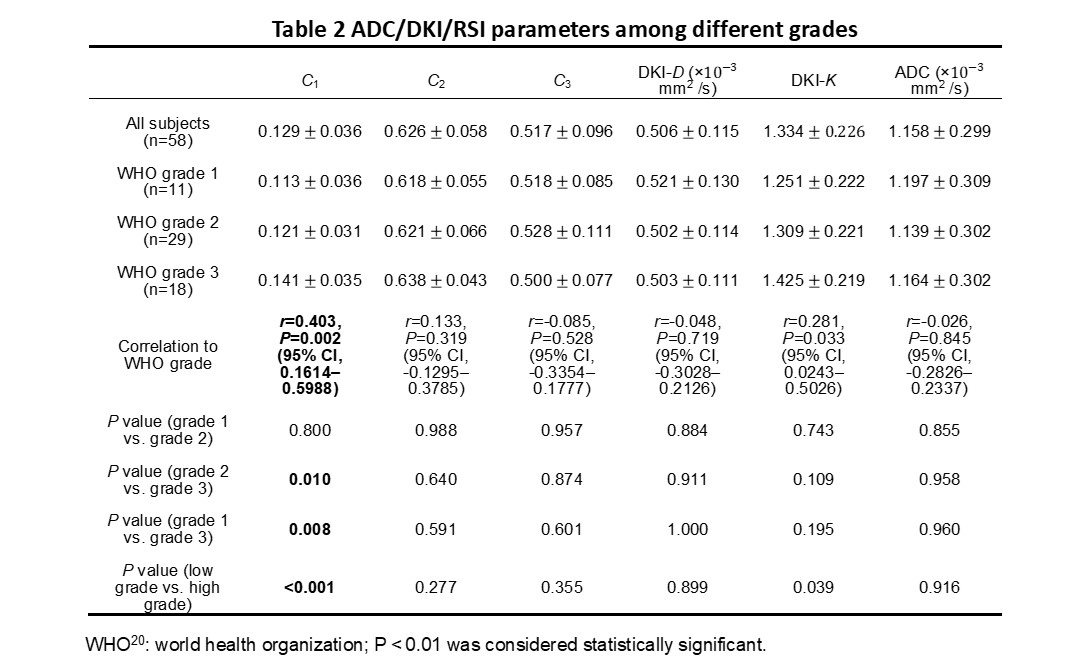
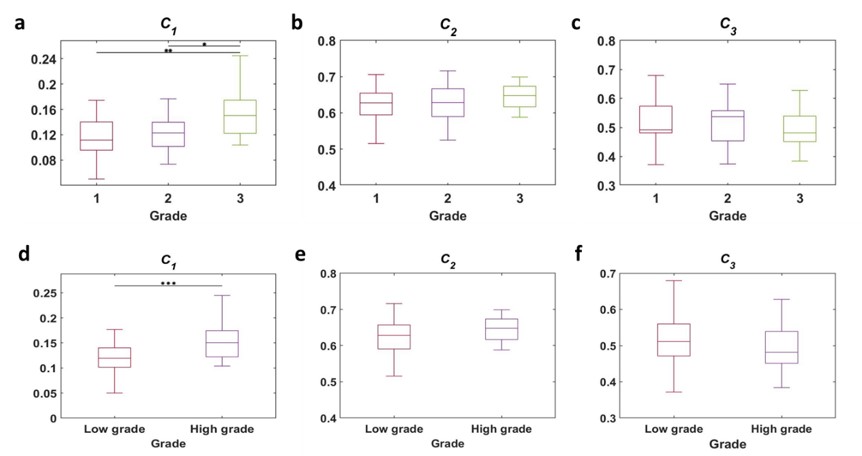
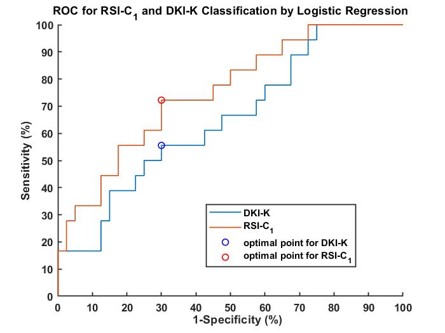
The volume fraction of restricted compartment C1 from RSI was significantly correlated with grades (r = 0.403, P = 0.002).It showed significant difference between G1 and G3 (P = 0.008), and between G2 and G3 (P = 0.01). As for the low grade and high grade discrimination, significant difference was found in C1 (P < 0.001).Figure 4 demonstrates the diagnostic performance of RSI-C1 and DKI-K. The sensitivity, specificity and AUC of RSI-C1 in discriminating low and high grade rectal tumor were 72.2%, 70.0% and 0.753, while those of DKI-K were 55.6%, 70% and 0.654, respectively.
DISCUSSION
Our study shows that three-compartment RSI model has great capability of discriminating patients with different grades of rectal cancer. The discriminatory ability of parameter C1 in RSI model was superior to that of C2 and C3, as well as parameters of other methods including ADC and DKI.In our study, D1, D2, and D3 are determined and fixed based on theoretical values and ADC reference value16, which is based on the hypothesis that the diffusivity of hindered diffusion shares biophysical similarities with the overall ADC19. Fixed ADCs can prevent overfitting and allow direct comparison among volume fractions of different compartments.
In the future, we can consider to apply both anatomical and diffusion features into machine learning techniques for improved performance in rectal tumor grading. A combination with other models such as IVIM, in which case all the data including low b-values and high b-values are utilized, may achieve better diagnostic results.
CONCLUSION
In conclusion, our study shows the RSI model outperforms the traditional DWI/ADC model and DKI model in rectal cancer grading, and therefore has great potential in the management of rectal cancer.Acknowledgements
This research was supported by the National natural Science Foundation of China [Grant Number 61901462 and 81801724], the Guangdong Grant Key Technologies for Treatment of Brain Disorders’ [Grant Number 2018B030332001], Scientific Instrument Innovation Team of the Chinese Academy of Sciences [Grant Number GJJSTD20180002], International Partnership Program of Chinese Academy of Sciences Grant [Grant Number 154144KYSB20180063], and the Strategic Priority Research Program of Chinese Academy of Sciences [Grant Number XDB25000000].References
1.Benson AB, Bekaii-Saab T, Chan E, et al. Rectal cancer. Journal of the National Comprehensive Cancer Network. 2012;10(12):1528-64.
2.Henley SJ, Ward EM, Scott S, et al. Annual report to the nation on the status of cancer, part I: National cancer statistics. Cancer. 2020;126(10):2225-49.
3.Kwok H, Bissett I, Hill G. Preoperative staging of rectal cancer. International journal of colorectal disease. 2000;15(1):9-20.
4.Dworak O, Keilholz L, Hoffmann A. Pathological features of rectal cancer after preoperative radiochemotherapy. International journal of colorectal disease. 1997;12(1):19-23.
5.Mullerad M, Hricak H, Kuroiwa K, et al. Comparison of endorectal magnetic resonance imaging, guided prostate biopsy and digital rectal examination in the preoperative anatomical localization of prostate cancer. The Journal of urology. 2005;174(6):2158-63.
6.Hein PA, Kremser C, Judmaier W, et al. Diffusion-weighted magnetic resonance imaging for monitoring diffusion changes in rectal carcinoma during combined, preoperative chemoradiation: preliminary results of a prospective study. European journal of radiology. 2003;45(3):214-22.
7.Birlik B, Obuz F, Elibol FD, et al. Diffusion-weighted MRI and MR-volumetry-in the evaluation of tumor response after preoperative chemoradiotherapy in patients with locally advanced rectal cancer. Magnetic resonance imaging. 2015;33(2):201-12.
8.Enkhbaatar N-E, Inoue S, Yamamuro H, et al. MR imaging with apparent diffusion coefficient histogram analysis: evaluation of locally advanced rectal cancer after chemotherapy and radiation therapy. Radiology. 2018;288(1):129-37.
9.Curvo‐Semedo L, Lambregts DM, Maas M, Beets GL, Caseiro‐Alves F, Beets‐Tan RG. Diffusion‐weighted MRI in rectal cancer: Apparent diffusion coefficient as a potential noninvasive marker of tumor aggressiveness. Journal of Magnetic Resonance Imaging. 2012;35(6):1365-71.
10.White NS, Leergaard TB, D'Arceuil H, Bjaalie JG, Dale AM. Probing tissue microstructure with restriction spectrum imaging: histological and theoretical validation. Human brain mapping. 2013;34(2):327-46.
11.Brunsing RL, Schenker‐Ahmed NM, White NS, et al. Restriction spectrum imaging: An evolving imaging biomarker in prostate MRI. Journal of Magnetic Resonance Imaging. 2017;45(2):323-36.
12.Humphries PD, Sebire NJ, Siegel MJ, Olsen ØE. Tumors in pediatric patients at diffusion-weighted MR imaging: apparent diffusion coefficient and tumor cellularity. Radiology. 2007;245(3):848-54.
13.Yamin G, Schenker-Ahmed NM, Shabaik A, et al. Voxel level radiologic–pathologic validation of restriction spectrum imaging cellularity index with Gleason grade in prostate cancer. Clinical Cancer Research. 2016;22(11):2668-74.
14.Irfanoglu MO, Nayak A, Jenkins J, Pierpaoli C, editors. TORTOISE v3: Improvements and new features of the NIH diffusion MRI processing pipeline. Proceedings of the 25th annual meeting of ISMRM presented at the international society for magnetic resonance in medicine; 2017.
15.Pierpaoli C, Walker L, Irfanoglu M, et al., editors. TORTOISE: an integrated software package for processing of diffusion MRI data. ISMRM 18th annual meeting; 2010.
16.Conlin CC, Feng CH, Rodriguez‐Soto AE, et al. Improved characterization of diffusion in normal and cancerous prostate tissue through optimization of multicompartmental signal models. Journal of Magnetic Resonance Imaging. 2021;53(2):628-39.
17.Stejskal EO, Tanner JE. Spin diffusion measurements: spin echoes in the presence of a time‐dependent field gradient. The journal of chemical physics. 1965;42(1):288-92.
18.Morozov S, Sergunova K, Petraikin A, et al. Diffusion processes modeling in magnetic resonance imaging. Insights into imaging. 2020;11(1):1-9.
19.Le Bihan D, Breton E, Lallemand D, Grenier P, Cabanis E, Laval-Jeantet M. MR imaging of intravoxel incoherent motions: application to diffusion and perfusion in neurologic disorders. Radiology. 1986;161(2):401-7.
20.Bosman FT, Carneiro F, Hruban RH, Theise ND. WHO classification of tumours of the digestive system: World Health Organization; 2010.
Figures