4743
Improving estimation of cell size distribution using Fourier expansion-based deconvolution for microstructural parameters mapping (FED-MPM)1Center for Nano and Micro Mechanics, Department of Engineering Mechanics, Tsinghua University, Beijing, China, 2Center for Biomedical Imaging Research, Tsinghua University, Beijing, China, 3Philips Healthcare, Beijing, China, 4Institute of Imaging Science, Vanderbilt University Medical Center, Nashville, TN, United States, 5Department of Radiology and Radiological Sciences, Vanderbilt University Medical Center, Nashville, TN, United States, 6Department of Physics and Astronomy, Vanderbilt University, Nashville, TN, United States, 7Department of Biomedical Engineering, Vanderbilt University, Nashville, TN, United States
Synopsis
Cellular microstructural parameters mapping can provide quantitative information for tumor diagnosis and treatment monitoring. Particularly, voxel-wise cell size distribution may provide critical clinical biomarkers to characterize heterogeneity of tumors. Currently, MRI-cytometry may measure such a distribution, but it “blurs” the distribution peaks and prevents differentiating different cell populations with different cell sizes. In this work, we develop a new approach to improve this and hence make it more practical to distinguish different cells. Detection of T cell infiltration for assessment of early response to immunotherapy may be a potential application of this method.
Introduction
Diffusion MRI (dMRI) provides a non-invasive approach to probe the microstructural information by utilizing time dependency of diffusion sensitivity to different time length scales1. Several methods have been developed to estimate voxel-wise mean cell sizes, including VERDICT2,3, IMPULSED4-6, and POMACE7 methods. However, this is inadequate to characterize heterogeneous cell sizes in tumors. To solve this problem, MRI-cytometry has been proposed recently to estimate the intra-voxel cell size distribution and has shown potential in breast cancer patients8. Nevertheless, this framework still cannot differentiate the distribution peaks of cell populations with different cell sizes. This can be clinically critical to monitor T cell infiltration in the early response to immunotherapy9Essentially, the extraction of cell size distribution based on dMRI signals is to solve an inverse problem in mathematics. Usually, deconvolution methods are effective for processing inverse problems. For example, orientation distribution function estimators based on spherical deconvolution (SD) are commonly used in tractography. In this study, we proposed a Fourier expansion-based deconvolution solver for microstructural parameters mapping (FED-MPM) to improve the estimation of intra-voxel cell size distribution. More importantly, this solver can discriminate multiple cell populations with different cell sizes within an image voxel without prior knowledge of the distribution function. The performance was validated by simulations and in vitro cell experiments. The results may hold great promise for monitoring the immune cell infiltration in immunotherapy.
Theory
Base on the generalized two-compartment model4,6, namely:$$S_{\mathrm{DW}}=f_{i n} S_{i n}+\left(1-f_{i n}\right) S_{e x}=f_{i n} S_{i n}+f_{e x} S_{e x}\tag{1}$$
we further consider the distribution of intra-voxel cell sizes and formulate the FED-MPM solver as following.
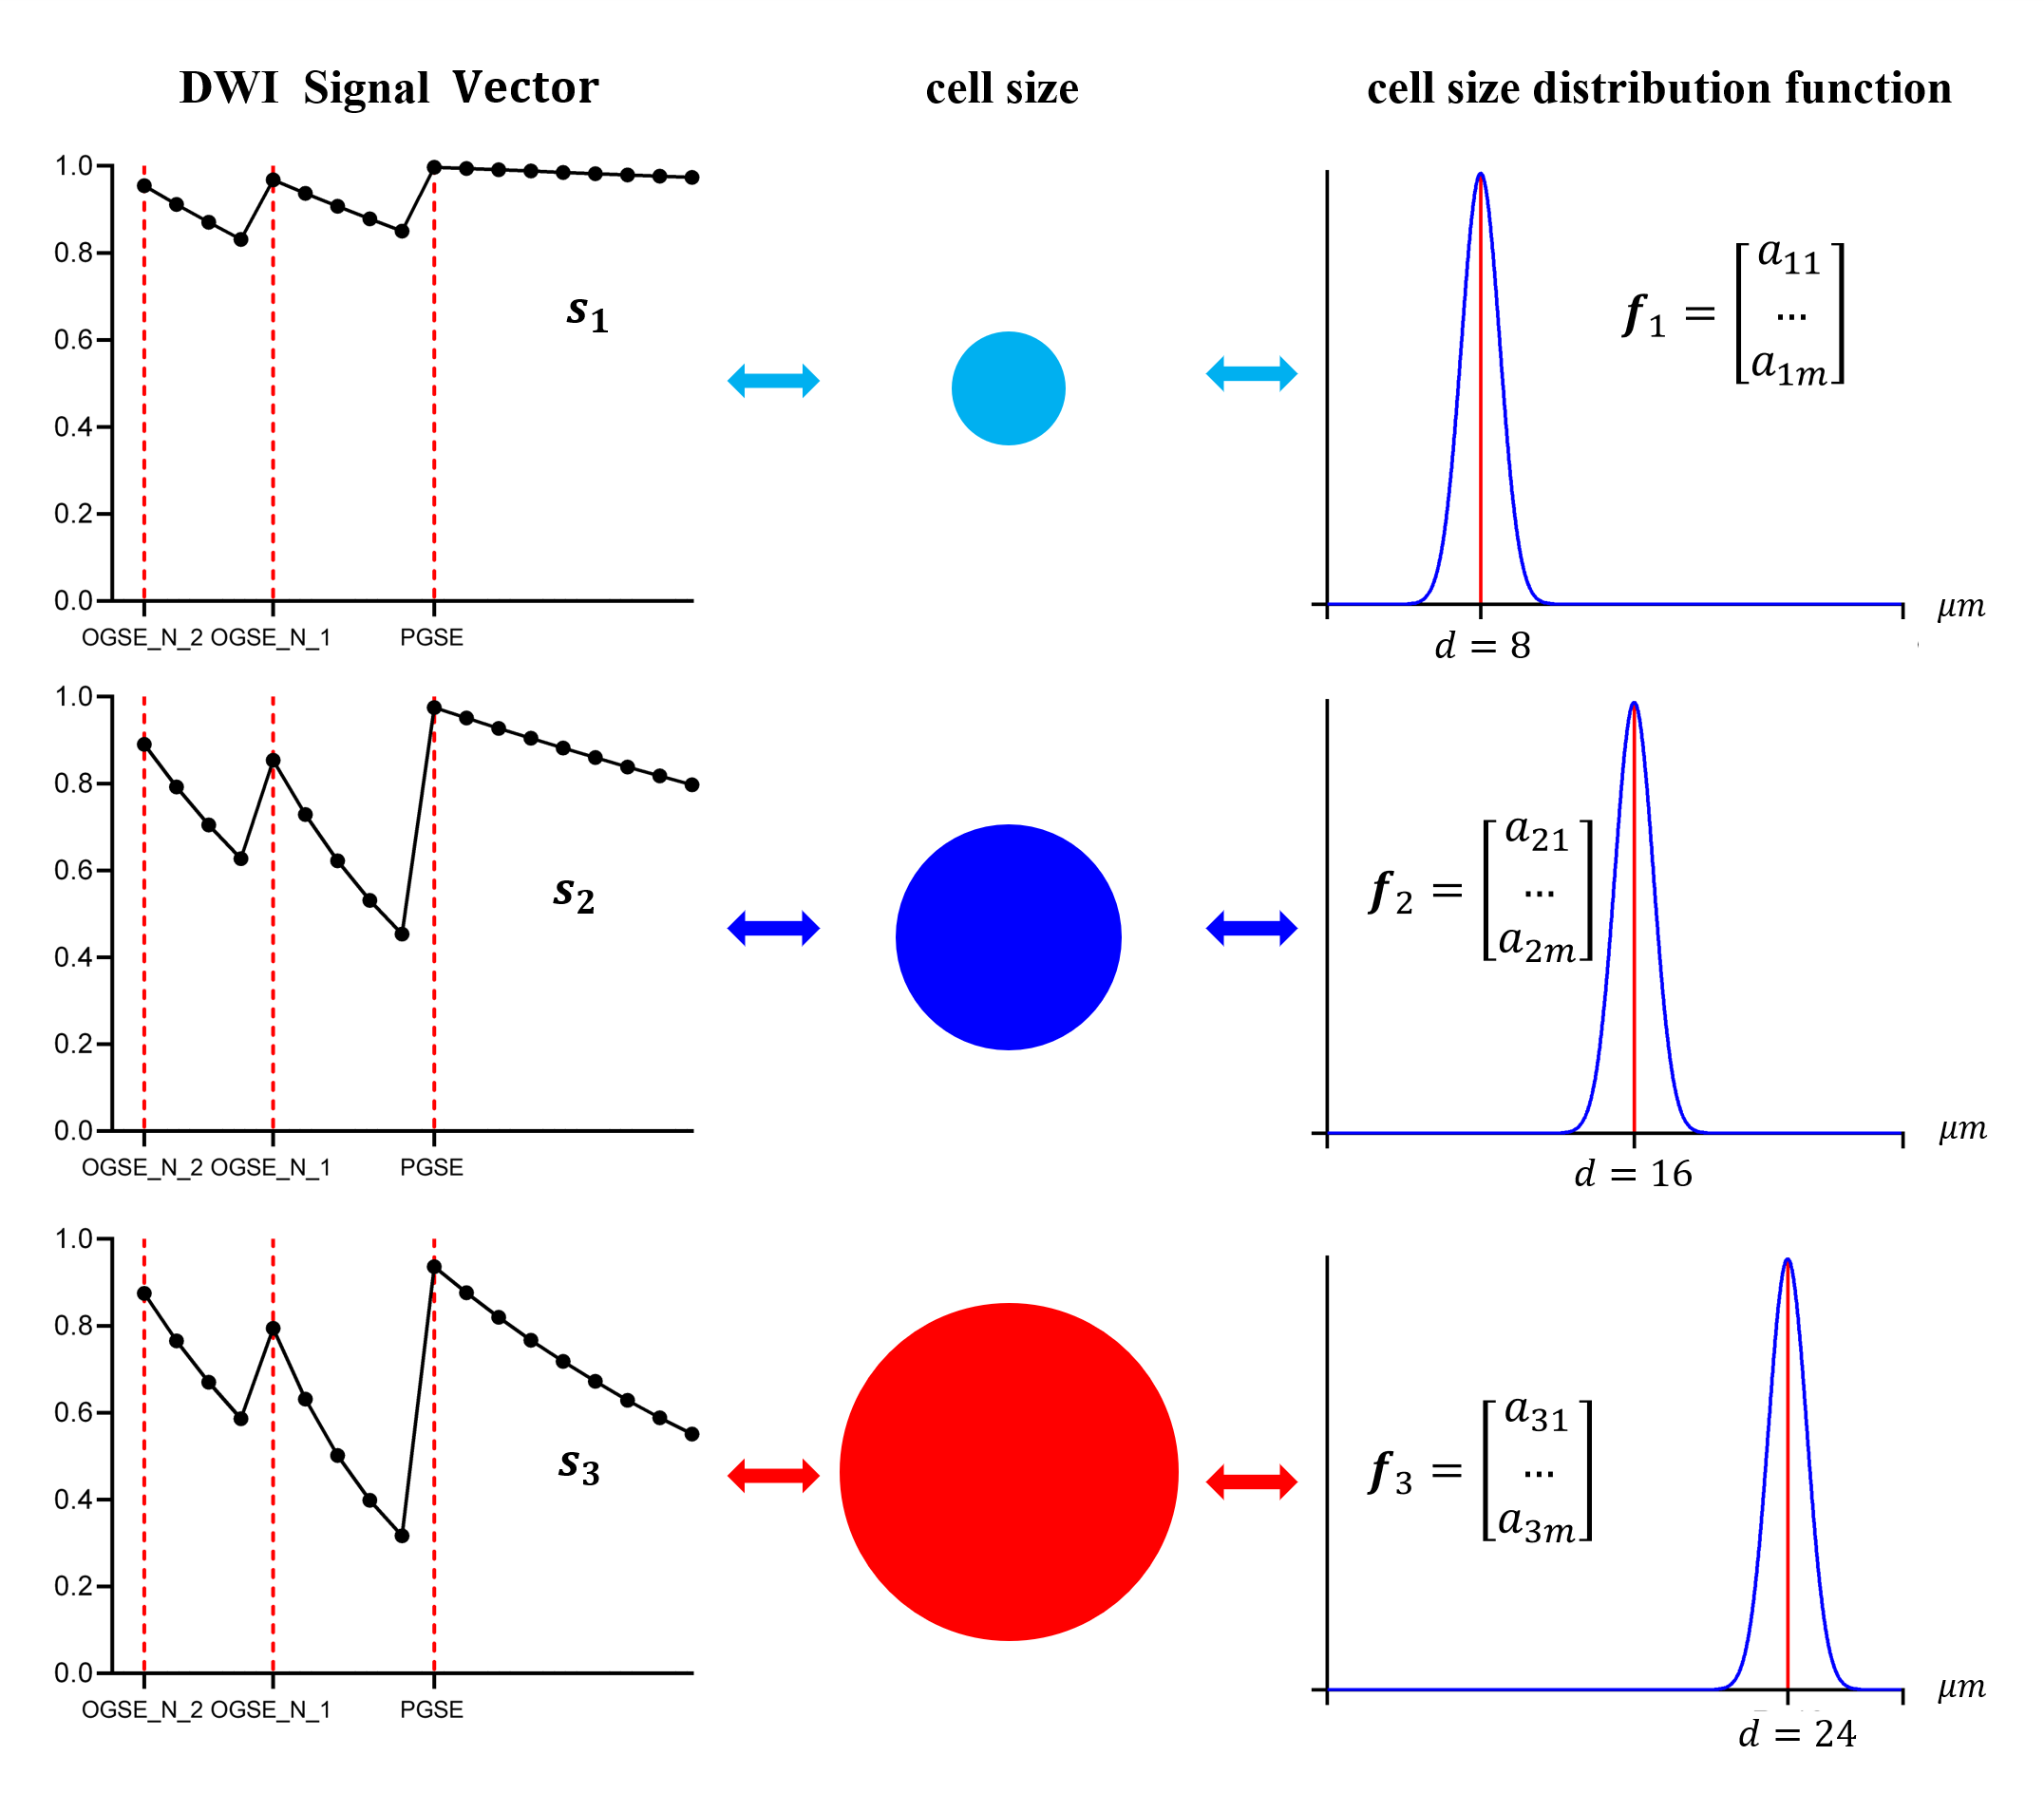
First, a cell size probability density function (CS-PDF) is defined to describe the intra-voxel distribution of cell diameters. The graphic diagrams of the CS-PDF for different cell diameters are shown in Fig. 1. With given acquisition parameters, intracellular signal vector, Sin, has a one-to-one correspondence with CS-PDF. Then, we expand CS-PDF into Fourier series and keep the first finite expansion coefficients as a vector, f. The vectors, Sin and f, also correspond to each other. We assume that they satisfy the following linear mappings:
$$S_{i n}=K f\tag{2}$$
where K is the deconvolution matrix, which can be determined by the similar computation in the SD methods. For the extracellular part, we can express the unknown signal, Sex, as a linear combination of a series of known terms. Using a pre-defined dictionary about Dex: Dex(1),..., Dex(Q), fexSex can be expressed as the following linear combination:
$$f_{e x} \boldsymbol{S}_{e x}=f_{e x}\left[\exp \left(-D_{e x} \boldsymbol{b}\right)\right] \approx \sum_{i=1}^{Q} d_{i}\left[\exp \left(-D_{e x}(i) \boldsymbol{b}\right)\right]\tag{3}$$
where b is the b-value vector and di (i=1,2,3,..,Q) are combination coefficients. Defining f* = fin f, we have:
$$S_{\mathrm{DW}}=K \boldsymbol{f}^{*}+\sum_{i=1}^{Q} d_{i}\left[\exp \left(-D_{e x}(i) b\right)\right]=A \boldsymbol{x}\tag{4}$$
where A=[K, exp(-Dex(1)b), exp(-Dex(2)b) ,..., exp(-Dex(Q)b) ]. Through solving the above linear equations, the unknown parameter vector, x=[ f*T, d1, d2,...,dQ]T, can be obtained. Then, CS-PDF is computed by the Fourier series according to the expansion coefficients.
Based on Fourier deconvolution, the estimation of cell size distribution and microstructure parameters can be obtained by simple linear computations, which may be efficient in practical applications. Furthermore, we can add constrained optimization to f and obtain an improved CS-PDF. Finally, CS-PDF (denoted as yCS-PDF ) are normalized as:
$$y_{\mathrm{CS}-\mathrm{PDF}}^{*}=\frac{y_{\mathrm{CS}-\mathrm{PDF}}(d)-\min \left(y_{\mathrm{CS}-\mathrm{PDF}}\right)}{\int y_{\mathrm{CS}-\mathrm{PDF}}(d)-\min \left(y_{\mathrm{CS}-\mathrm{pDF}}\right)}\tag{5}$$
Methods
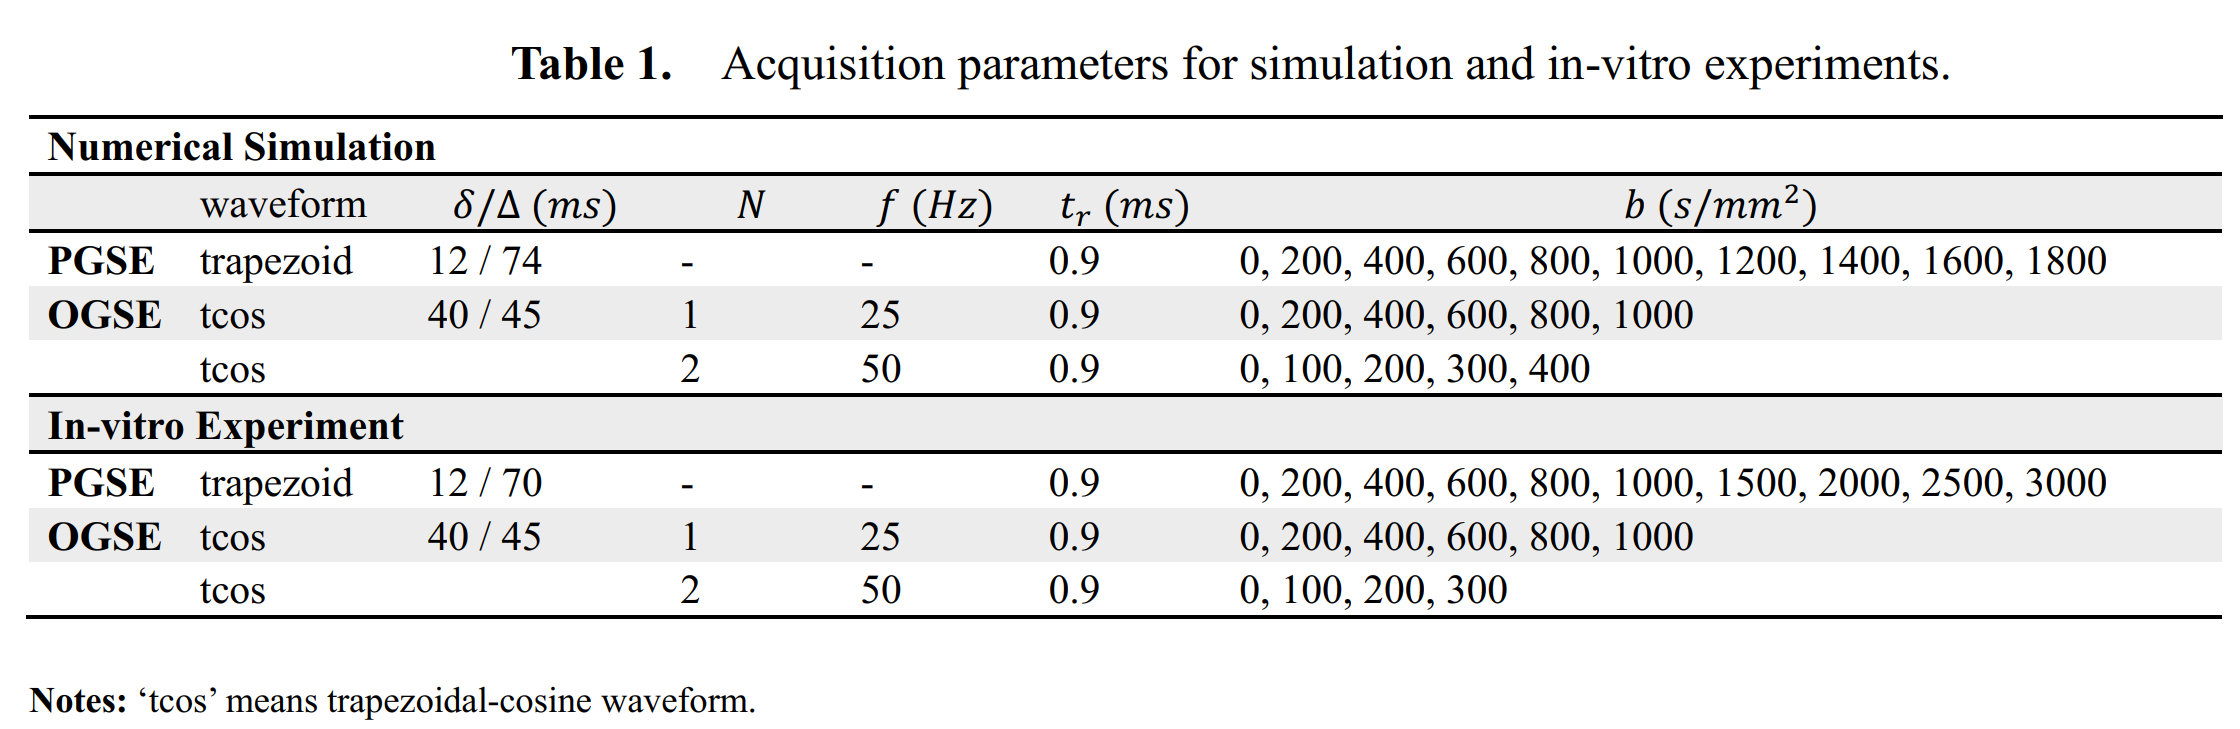
The dMRI signals with different cell sizes within one voxel were simulated as previously reported8. The in-vitro cell experiments were performed on a Varian/Agilent 4.7T MRI spectrometer (Agilent Technologies, Santa Clara, CA) similar to the approach described previously4,10 The histological ground truths about cell sizes were obtained by light microscopy. The acquisition parameters of both experiments are shown in Table 1. We compared our method with MRI-cytometry.Results and Discussion
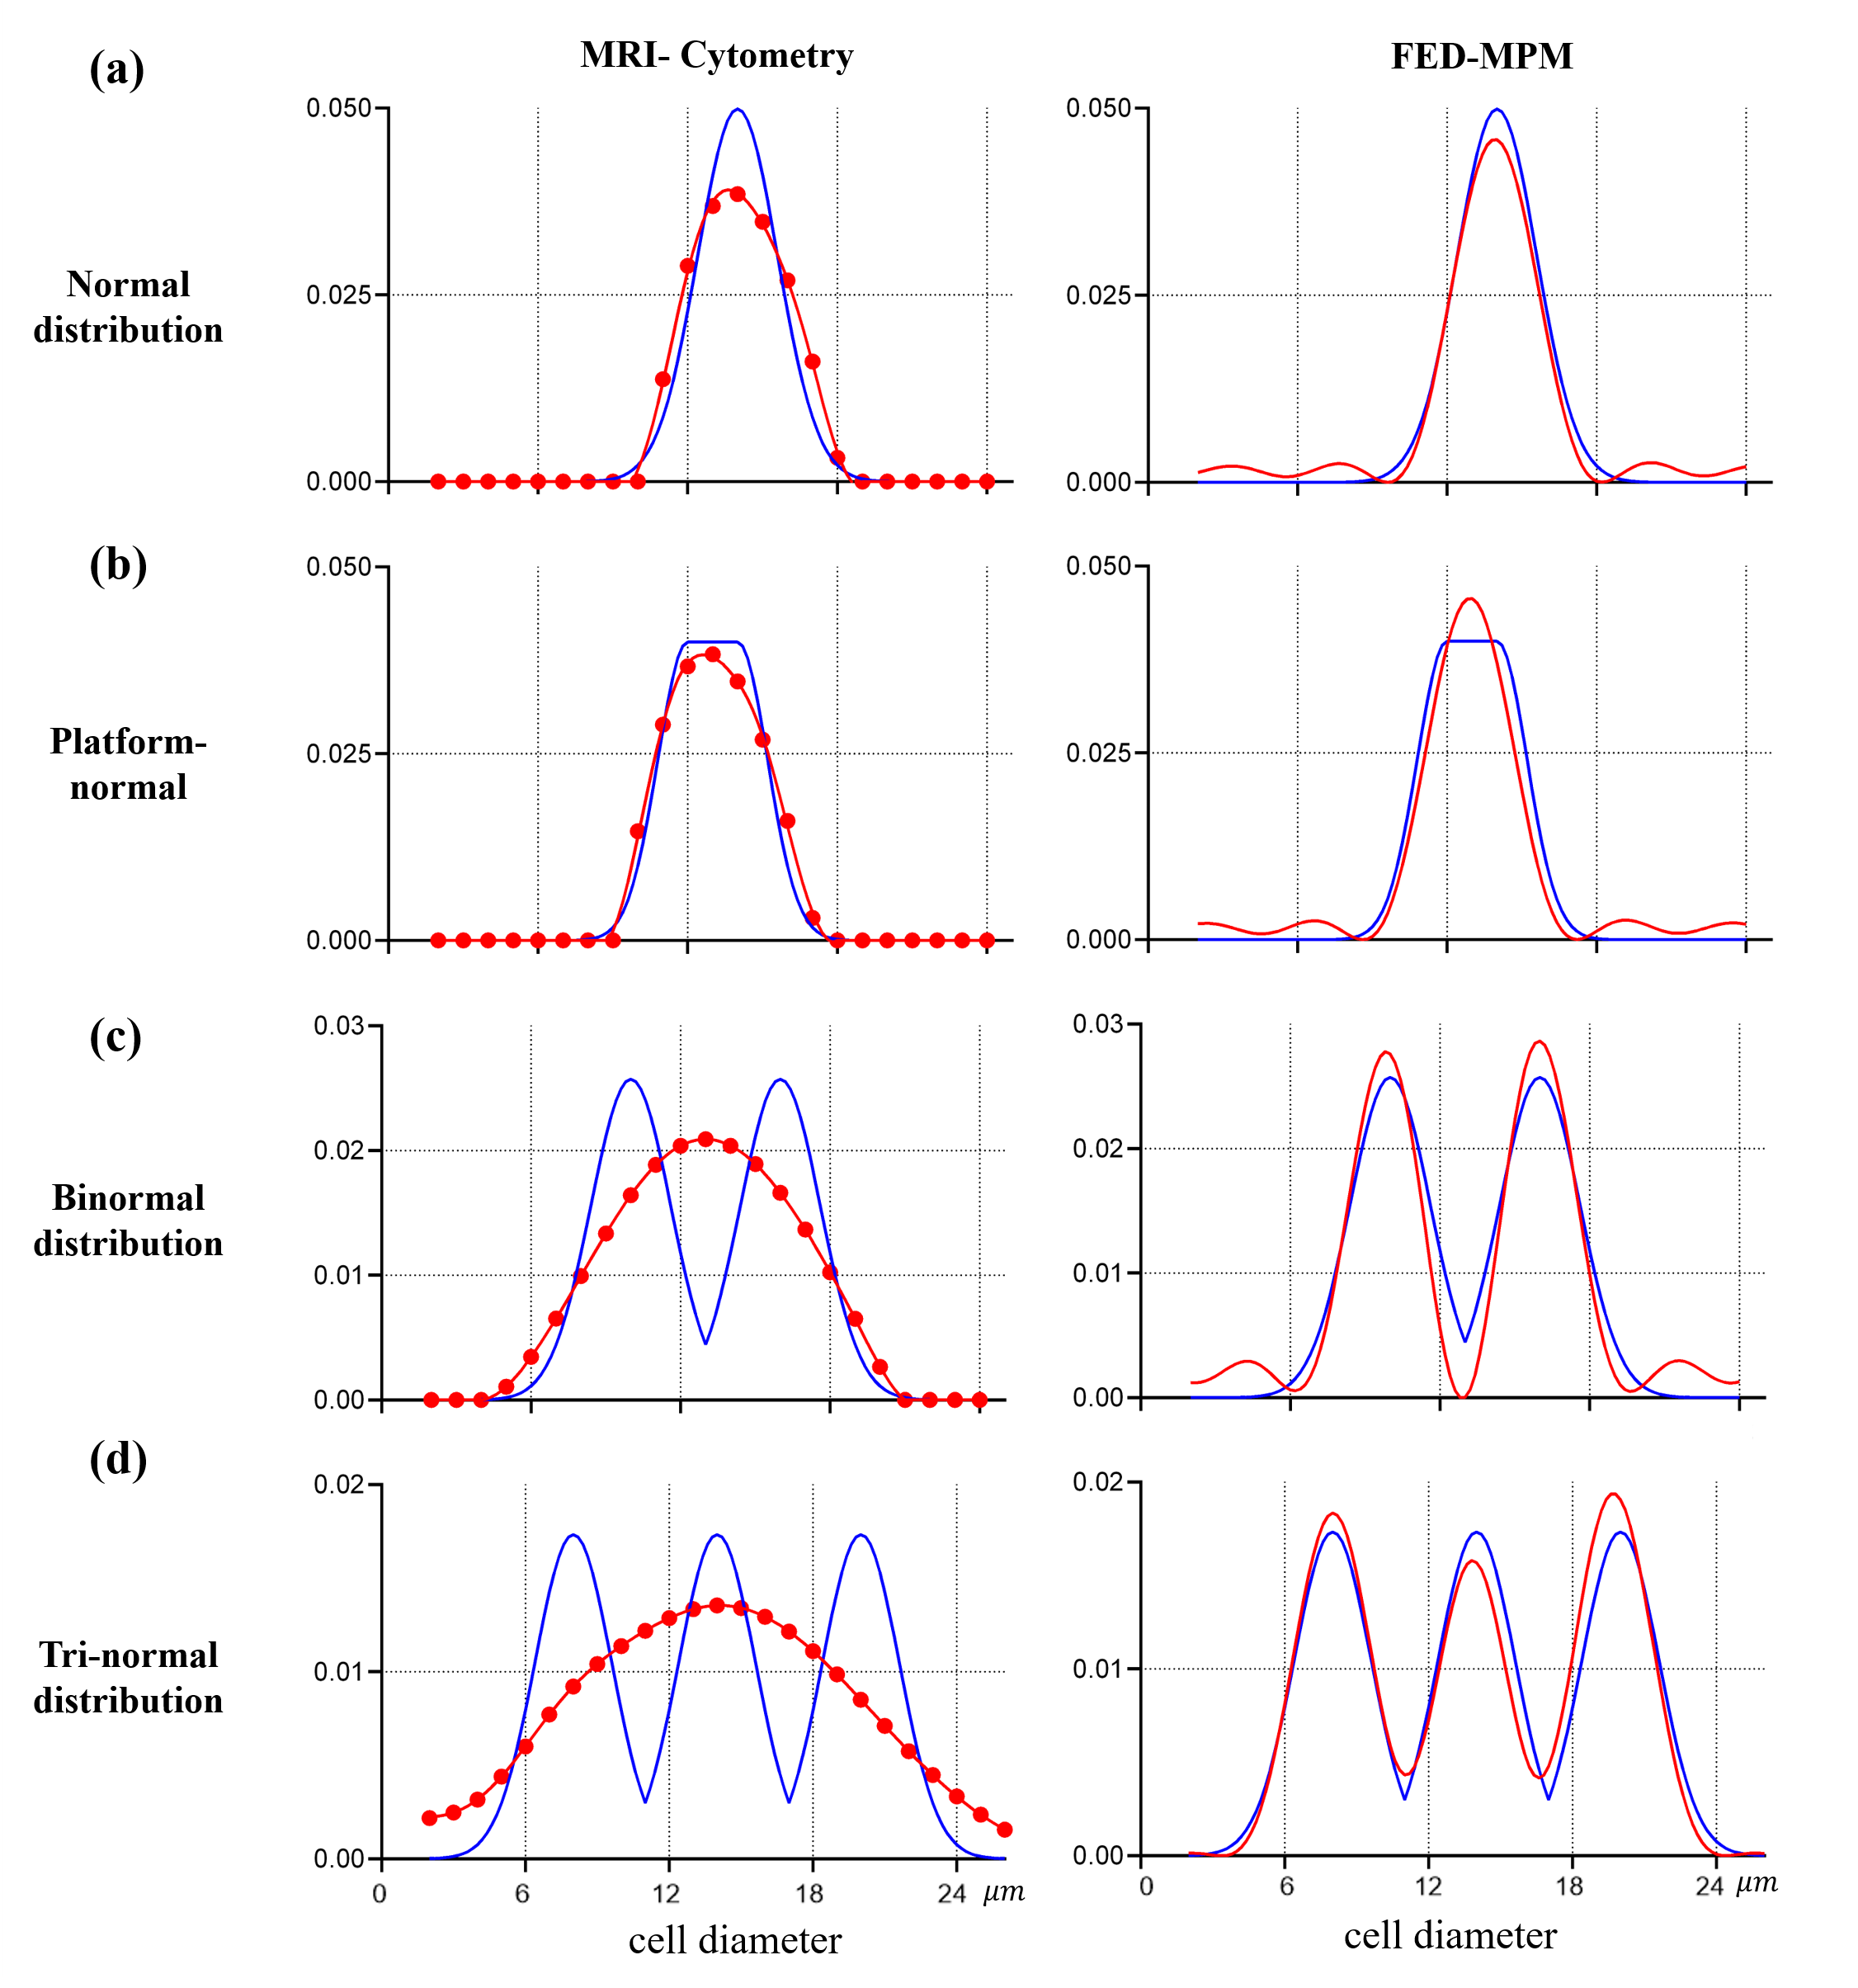
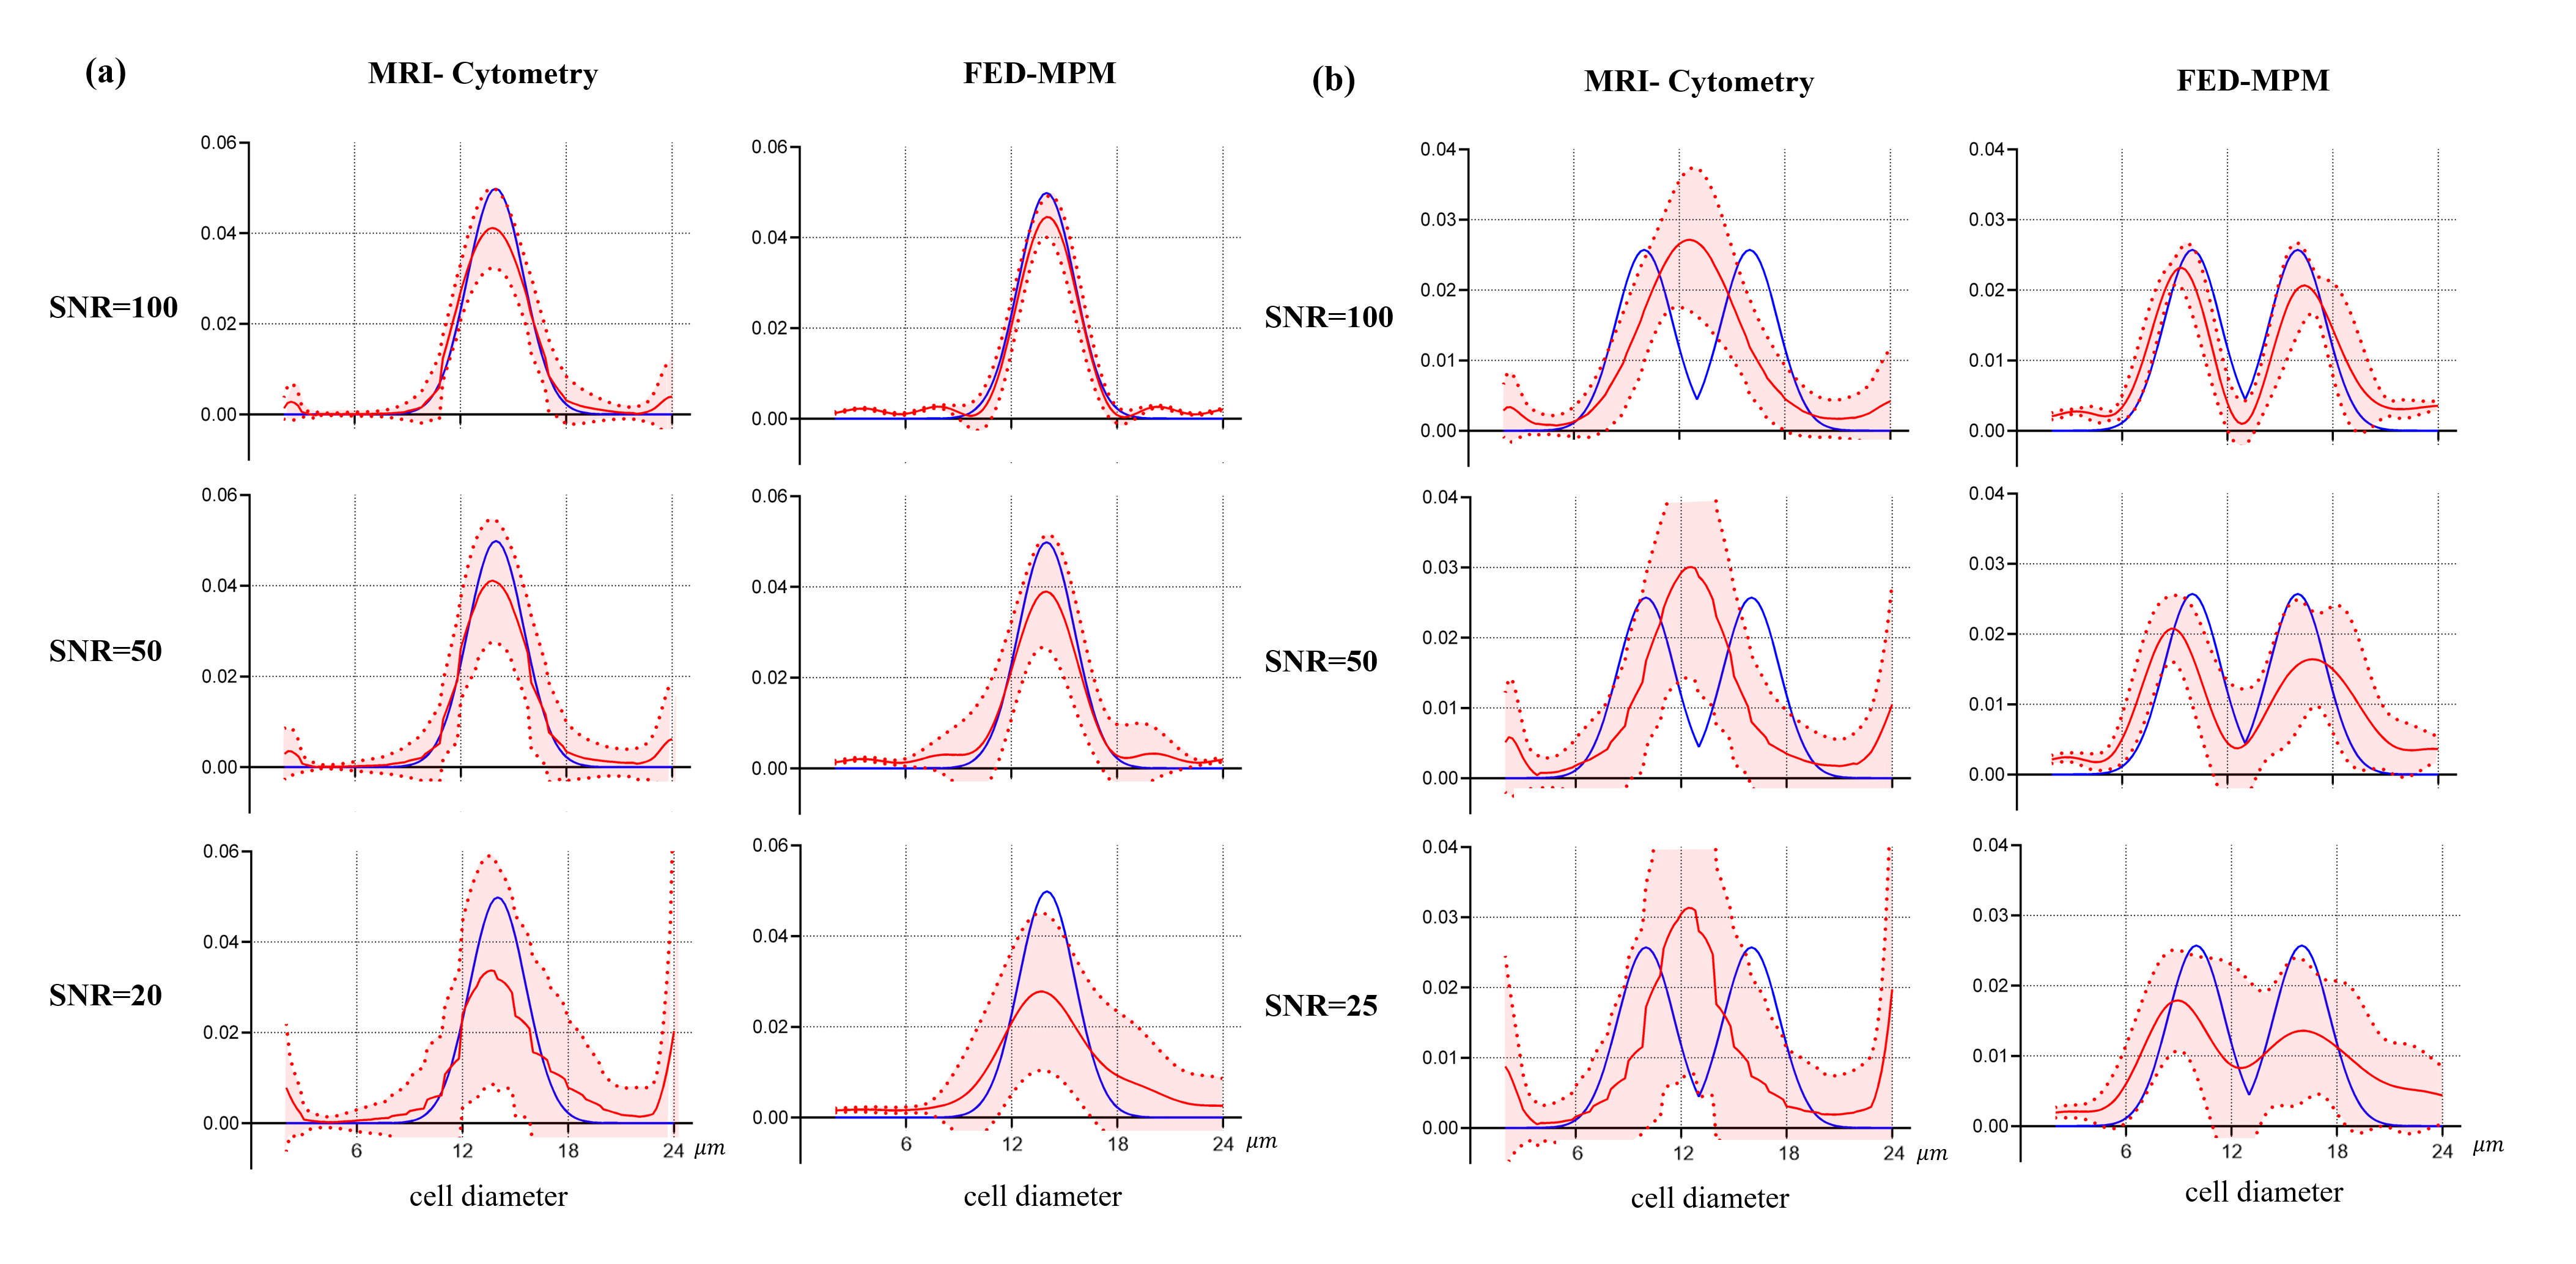
Fig. 2 shows the simulation results of MRI-cytometry and FED-MPM for various continuous distributions of cell diameters without noise. For the normal distribution and platform-normal cases, the peaks of the computed distribution functions using both methods are consistent with that of the ground truths. For the binormal and tri-normal distributions, MRI-cytometry method 'blurs' the distribution peaks. In contrast, FED-MPM can still resolve multiple peaks for these complex distributions. Additionally, the position and width of peaks are consistent with the ground truths.Fig. 3 shows the effect of different levels of noise (SNR) on the performance of solvers for (a) single-cell normal distribution and (b) two-cell binormal distribution. Although MRI-cytometry and FD-MPM show similar results in the single-cell case, the former failed to discriminate the two peaks when two cell populations coexist in one image voxel.
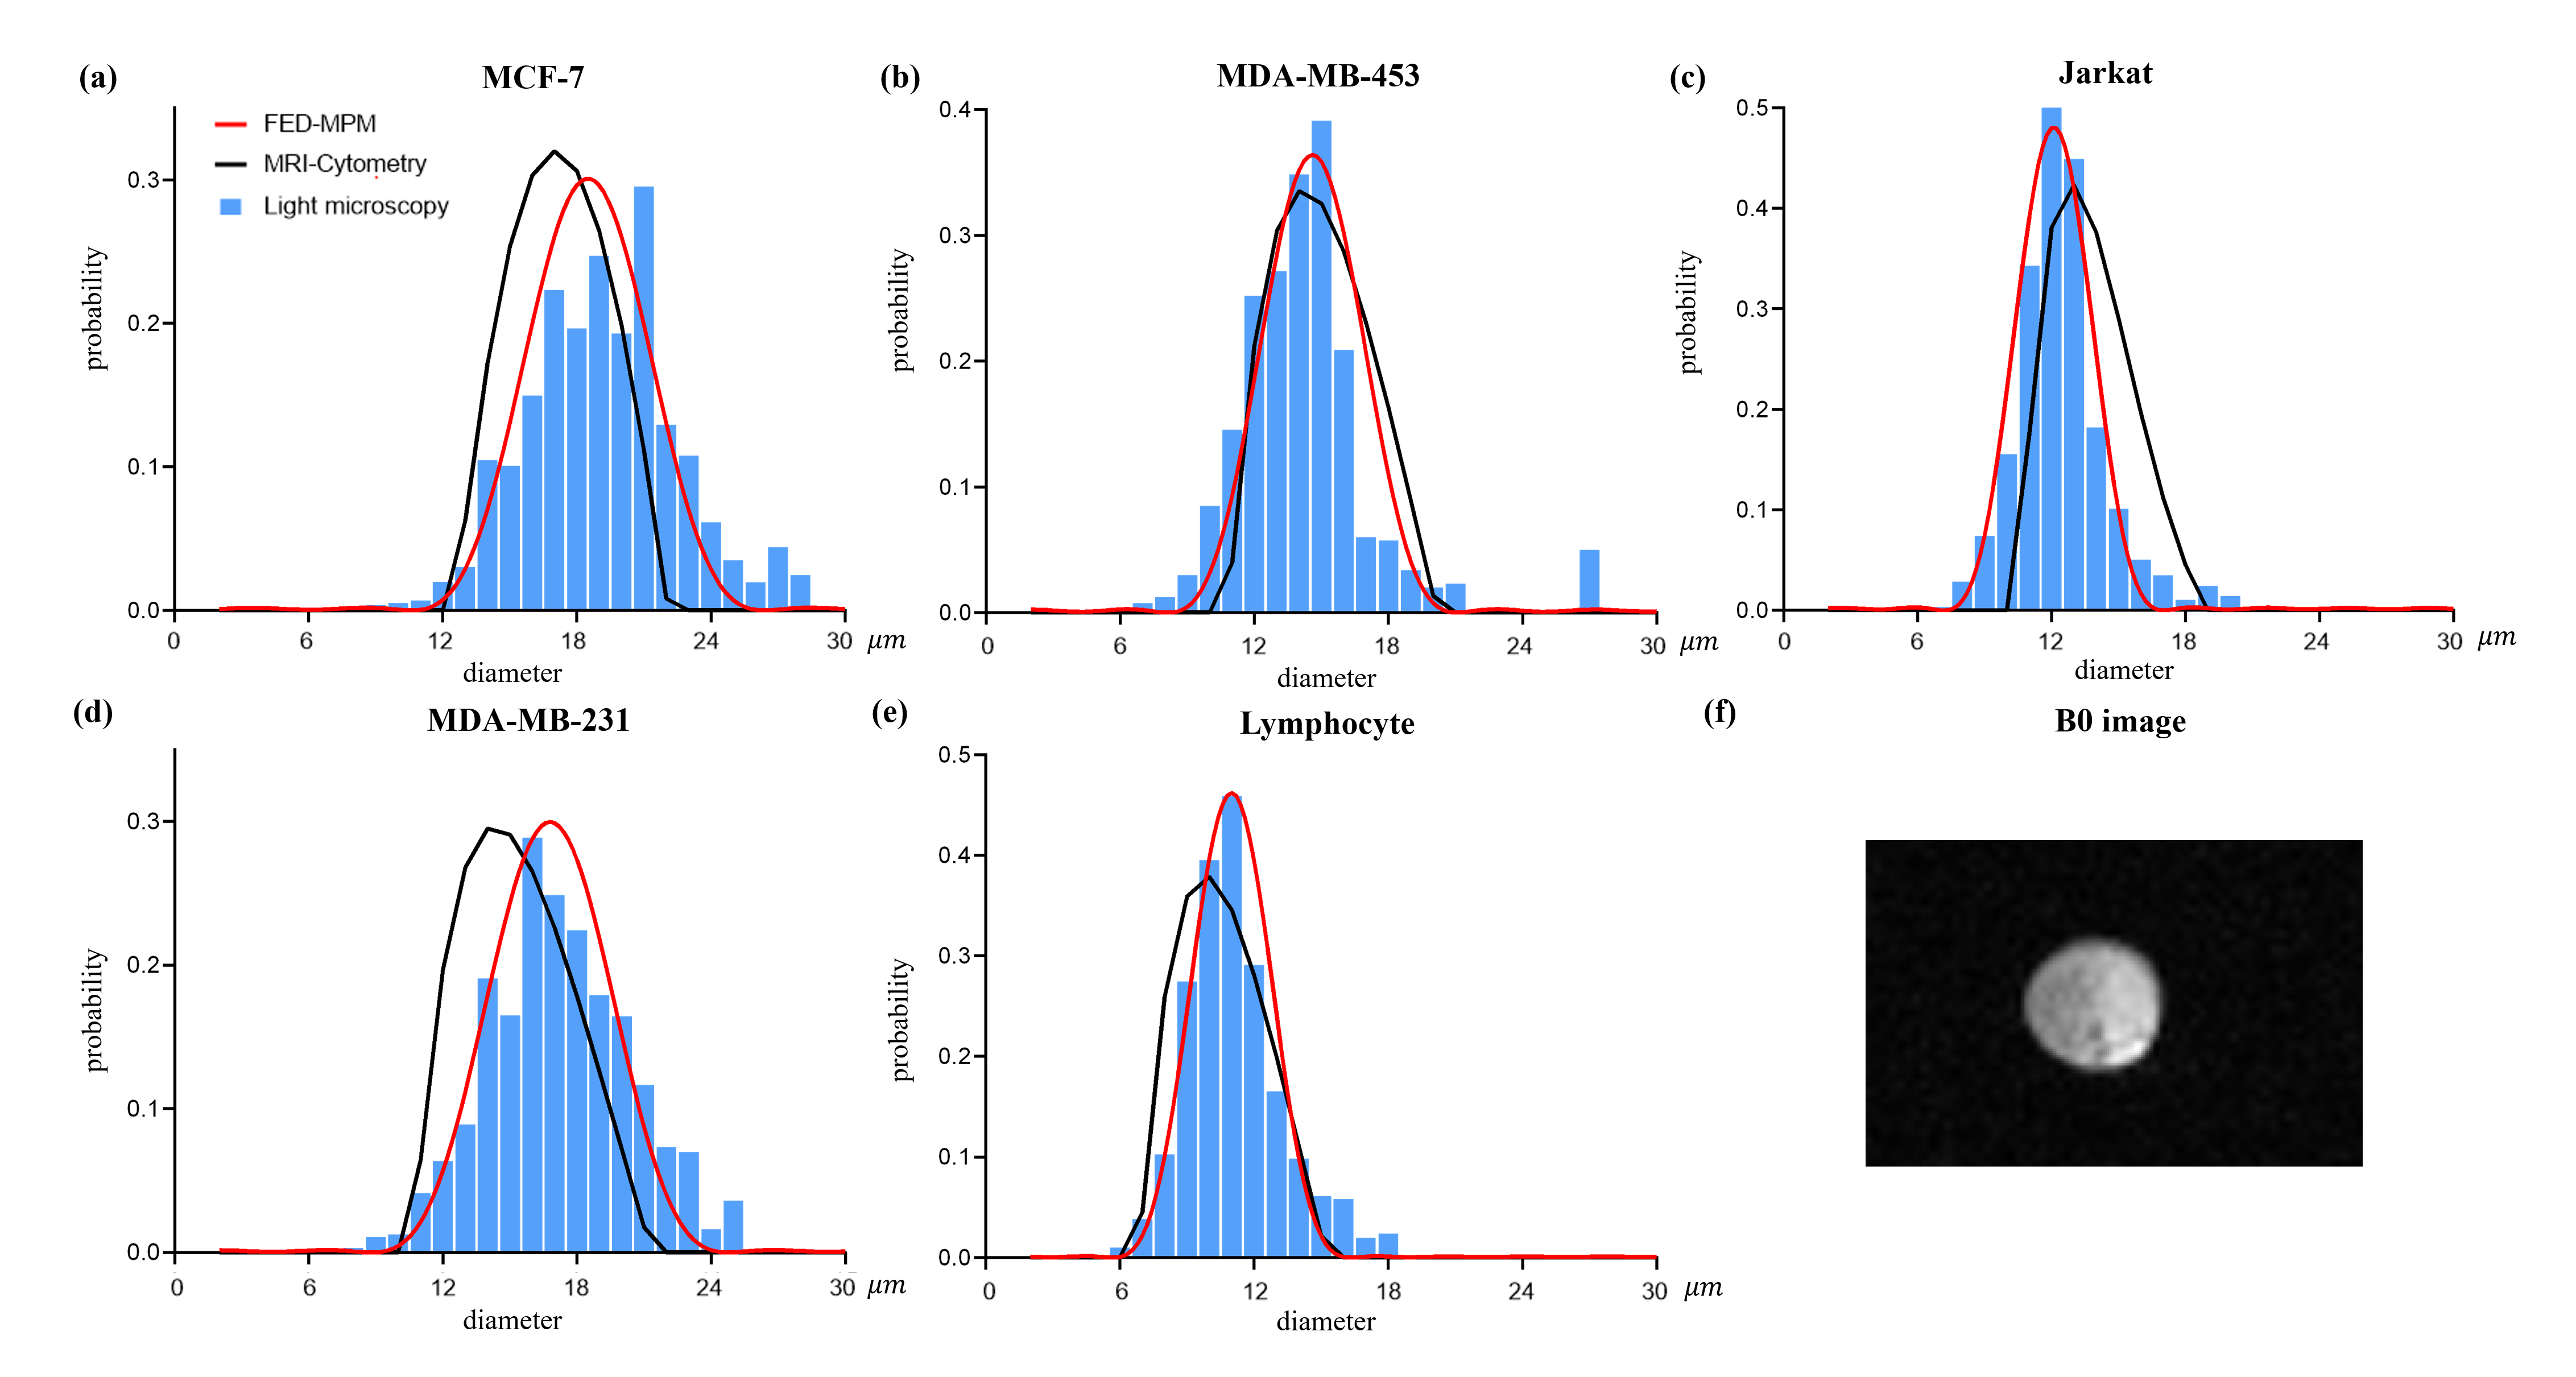
Fig. 4 demonstrates the results from the in-vitro cell experiments. The obtained b0 image is also shown in the lower right. FED-MPM shows highly consistent distribution curves with the histological ground truths. Further validations on in-vitro mixed-cells and cancer patients in treatments are expected to better evaluate the clinical value of this method.
Conclusion
In this study, a new mathematical solver for microstructural parameters mapping, FED-MPM, was proposed to estimate intra-voxel cell size distributions and further identify cell populations with different cell sizes. Numerical simulations and cell experiments in vitro were performed to validate the efficacy of the proposed solver. The results indicate that FED-MPM may provide a promising tool to improve both tumor diagnosis and treatment monitoring.Acknowledgements
No acknowledgement found.References
1. Gore JC, Xu J, Colvin DC, Yankeelov TE, Parsons EC, Does MD. Characterization of tissue structure at varying length scales using temporal diffusion spectroscopy. Nmr in Biomedicine 2010;23(7):745-756.
2. Panagiotaki E, Walker-Samuel S, Siow B, Johnson SP, Rajkumar V, Pedley RB, Lythgoe MF, Alexander DC. Noninvasive quantification of solid tumor microstructure using VERDICT MRI. Cancer Research 2014;74(7):1902.
3. Bonet-Carne E, Johnston E, Daducci A, Jacobs JG, Freeman A, Atkinson D, Hawkes DJ, Punwani S, Alexander DC, Panagiotaki E. VERDICT-AMICO: Ultrafast fitting algorithm for non-invasive prostate microstructure characterization. NMR in Biomedicine 2018;32.
4. Xu J, Jiang X, Li H, Arlinghaus LR, McKinley ET, Devan SP, Hardy BM, Xie J, Kang H, Chakravarthy AB. Magnetic resonance imaging of mean cell size in human breast tumors. Magnetic Resonance in Medicine 2020;83(6):2002-2014.
5. Jiang X, Li H, Xie J, Mckinley ET, Zhao P, Gore JC, Xu J. In vivo imaging of cancer cell size and cellularity using temporal diffusion spectroscopy. Magnetic Resonance in Medicine 2016.
6. Jiang X, Li H, Xie J, Zhao P, Gore JC, Xu J. Quantification of cell size using temporal diffusion spectroscopy. Magnetic Resonance in Medicine 2016;75(3):1076-1085.
7. Reynaud O, Winters KV, Hoang DM, Wadghiri YZ, Novikov DS, Kim SG. Pulsed and oscillating gradient MRI for assessment of cell size and extracellular space (POMACE) in mouse gliomas. Nmr in Biomedicine 2016.
8. Xu J, Jiang X, Devan SP, Arlinghaus LR, McKinley ET, Xie J, Zu Z, Wang Q, Chakravarthy AB, Wang Y, Gore JC. MRI-cytometry: Mapping nonparametric cell size distributions using diffusion MRI. Magnetic Resonance in Medicine 2021;85(2):748-761.
9. Okazaki T, Honjo T. PD-1 and PD-1 ligands: from discovery to clinical application. International Immunology 2007;19(7):813-824.
10. Li H, Jiang X, Xie J, Gore JC, Xu J. Impact of transcytolemmal water exchange on estimates of tissue microstructural properties derived from diffusion MRI. Magnetic Resonance in Medicine 2017;77(6):2239-2249.
Figures