4723
Time-dependent Diffusion in Extra-Axial Brain Tumors Investigated with Oscillating-gradient Spin-echo.1Radiology, Juntendo University School of Medicine, Tokyo, Japan, 2Radiology, Toho University Omori Medical Center, Tokyo, Japan, 3Siemens Healthcare K.K., Tokyo, Japan, 4Siemens Healthcare GmbH, Erlangen, Germany, 5Radiology, Graduate School of Medicine, The University of Tokyo, Tokyo, Japan
Synopsis
The purpose of our study was to investigate the utility of changes in diffusivity between short and long effective diffusion times (Δeff) in distinguishing extra-axial brain tumors. Patients with 12 meningiomas, 13 acoustic neuromas, and 11 pituitary adenomas were undergoing diffusion-weighted imaging with Δeff of 6.5 ms and 35.2 ms. The dependence of λ1, λ2, λ3, and MD values on Δeff was stronger in pituitary adenomas than in meningiomas and acoustic neuroma, suggesting differences in internal tissue structure. Our results showed that the use of DTI with shorter Δeff provides additional information about the microstructure of brain tumors.
INTRODUCTION
Oscillating gradient spin-echo (OGSE) sequences can shorten diffusion times by replacing the long-lasting diffusion-sensitizing gradients used in pulsed gradient spin-echo (PGSE) methods with rapidly oscillating gradients1)~5). Recently, OGSE sequences have become available on clinical magnetic resonance imaging (MRI) scanners. If most molecules do not move far enough to interact with any obstacle during the preset diffusion time, the observed apparent diffusion coefficient (ADC) is the intrinsic diffusion coefficient of cellular water. As the diffusion time increases, molecules interact with more barriers and the observed ADC will decrease asymptotically. Therefore, it is expected that diffusion-weighted imaging (DWI) with the OGSE sequence can estimate the substrate's viscosity and spatially restricted diffusion on the basis of the internal structures of pathologic lesions from changes in the ADC values with differing diffusion times6),7).We hypothesized that changes in diffusion tensor imaging (DTI) eigenvalues and mean diffusivity (MD) acquired with a shorter diffusion time using OGSE might enable us to estimate the more precise internal structure of each extra-axial brain tumor. The purpose of our study was to investigate the utility of changes in diffusivity between short and long Δeff in distinguishing extra-axial brain tumors.
METHODS
Patients with 12 meningiomas, 13 acoustic neuromas, and 11 pituitary adenomas were scanned on a clinical 3T scanner (MAGNETOM Prisma, Siemens Healthcare GmbH, Erlangen, Germany) with a 20-channel head coil. The exclusion criteria were a mass size smaller than 1 cm and prior radiation treatment before the MRI scan. DTI was performed with a prototype sequence using b-values of 0 and 1000 s/mm2 and six uniformly distributed directions. OGSE using a trapezoid-cosine waveform was performed with Δeff of 6.5 ms and 35.2 ms8). Other parameters were as follows: TR, 4800 ms; TE, 101 ms; FOV, 200 × 200 mm2; matrix size, 82 × 82; slice thickness, 5 mm; and acquisition time, approximately 2 mins. DTI eigenvalues (λ1, λ2, and λ3) and MD for each tumor were determined in a manually defined region of interest (ROI). The ROI was placed in a region of a tumor showing a relatively homogeneous high signal on DWI, avoiding cystic degeneration and hemorrhagic components. The relative percentage change between shorter and longer diffusion times was then calculated as:(ValueΔeff=6.5ms - ValueΔ=35.2ms) / ValueΔ=35.2ms ×100 (%)
where ValueΔeff is λ1, λ2, λ3, or MD.
The λ1, λ2, λ3, and MD of each tumor for the two diffusion times were compared using the Wilcoxon signed-rank test because the data were paired (P < 0.05). The Kruskal Wallis test was used to compare the relative percentage changes of the three tumor types. When significance was found, the relative percentage changes were further compared using a multiple comparison Steel-Dwass test (P < 0.05). All statistical analyses were performed using JMP Pro ver.15.0.0 (SAS Institute Inc., Cary, NC, USA).
RESULTS
The meningiomas and acoustic neuromas showed slightly higher intensity on trace DWI with an Δeff of 35.2 ms (Fig. 1, 2). The pituitary adenomas showed higher intensity on DWI with an Δ of 35.2 ms (Fig. 3). The tumors showed decreased visualization on DWI with an Δeff of 6.5 ms (Fig. 1-3). The λ1, λ2, λ3, and MD of all tumors were significantly higher at the Δeff of 6.5 ms, compared with those at the Δeff of 35.2 ms (Fig. 4). The relative percentage changes of λ1, λ2, λ3, and MD were significantly higher in pituitary adenomas than in meningiomas and acoustic neuroma, but not significantly different between meningiomas and acoustic neuroma (Fig. 5).DISCUSSION
Among all types of tumors, the pituitary adenomas had significantly stronger diffusion time-dependence of λ1, λ2, λ3, and MD. Mean square distances of water molecule movement for diffusion times of Δ = 6.5 ms and 35.2 ms at body temperature are 10.8 μm and 25.1 μm, respectively9). Compared to meningiomas and acoustic neuromas, pituitary adenomas likely have microstructural features (or patterns) that are relevant within this length scale.Pathology of meningothelial meningioma shows syncytial and epithelial cells, indistinct cell borders, classic whorls, and sparse psammoma bodies. Pathology of acoustic neuromas shows interlacing fascicles of cells with indistinct cytoplasmic borders, elongated and twisted nuclei, and biphasic patterns with Antoni A (cellular) and B (hypocellular, myxoid). It commonly has regressive ancient changes (cellular pleomorphism with hyperchromasia, cystic degeneration, necrosis, calcification, and hemorrhage). Pathology of pituitary adenomas shows moderately abundant cytoplasm with uniform nuclear morphology, stippled chromatin, and inconspicuous nucleoli. Cytoplasmic appearance usually correlates with the content of hormone-containing secretory cells. While it is unclear what specific microstructure is responsible for the stronger diffusion time-dependence of pituitary adenomas and although the diffusion time that we can probe with a clinical MR scanner is still too long for direct quantification of cell sizes10), the differences of relative percentage changes among tumor types presumably reflect the differences in the structural complexity of tumors11).
CONCLUSION
The pituitary adenoma showed stronger diffusion time-dependence with diffusion times between 6.5 ms and 35.2 ms than meningiomas and acoustic neuromas. The difference in diffusion time-dependence may be attributed to the difference in the internal structures of these tumors. DWI with short diffusion time may provide additional information about the microstructure of each tumor and may contribute to tumor diagnosis.Acknowledgements
This work was supported in part by JSPS KAKENHI (grant no. 18H02772).References
1. Martin M. Magn Reson Insights 2013 ; 6 : 59-64
2. Does MD, Parsons EC, Gore JC. Magn Reson Med 2003 ; 49 : 206-2153.
3. Aggarwal M, Jones MV, Calabresi PA, et al. Magn Reson Med 2012 ; 67 : 98-1094.
4. Wu D, Martin LJ, Northington FJ, et al. Magn Reson Med 2014 ; 72 : 1366-13745.
5. Novikov DS, Jensen JH, Helpern JA, et al. Proc Natl Acad Sci U S A 2014 ; 111 : 5088-50936.
6. Baron CA, Kate M, Gioia L, et al. Stroke 2015 ; 46 : 2136-417.
7. Andica C, Hori M, Kamiya K, et al. Magn Reson Med Sci 2018 ; 17 : 2692-728.
8. Van AT, Holdsworth SJ, Bammer R. Magn Reson Med 2014 ; 71 : 83-949.
9. Einstein A. Ann Phys 1906 ; 324 : 37110.
10. Reynaud R. Front Phys 2017 ; 5 : 1-1611.
11. Novikov DS, Jensen JH, Helpern JA, et al. Proc Natl Acad Sci U S A 2014 ; 111 : 5088-9503.
Figures
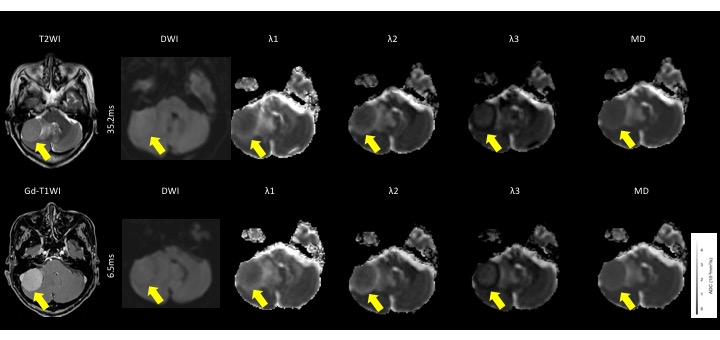
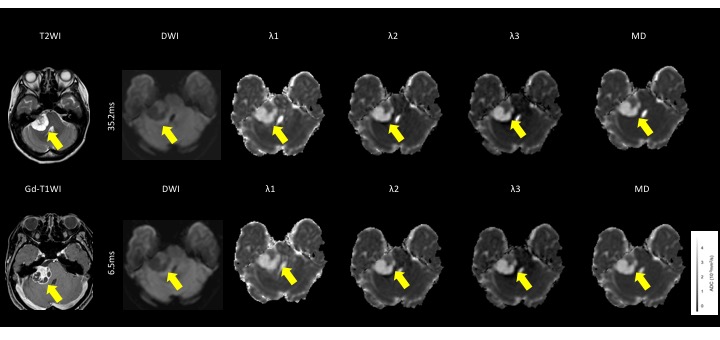
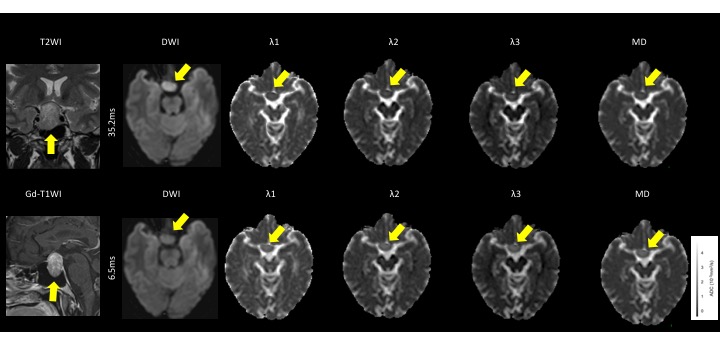
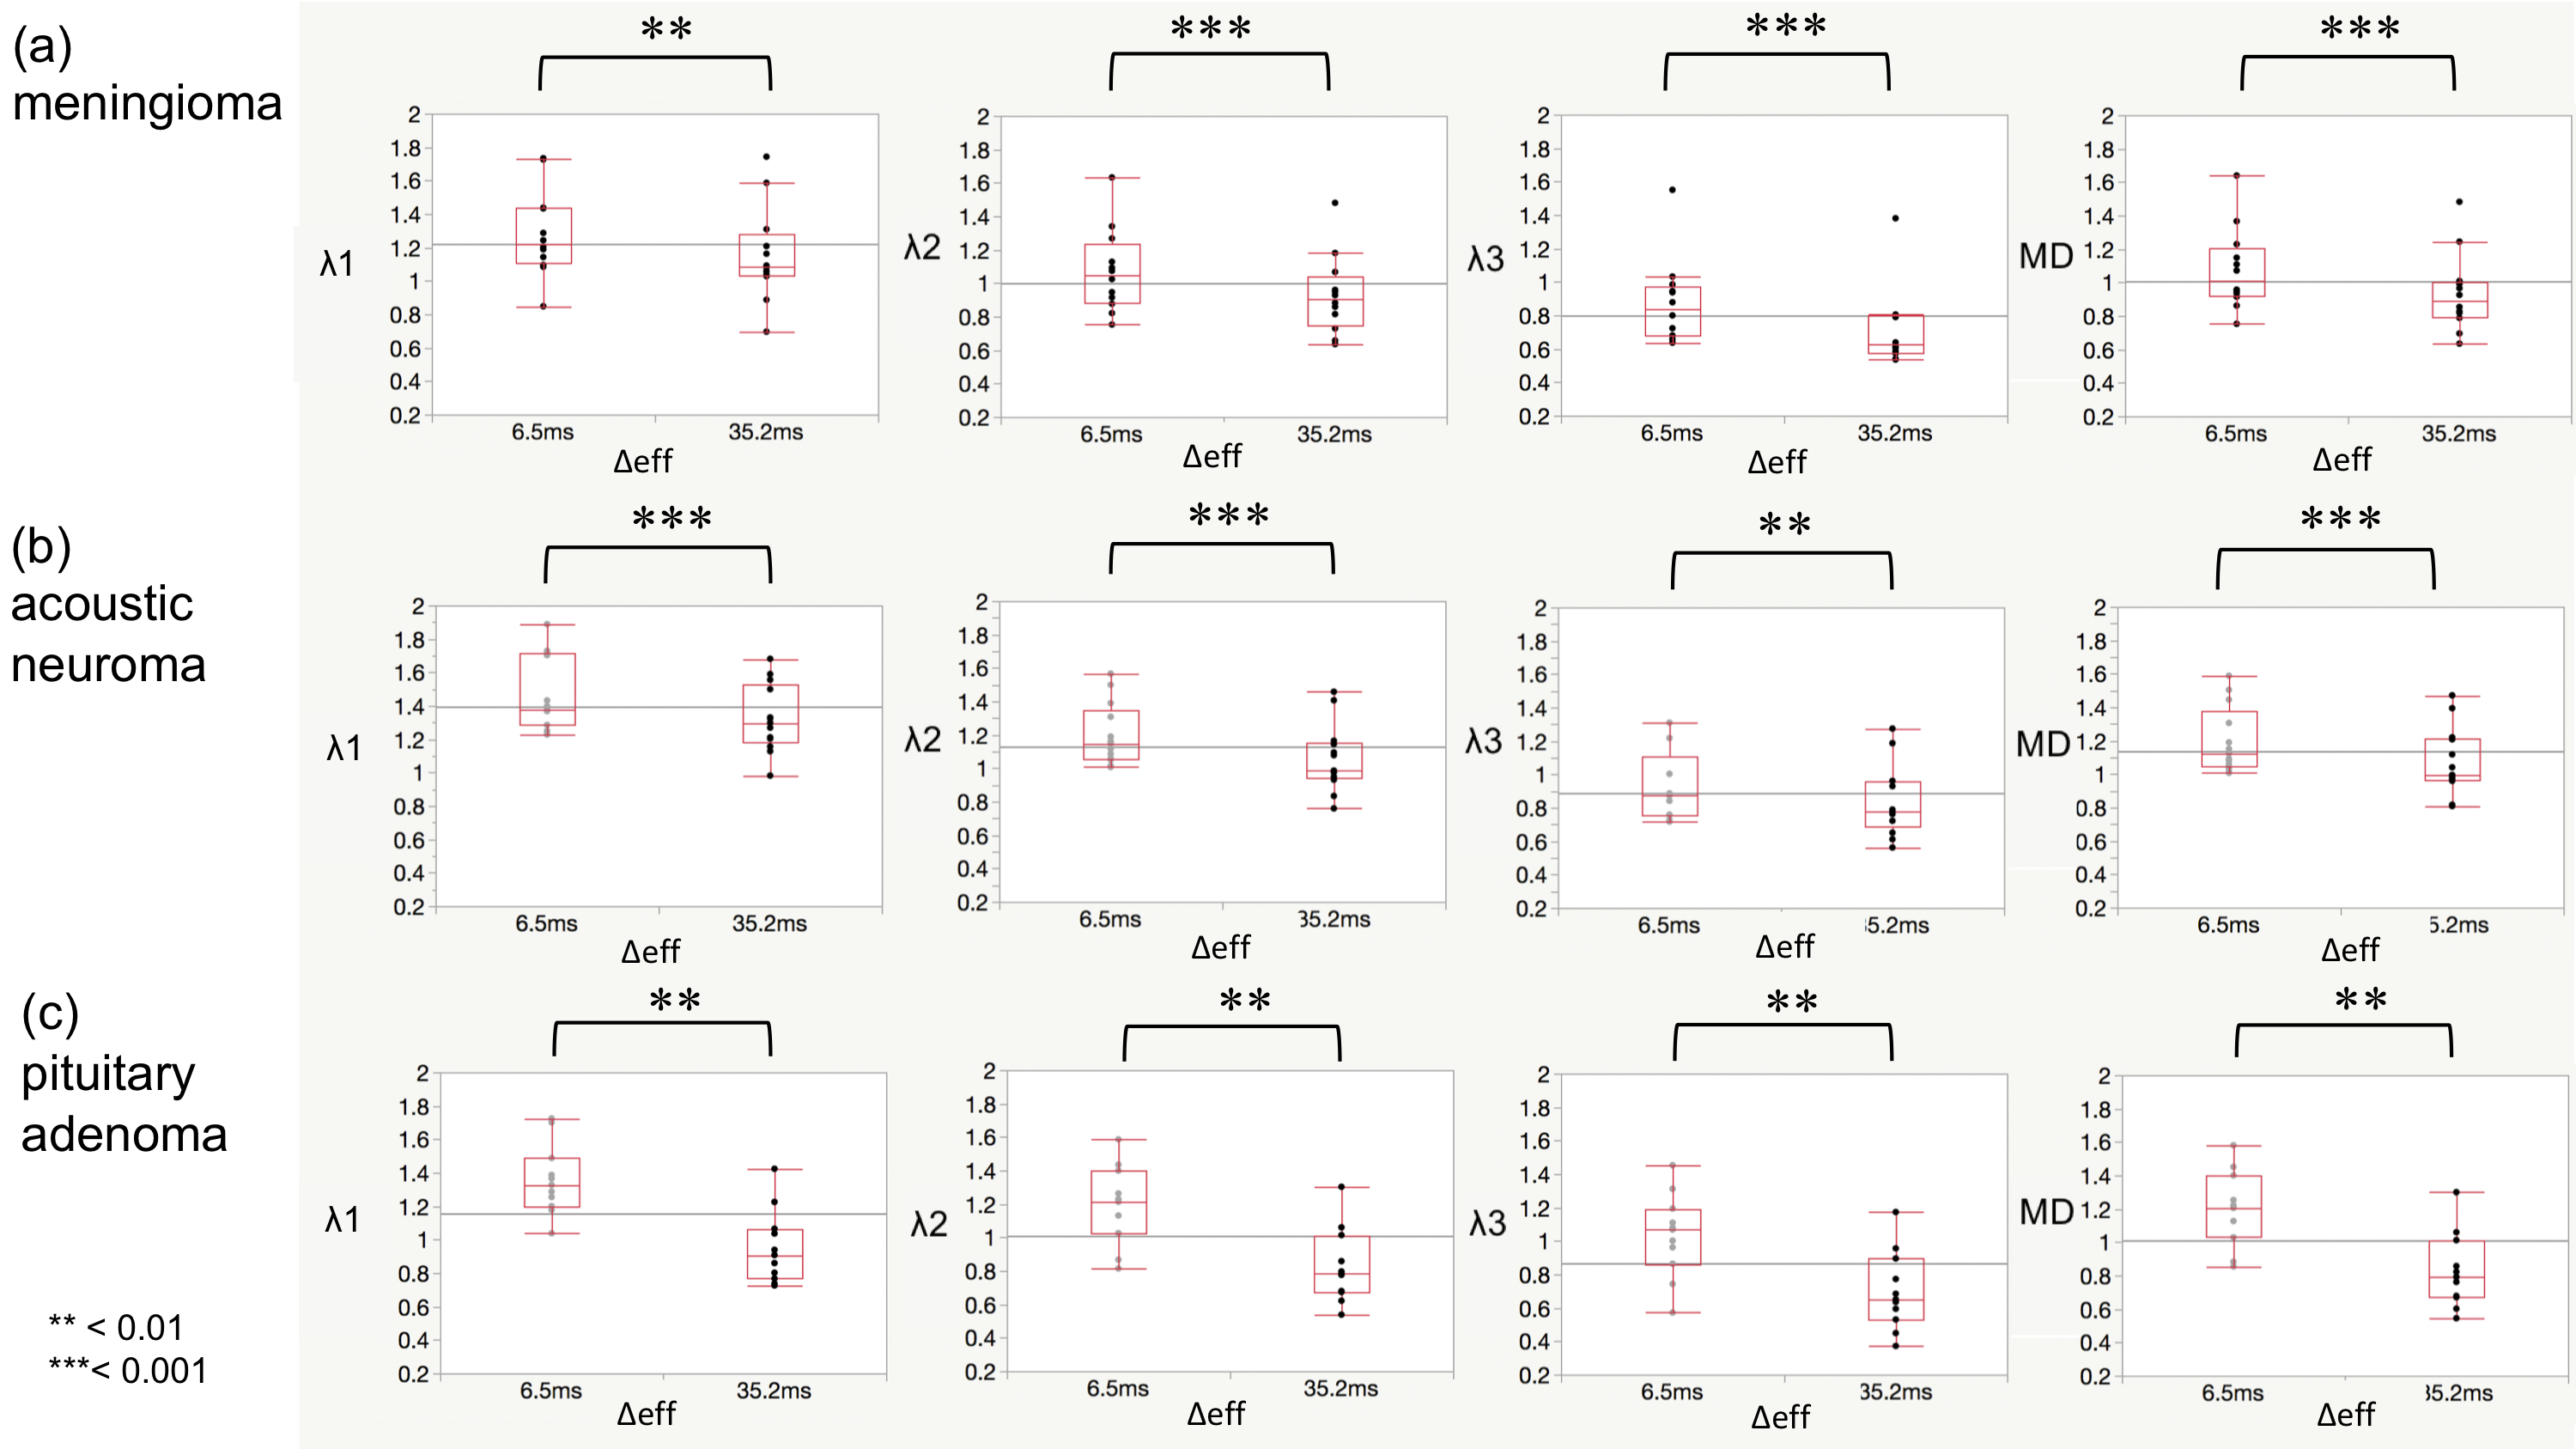
Fig. 4. Box and whisker plots of λ1, λ2, λ3, and MD for Δeff of 6.5 ms and 35.2 ms. The λ1, λ2, λ3, and MD of all brain tumors were significantly higher at the Δeff of 6.5 ms, compared with those at the Δeff of 35.2 ms.
** P < 0.01. *** P < 0.001.
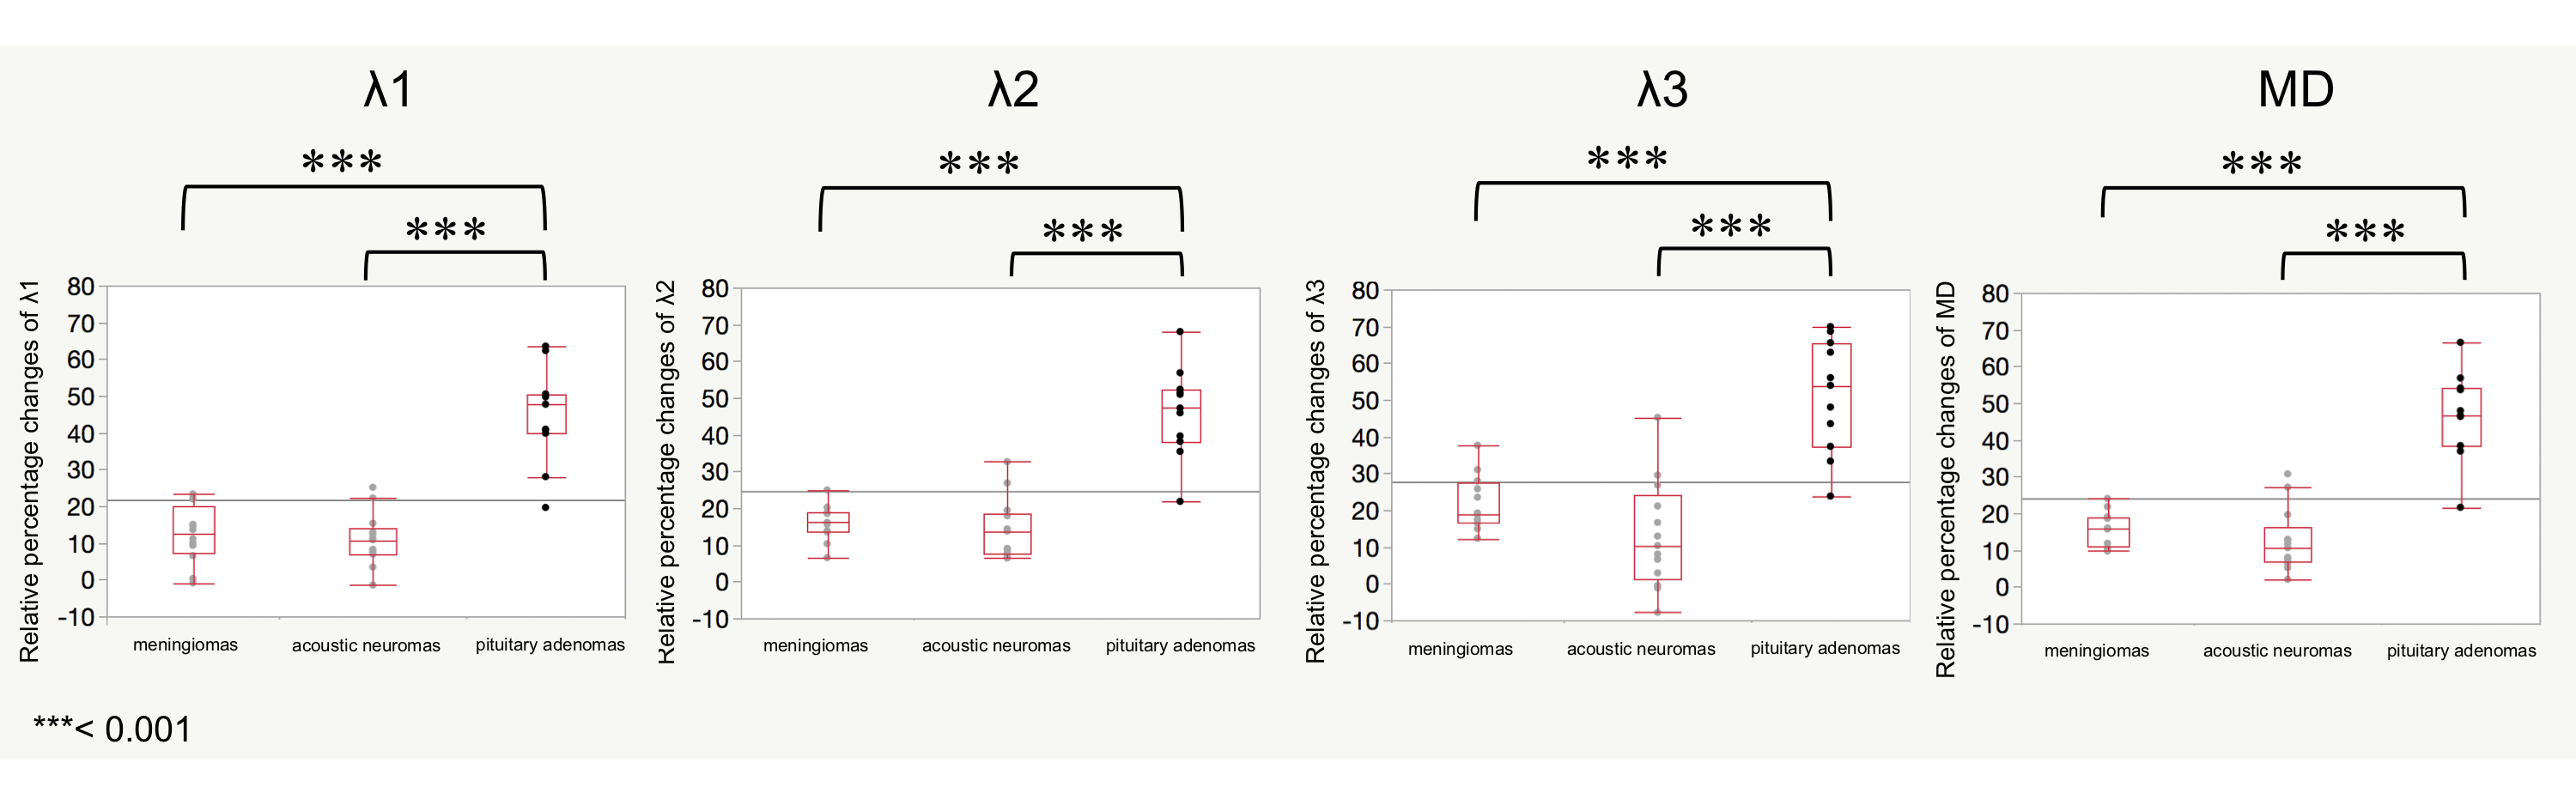
Fig. 5. Box and whisker plots of relative percentage changes in λ1, λ2, λ3, and MD according to Δeff of 6.5 ms and 35.2 ms. The relative percentage changes of λ1, λ2, λ3, and MD were significantly higher in pituitary adenomas than in meningiomas and acoustic neuroma, but not significantly different between meningiomas and acoustic neuroma.
*** P < 0.001.