4722
Diffusion Time Dependence of SANDI Analysis using High Gradient Diffusion MRI Data1Department of Intelligent Medical Engineering, Medical College, Tianjin University, Tianjin, China, 2Department of Network and Information, Tianjin Huanhu Hospital, Tianjin, China, 3Massachusetts General Hospital, Charlestown, MA, United States, 4Athinoula A. Martinos Center for Biomedical Imaging, Department of Radiology, Massachusetts General Hospital, Charlestown, MA, United States, 5Harvard Medical School, Boston, MA, United States, 6Harvard-MIT Division of Health Sciences and Technology, Massachusetts Institute of Technology, Cambridge, MA, United States, 7Department of Biomedical Engineering, College of Precision Instruments and Optoelectronics Engineering, Tianjin University, Tianjin, China
Synopsis
High gradient diffusion MRI has recently been demonstrated to be useful in mapping gray matter microstructure, despite of a few caveats arising from the challenges in comprehensively modeling the complex tissue environments. One example was the assumption of impermeable membranes in the SANDI model and hence its limitation in the presence of water exchange depending on the diffusion time (Δ) used in the MR experiments. We found time-dependence in the signal decay in cortical regions for Δ=19ms~49ms, suggesting fast exchange effects, which might be the cause of the observed time-dependence of the fitting parameters using the standard SANDI model.
Introduction
The method of Soma and Neurite Density Imaging (SANDI) was recently proposed1,2, demonstrating the great potential of high gradient diffusion MRI in mapping the microstructures not only in white matter but also in cortical regions. The used spherical mean signal of the magnitude data has been known to be susceptible to the Rician noise floor. In the meantime, a few studies have suggested the water exchange effect cannot be negligible depending on the diffusion time used. In this study, we used real-valued multi-shell diffusion data3 to fit for the soma fraction and radii according to the SANDI model, with a focus on the comparison between different diffusion times.Methods
Data Acquisition. Data were acquired on a 3T Connectom scanner with up to 300mT/m gradient strength using a 64-channel receiver coil4 . Two diffusion times (Δ=19ms, 49ms) were sampled using a pulsed gradient spin-echo, echo planar imaging (EPI) sequence, with a fixed gradient duration d=8ms and 8 gradient amplitudes for each diffusion time that are equally spaced between 30 and 290 mT/m, yielding a b-value range of 50~6000 s/mm2 for Δ=19ms and 200~17800 s/mm2 for Δ=49ms. 32 directions evenly distributed on a unit sphere were sampled if b≤2300 s/mm2, otherwise 64 directions were sampled. 50 interleaved b=0 images and 5 b=0 images with reversed phase-encoding direction were also collected. Other imaging parameters include: isotropic voxel size of 2mm, in-plane acceleration iPAT=2, slice acceleration SMS/MB=2, TR/TE=4000/77ms, Partial Fourier=6/8, total acquisition time Tacq=55 minutes. Both magnitude and phase data were saved for diffusion MRI. A T1w anatomical image was acquired using an MEMPRAGE sequence with 1mm isotropic voxel size TR/TE=2530/1.15ms, R=3, TI=1100 ms, flip angle=7o, and Tacq=4 minutes.Ten healthy adults participated in this study. The scan-rescan experiments were performed in 2 of them, with a one-hour break outside the scanner between the scan and rescan sessions.
Data Processing and Analysis. The magnitude and phase data of diffusion MRI were combined to calculate real-valued images3,5, which were then corrected for gradient nonlinearity6,7, susceptibility8 and eddy current9,10 distortions. Cortical surface reconstruction and segmentation were obtained from automated FreeSurfer reconstruction on the T1-weighted image (stable version v6.0.0, https://surfer.nmr.mgh.harvard.edu/). The registration between averaged b=0 image and the T1w image was performed using the boundary-based registration tool in FreeSurfer11.
The SANDI model1,12 was fitted using the spherical mean signals of the diffusion data with Δ=19ms and Δ=49ms separately but the signal fraction was defined individually for each compartment. The SANDI tool (https://github.com/daducci/AMICO/wiki/Fitting-the-SANDI-model) of the AMICO package13 was used for model fitting, with an upper bound of 15μm for Rsphere and L2 regularization to improve robustness of fitting. The mean soma volume fractions and radii in different cortical regions were calculated and compared between the two diffusion times. The maps of soma volume fraction were also projected onto the reconstructed cortical surfaces for visualization as in1, and the results of 10 subjects were resampled and averaged on the inflated surface of fsaverage35.
Results
The fitted maps in one representative subject were shown in Fig 1, where cortical regions showed higher soma volume fractions and white matter showed higher neurite fractions. Estimated soma radii were relatively flat throughout the brain (also in Fig 3c) and the apparent values were over-estimated as previously found12. A visual inspection on the performance of registration between the susceptibility-distortion-corrected EPI images and T1w images was shown in Fig 2. Left-right symmetry was observed for soma fractions (Fig 3a), with cerebellar regions demonstrating lower values than cerebral regions. The fitting results were obviously different between Δ=19ms and Δ=49ms data (Fig 3b,c). A decrease in the signal with diffusion time was observed (Fig 3d), suggestive of the fast exchange effects in the cortical gray matter. The repeatability was assessed in two subjects with scan-rescan experiments (Fig 4). The averaged soma fraction across 10 subjects was shown on the inflated cortical surface, which was characterized by a band of low soma fraction aligned with the central sulcus (Fig 5).Discussions
The main finding of the study is the time-dependence in the fitting results. We also found the convergence was significantly poorer if both Δ=19ms and Δ=49ms data were fed simultaneously into the signal model if MCMC fitting procedure were used (data not shown), indicating the limitation in explaining the diffusion process for the current range of D. This time-dependence has also been reported earlier1,12, and the water exchange effect was identified as one of the main cause1,2,12. It was suggested that the exchange effects were negligible for Δ<20ms1. If so, the results yielded by Δ=49ms data were relatively more biased by water exchange, with the lost restricted soma signal interpreted by the model as lower soma fraction and larger soma radii, presumably.Conclusions
The spherical mean signal of real-valued diffusion data were used for SANDI analysis, and compared between diffusion times. Decent scan-rescan repeatability was demonstrated with plausible relative contrast between white and gray matter. However, a significant time-dependence was found, which somehow invalidates the assumption in the standard SANDI model. Given that the diffusion time of <20ms is quite challenging to achieve on clinical scanners, the standard model of SANDI might not be readily practical to be applied in clinical settings.Acknowledgements
This work was supported by NIH funding U01-EB026996 R01-NS118187 DP5-OD031854 and Instrumentation Grants S10-RR023401, S10-RR023043, and S10-RR019307. Funding support was also received from the NSFC 82071994.References
1. Palombo M, Ianus A, Guerreri M, et al. SANDI: A compartment-based model for non-invasive apparent soma and neurite imaging by diffusion MRI. NeuroImage. 2020;215:116835.
2. Afzali M, Nilsson M, Palombo M, Jones DK. SPHERIOUSLY? The challenges of estimating sphere radius non-invasively in the human brain from diffusion MRI. NeuroImage. 2021;237:118183.
3. Fan Q, Nummenmaa A, Witzel T, et al. Axon diameter index estimation independent of fiber orientation distribution using high-gradient diffusion MRI. NeuroImage. 2020;222:117197.
4. Keil B, Blau JN, Biber S, et al. A 64-channel 3T array coil for accelerated brain MRI. Magnetic Resonance in Medicine. 2013;70(1):248-258.
5. Eichner C, Cauley SF, Cohen-Adad J, et al. Real diffusion-weighted MRI enabling true signal averaging and increased diffusion contrast. Neuroimage. 2015;122:373-384.
6. Fan Q, Witzel T, Nummenmaa A, et al. MGH-USC Human Connectome Project datasets with ultra-high b-value diffusion MRI. Neuroimage. 2016;124(Pt B):1108-1114.
7. Jovicich J, Czanner S, Greve D, et al. Reliability in multi-site structural MRI studies: effects of gradient non-linearity correction on phantom and human data. Neuroimage. 2006;30(2):436-443.
8. Andersson JLR, Skare S, Ashburner J. How to correct susceptibility distortions in spin-echo echo-planar images: application to diffusion tensor imaging. Neuroimage. 2003;20(2):870-888.
9. Andersson JLR, Graham MS, Zsoldos E, Sotiropoulos SN. Incorporating outlier detection and replacement into a non-parametric framework for movement and distortion correction of diffusion MR images. Neuroimage. 2016;141:556-572.
10. Andersson JLR, Sotiropoulos SN. An integrated approach to correction for off-resonance effects and subject movement in diffusion MR imaging. Neuroimage. 2016;125:1063-1078.
11. Greve DN, Fischl B. Accurate and robust brain image alignment using boundary-based registration. Neuroimage. 2009;48(1):63-72.
12. Olesen JL, Østergaard L, Shemesh N, Jespersen SN. Diffusion time dependence, power-law scaling, and exchange in gray matter. arXiv preprint arXiv:210809983. Published online 2021.
13. Daducci A, Canales-Rodríguez EJ, Zhang H, Dyrby TB, Alexander DC, Thiran JP. Accelerated Microstructure Imaging via Convex Optimization (AMICO) from diffusion MRI data. Neuroimage. 2015;105:32-44.
Figures
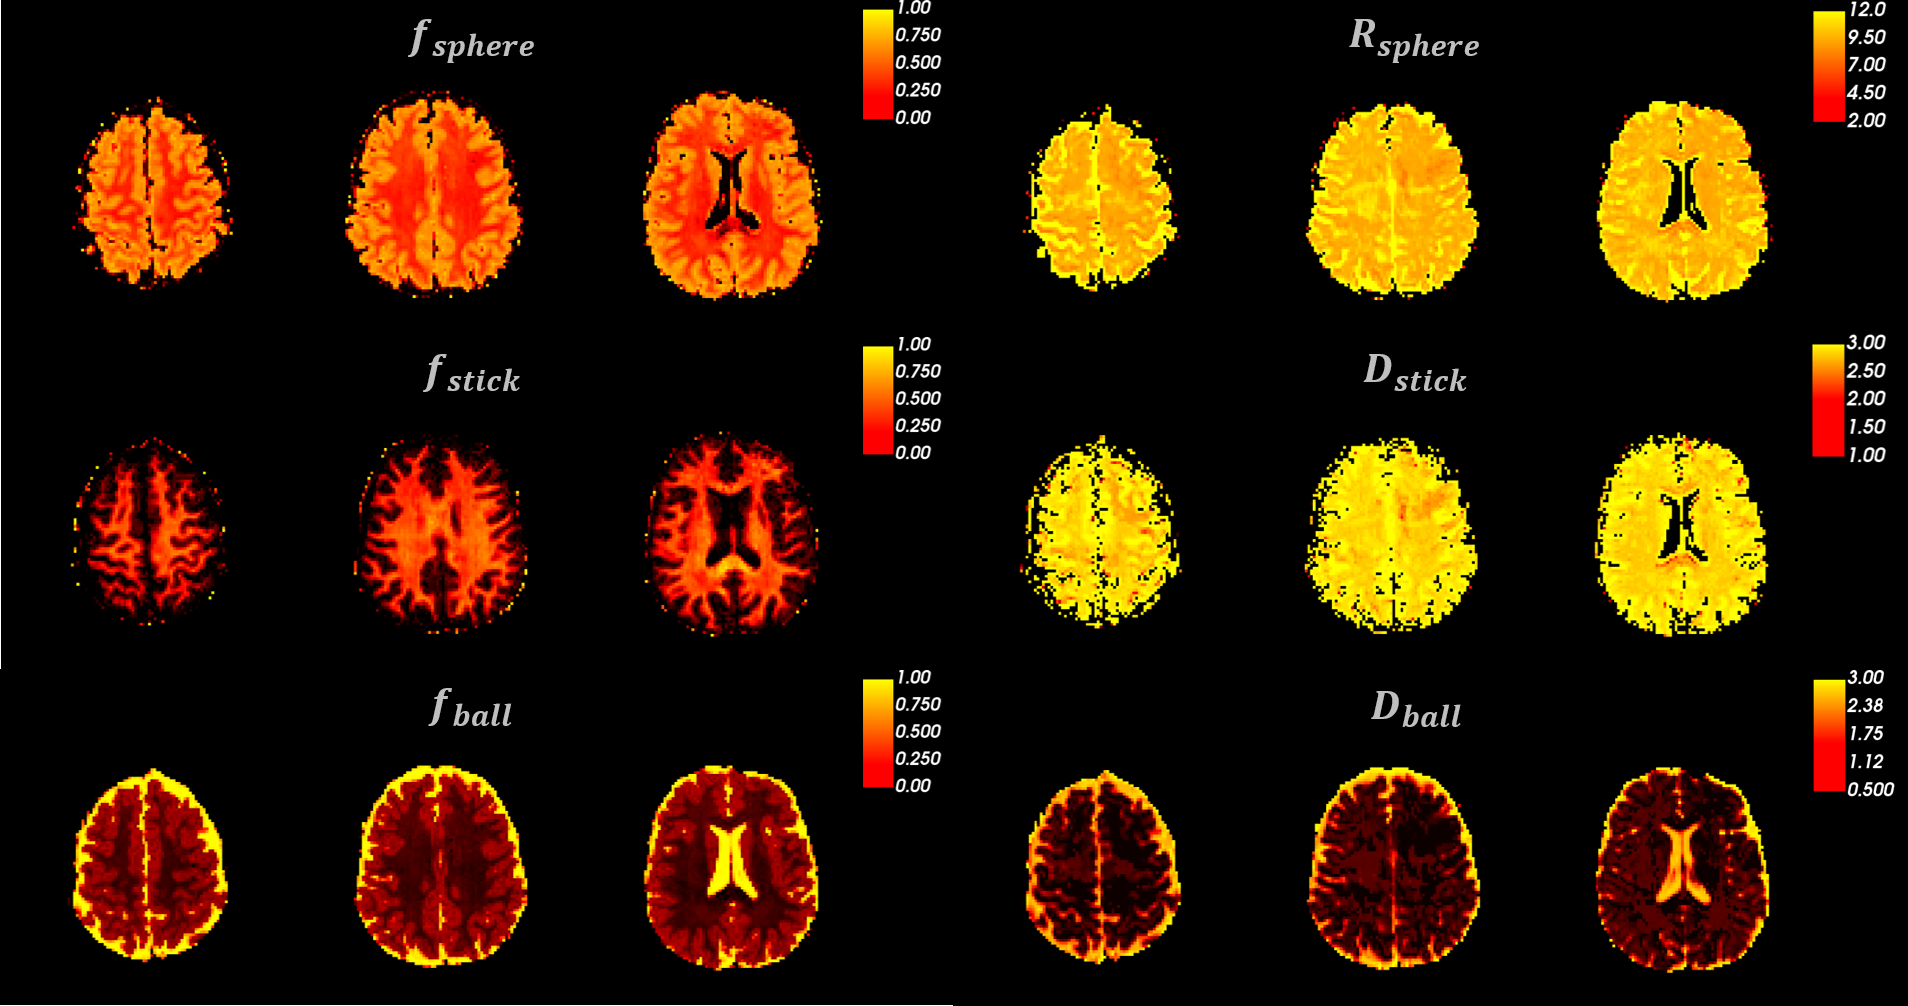
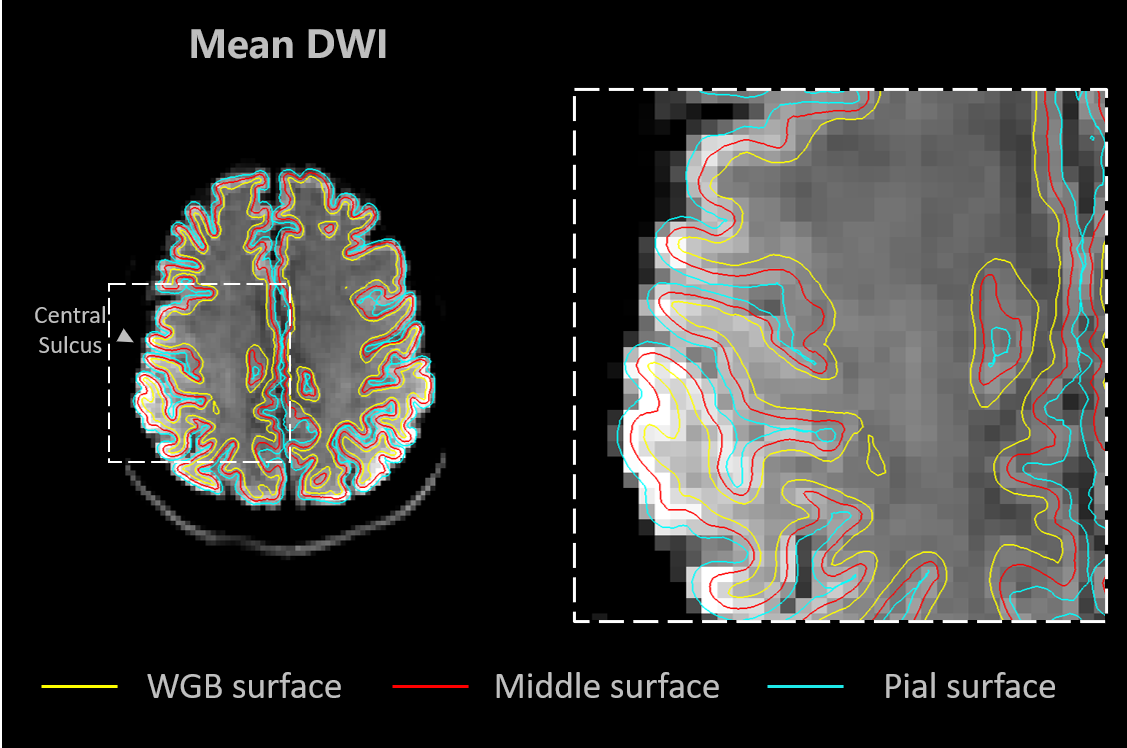
Fig 2. The surface contours overlaid on the mean DWI image of b=800 s/mm2. The performance of the registration between the EPI images and T1w MEMPRAGE image can be assessed visually. The surfaces at pial (light blue), white gray boundary (WGB, yellow), and half-way between the pial and WGB (red) were contoured. The group average results were sampled at the 50% depth of the cortex (red).
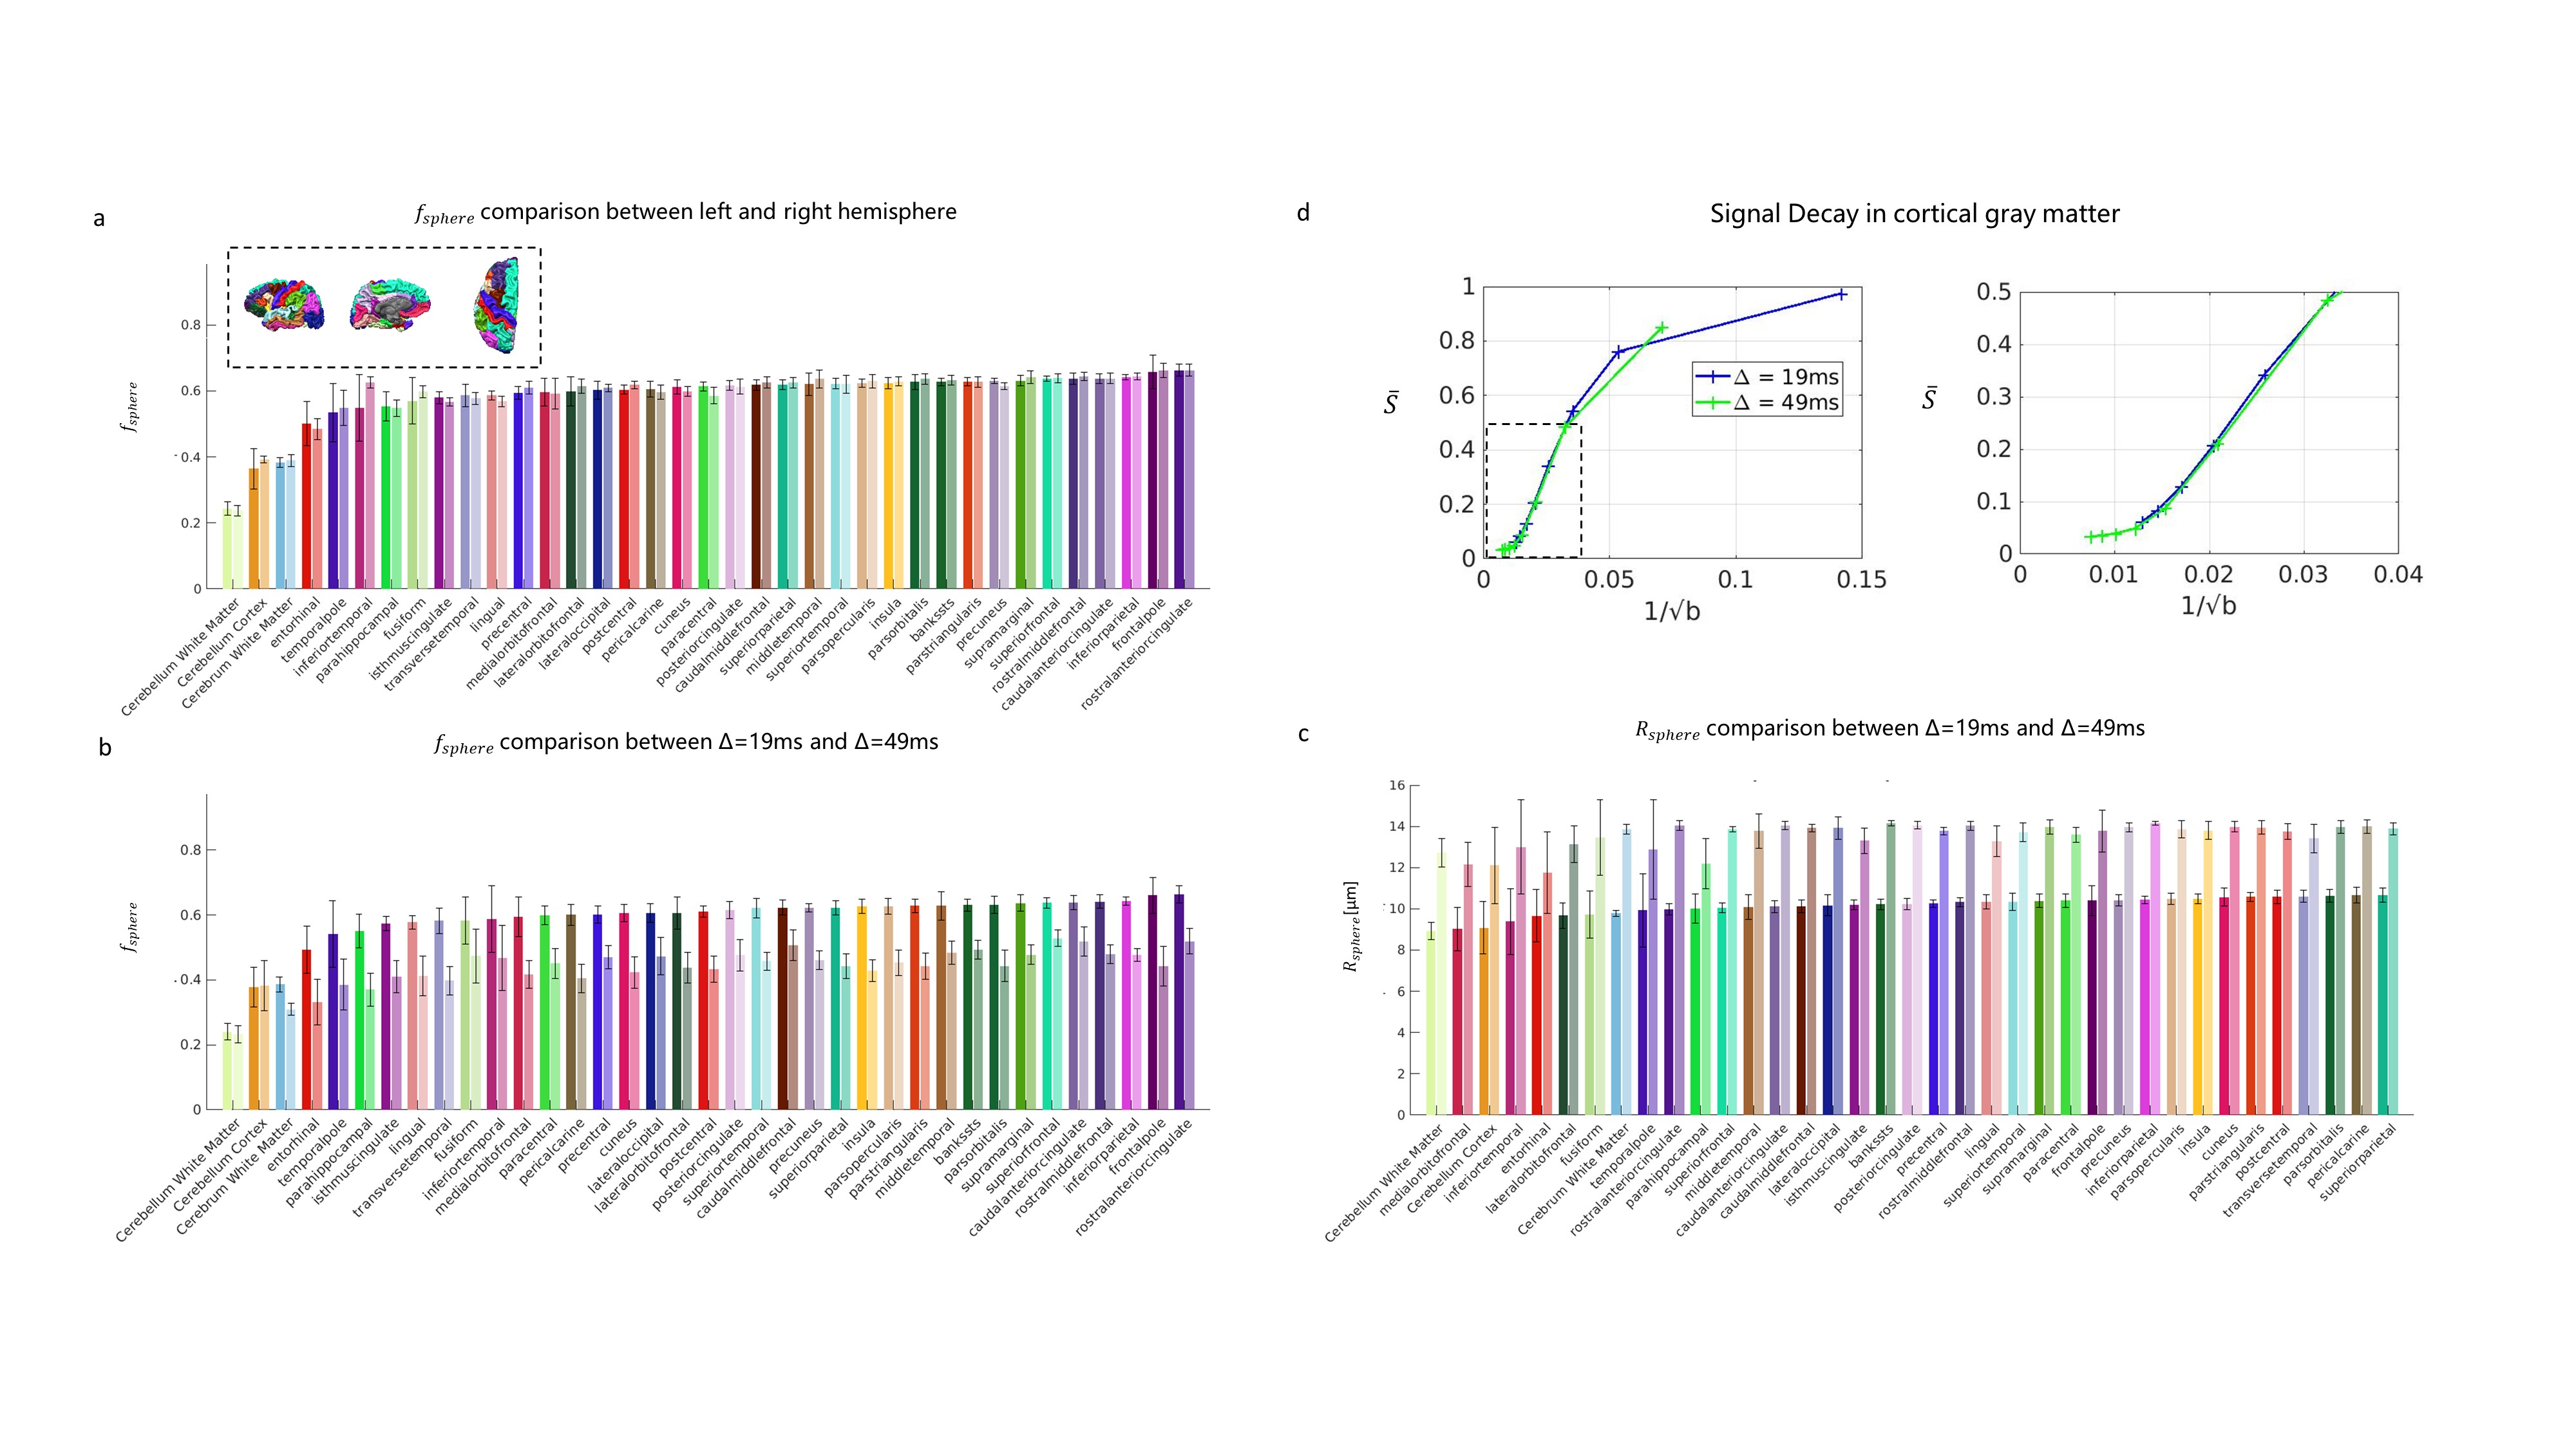
Fig 3. ROI averaged estimates across the whole brain. (a) The mean and standard deviation of soma fraction (fsphere) estimates across 10 subjects, with left (solid color) and right (transparent color) hemisphere ROIs listed side by side. (b) Comparison of fsphere between Δ=19ms (solid) and Δ=49ms (transparent) data, where results were averaged between left and right first. (c) Comparisons of soma radius estimates between Δ=19ms (solid) and Δ=49ms (transparent) data. (d) Signal averaged in whole cortex of 1 subject, the decrease with Δ indicates the time-dependence characteristic.
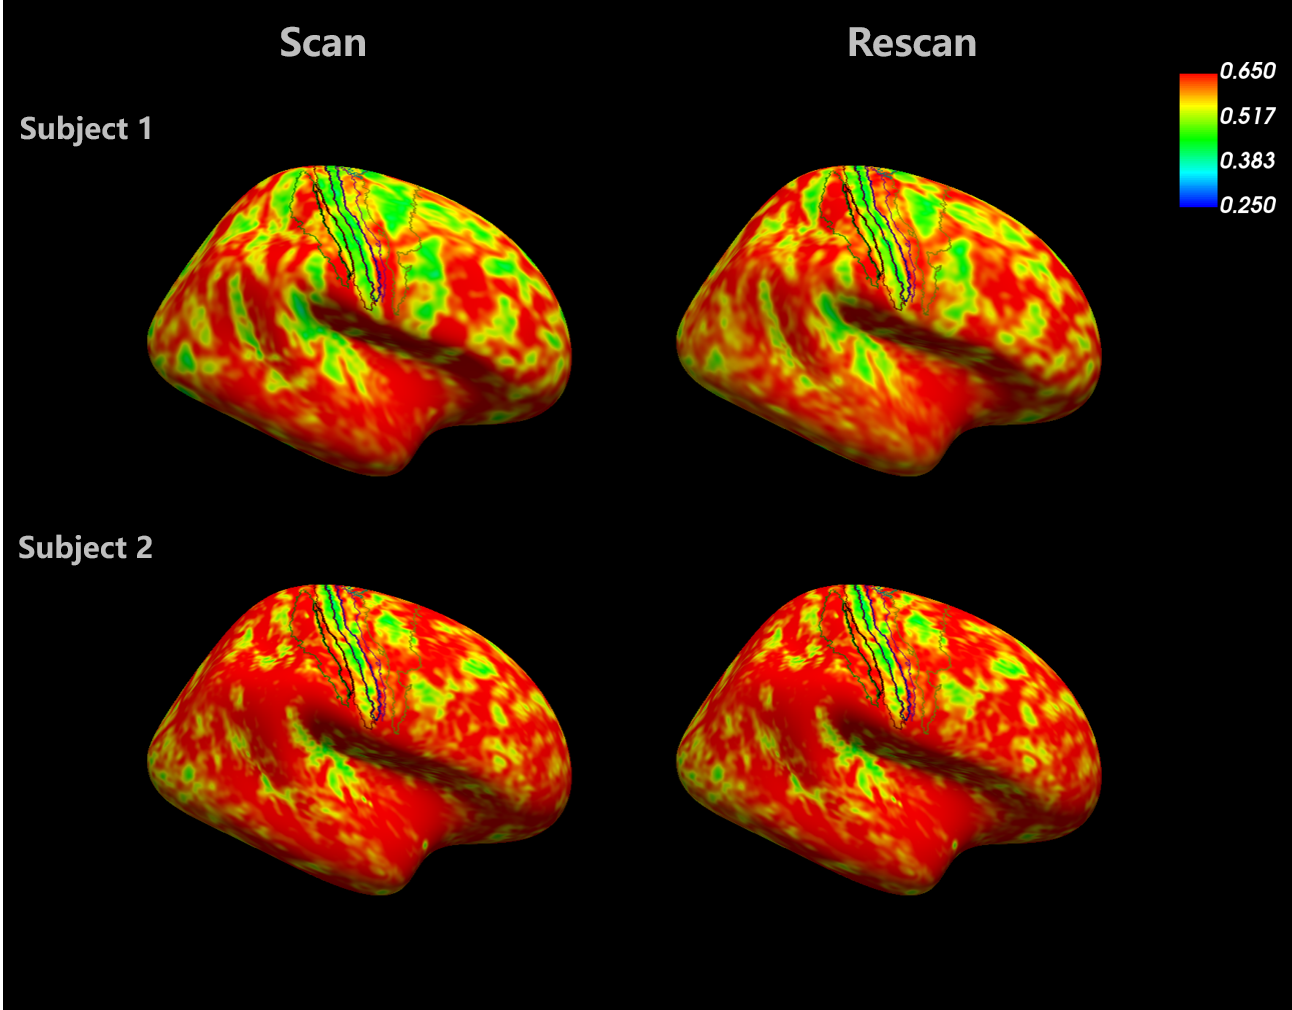
Fig 4. Assessment of scan-rescan repeatability in two subjects. The surface at 50% of cortical depth was used to sample the soma fraction estimates, which were then projected onto the inflated surface to facilitate visual inspection. The contours of the same anatomical regions as shown in Fig 5 were landmarked. Variations in the pattern of whole brain distribution were seen between subjects, but the band that appears at central sulcus was robustly seen across subjects.
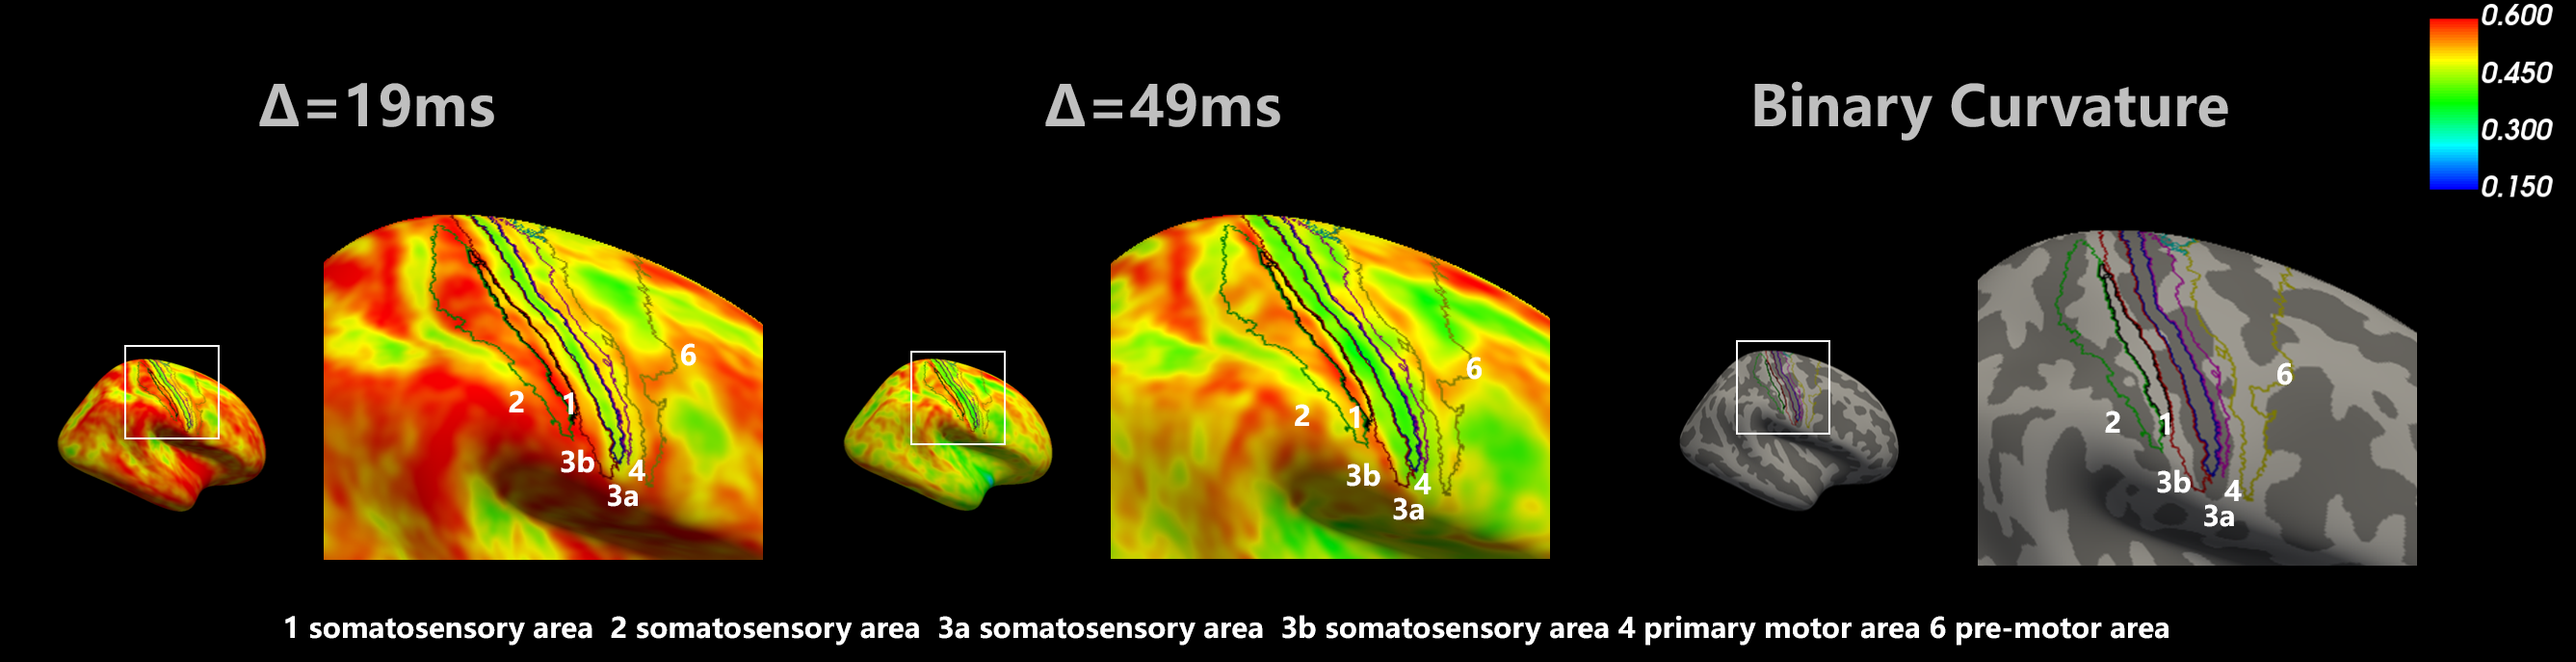
Fig 5. Comparison of soma estimates between the two diffusion times. For each subject, the soma estimates were sampled at 50% cortical depth, and the yielded surface was resampled onto the common surface, where averaging across 10 subjects was performed. The Brodmann area 1,2,3,4,6 were landmarked, and the same view of binary curvature was also presented for reference.