4721
Differential association of apparent diffusion coefficient, apparent myelin water fraction, and T1w/T2w ratio in white matter and grey matter
Nan-Hao Chen1, Li-Ping Chen2, Chia-Wei Hsu2, Chin-Hua Yang1,2,3, and Hsu-Hsia Peng1
1Department of Biomedical Engineering and Environmental Sciences, National Tsing Hua University, Hsinchu, Taiwan, 2National Taiwan University Hospital Hsinchu Branch, Hsinchu, Taiwan, 3Taoyuan General Hospital, Ministry of Health and Welfare, Taoyuan, Taiwan
1Department of Biomedical Engineering and Environmental Sciences, National Tsing Hua University, Hsinchu, Taiwan, 2National Taiwan University Hospital Hsinchu Branch, Hsinchu, Taiwan, 3Taoyuan General Hospital, Ministry of Health and Welfare, Taoyuan, Taiwan
Synopsis
The purpose of this study was to evaluate the differential associations among various myelin-related indices in white matter (WM) and grey matter (GM) to comprehend the alteration of microstructural integrity in brain tissue. We calculated mean, coefficient of variance (CV), and peak probability of ADC, apparent myelin water fraction (aMWF), and T1w/T2w ratio and found differential associations among myelin-related indices in GM and WM. In conclusion, measurements of ADC, aMWF, and T1w/T2w ratio as well as their correlations can help to understand characteristics of microstructural tissue integrity in GM and WM.
Introduction
Apparent diffusion coefficient (ADC) can quantify the diffusivity in white matter (WM) and grey matter (GM). ADC in GM is generally higher than WM because of higher water content1. Because of myelin enrichment2, the myelin water fraction (MWF) an evaluation of myelination , in WM is usually higher than in GM. The apparent MWF (aMWF) measured by Direct Visualization of Short Transverse Relaxation Time Component (ViSTa) sequence3 showed great reproducibility and high correlation with MWF.4 Optimized ViSTa possesses shorter scan time (~4.5 mins) and has better signal-to-noise ratio in aMWF map than conventional MWF map4. T1w/T2w ratio is an alternative evaluation of myelin contents5. However, a dedicated standardization process of signal intensity in T1 and T2 weighted images is important for quantification of myelin5,6. Studies have demonstrated that the changes of microstructural tissue integrity can alter the mean, heterogeneity, or the probability of peak value (peak probability) of T2 and diffusion metrics in elderly or patients with Alzheimer’s disease7,8. Although the correlations between MWF, T1w/T2w ratio, and diffusivity have been reported9, the associations between aMWF and aforementioned indices remain unclear, and differential association among these indices in WM and GM has not been discussed. The purpose of this study was to evaluate the differential associations among various myelin-related indices in WM and GM to comprehend the alteration of microstructural integrity in brain tissue.Methods
Twelve healthy volunteers were recruited (male/female=8/4, age=48±20 (28-68) y/o). All MRI images were acquired in a 3.0T system (Skyra, Siemens). The imaging protocols included diffusion weighted imaging (DWI), T2WI, T1WI, and ViSTa sequence5. The scanning parameters were: DWI with TR/TE=7100/64 ms, FA=90°, b=0 and 1000 (s/mm2); T2WI with TR/TE=6750/101 ms; T1WI with TR/TE=2190/2.25 ms, FA = 10°, all above sequences were acquired with pixel size=4*4 mm2, slice thickness=4 mm. ViSTa was acquired with TR/TE=1160/7.6 ms, TI = 560 ms, pixel size=1.9*1.9 mm2, slice thickness = 5 mm; PDw with TR/TE=75/7.6 ms, FA=28°. Substituted for MWF, Apparent myelin water fraction (aMWF) is calculated by: 7. T1w/T2w ratio map is the division of T1WI and T2WI with bias correction and intensity standardization9. To adjust all images in a template space, T1WI of each participant was registered on MCALT T1 template provided from Aging and Dementia Research (ADIR) lab at Mayo Clinic. We applied WM estimation twice to optimize the registration results. All images were registered to T1WI by ANTs toolbox. After image preprocessing, we used “JHU-MNI-SS” atlas transformed T1WI to MCALT space (Figure 1a). The ROIs in white matter included anterior and posterior limbs of internal capsule and external capsule. The ROIs in grey matter included caudate, putamen, global pallidus, and thalamus. To evaluate the heterogeneity within ROI, we calculated the coefficient of variation (CV) and peak probability of the normalized histogram of ADC, aMWF, and T1w/T2w ratio in each ROI.Results
Figure 1b demonstrates ADC, aMWF, and T1w/T2w ratio maps in a 28-year-old male. In Figure 2, WM exhibited significantly lower ADC and higher aMWF and T1w/T2w ratio (than that in GM (all p<0.001). In Figure 3a, in comparison to GM, WM possessed lower CV of ADC, aMWF, and T1w/T2w ratio (all p<0.05). In Figure 3b, WM exhibited significantly higher peak probability of ADC and lower peak probability of aMWF than GM (both p<0.001).Table 1 summarizes correlations of mean, CV, and peak probability among various myelin-related indices in WM and GM. Regarding the mean values, ADC negatively correlated with aMWF in WM (p<0.001) and with T1w/T2w ratio in both WM and GM (p<0.05 and 0.001, respectively). aMWF showed positive correlation with T1w/T2w ratio in GM (r=0.52, p<0.001). As for CV, GM presented significant correlations among all myelin-related indices (r=0.43-0.55, p<0.01~0.001) while WM only exhibited correlations between aMWF and T1w/T2w ratio (r=0.69, p<0.001). Moreover, peak probability of ADC presented significant correlations only with aMWF (p<0.05) and T1w/T2w ratio (p<0.001) in WM.
Discussion & Conclusion
We calculated mean, CV, and peak probability of ADC, aMWF, and T1w/T2w ratio and found differential associations among myelin-related indices in GM and WM. The mean values of various indices reflected different tissue characteristics while the CV and peak probability indicated the heterogeneity and the dominance of main component in tissue, respectively.The correlations of mean T1w/T2w ratio with aMWF in GM and WM were consistent with previous studies10. Although T1w/T2w ratio should not be interpreted as myelin-specific measurements6,9,10, mean values of T1w/T2w ratio in GM and CV of T1w/T2w ratio in GM and WM exhibited moderate correlations with that of aMWF. ADC presented different correlations with aMWF in WM and T1w/T2w ratio in GM, confirming that aMWF is in a suitable measurement of myelin content in WM3, and T1w/T2w ratio is for subcortical regions or GM5,6. Of note, the correlations presented in mean values were not necessarily duplicated in CV or peak probability, suggesting the usefulness of evaluating these three indices for various quantitative images.
In conclusion, using various myelin-related indices can help to understand characteristics of microstructural tissue integrity in GM and WM. The differential associations of mean, CV, and peak probability between ADC, aMWF and T1w/T2w ratio can be useful to comprehend changes of microstructural tissue integrity.
Acknowledgements
No acknowledgement found.References
- Helenius J., Soinne L., Perkiö J. et al. Diffusion-weighted MR imaging in normal human brains in various age groups. AJNR Am J Neuroradiol. 2002;23(2):194-199.
- MacKay A.L., Laule C. Magnetic Resonance of Myelin Water: An in vivo Marker for Myelin. Brain Plast. 2016;2(1):71-91.
- Oh S.H., Bilello M., Schindler M., Markowitz C.E., Detre J.A., Lee J.H. Direct visualization of short transverse relaxation time component (ViSTa). Neuroimage. 2013;83:485-492.
- Choi, J.Y., Jeong, I.H., Oh, S.H., Oh, C.H., Park, N.Y., Kim, H.J. and Lee, J., Evaluation of Normal-Appearing White Matter in Multiple Sclerosis Using Direct Visualization of Short Transverse Relaxation Time Component (ViSTa) Myelin Water Imaging and Gradient Echo and Spin Echo (GRASE) Myelin Water Imaging. J. Magn. Reson. Imaging 2019;49:1091-1098.
- Ganzetti M., Wenderoth N., Mantini D. Whole brain myelin mapping using T1- and T2-weighted MR imaging data. Front. Hum. Neurosci 2014;8:671
- Matthew F., Glasser and David C., Van Essen. Mapping Human Cortical Areas In Vivo Based on Myelin Content as Revealed by T1- and T2-Weighted MRI. Journal of Neuroscience 10 August 2011, 31 (32) 11597-11616
- Schiavone F., Charlton R.A., Barrick T.R., Morris R.G. and Markus H.S., Imaging age-related cognitive decline: A comparison of diffusion tensor and magnetization transfer. MRI. J. Magn. Reson. Imaging 2009; 29: 23-30.
- Wearn A.R., Nurdal V., Saunders-Jennings E. et al. T2 heterogeneity: a novel marker of microstructural integrity associated with cognitive decline in people with mild cognitive impairment. Alz Res Therapy 2020;12:105.
- Grydeland H., Walhovd K.B., Tamnes C.K., Westlye L.T., Fjell A.M. Intracortical myelin links with performance variability across the human lifespan: results from T1- and T2-weighted MRI myelin mapping and diffusion tensor imaging. J Neurosci. 2013;33(47):18618-18630.
- Uddin, M.N., Figley, T.D., Solar, K.G. et al. Comparisons between multi-component myelin water fraction, T1w/T2w ratio, and diffusion tensor imaging measures in healthy human brain structures. Sci Rep 2019;9:2500.
Figures
Figure 1. (a)
The maps of apparent diffusion coefficient (ADC), signal intensity of fluid
attenuation inversion recovery (FLAIR), apparent myelin water fraction (aMWF),
and T1w/T2w ratio in a young 28 year-old male. (b) The selected
region-of-interests (ROIs) in grey matter include caudate (blue), putamen
(red), global pallidus (green), and thalamus (cyan) and in white matter include
anterior limb of internal capsule (pink), posterior limb of internal capsule
(yellow), and external capsule (purple).
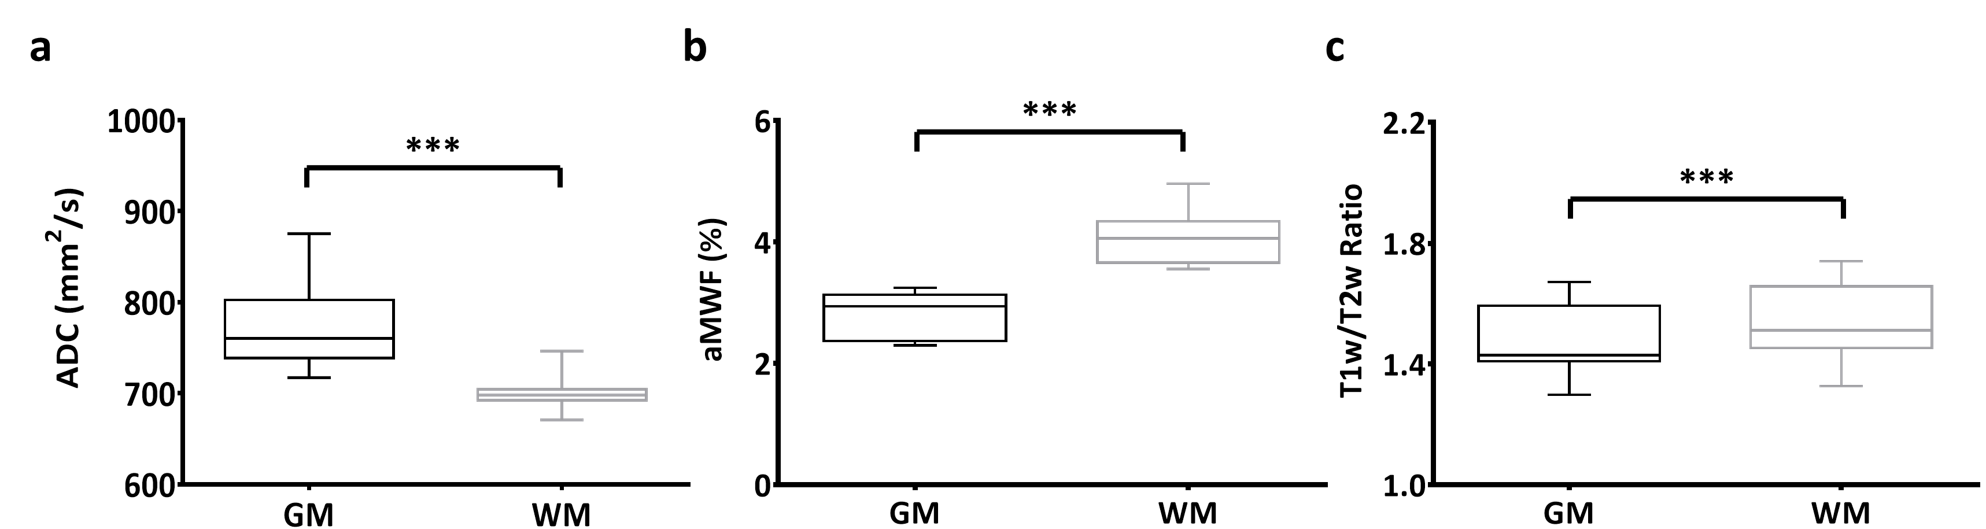
Figure 2. Regional
average of (a) ADC, (b) aMWF and (c) T1w/T2w ratio in gray matter
(GM) and white matter (WM). ***p
< 0.001.
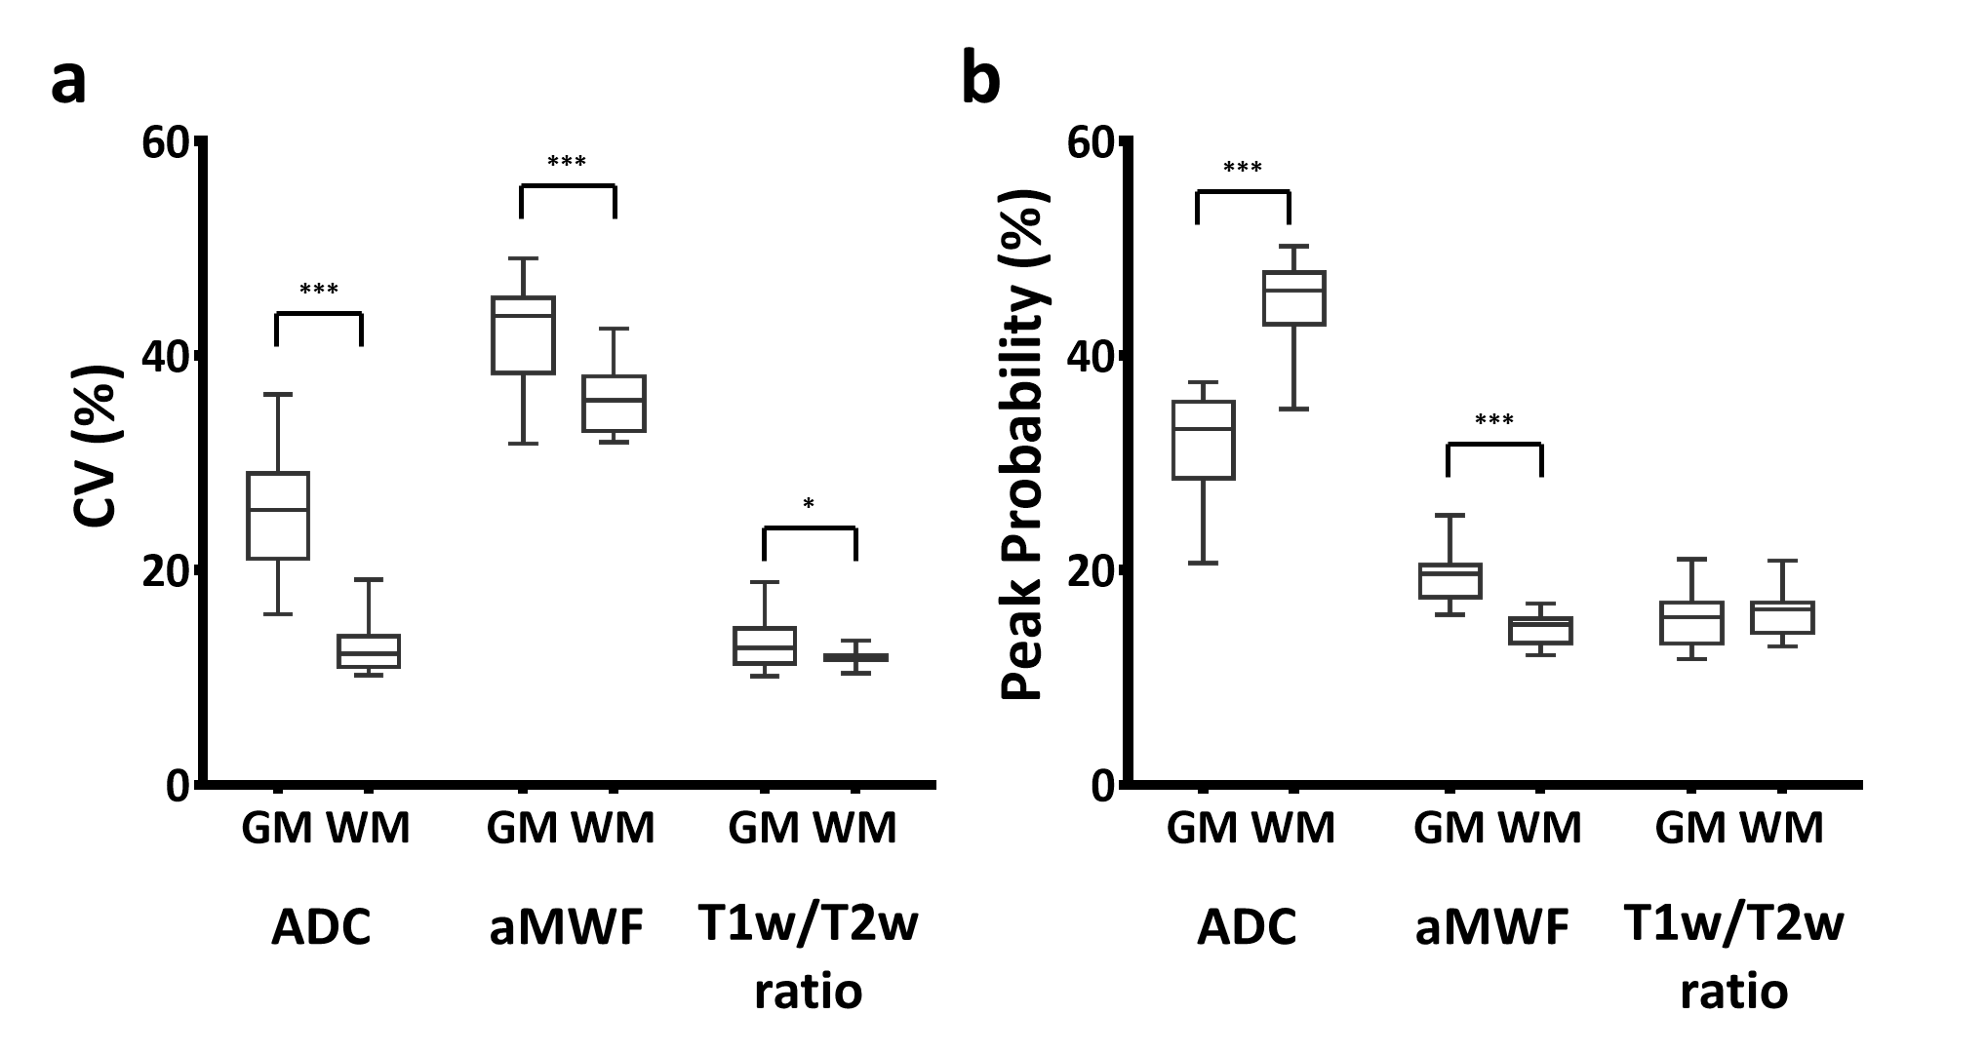
Figure 3. Tissue
heterogeneity represented by coefficient of variation (a) and peak probability
(b) of ADC, aMWF, and T1w/T2w ratio in GM and WM. *p < 0.05, ***p < 0.001.

Table 1. Pearson’s
correlation coefficients of mean, CV, and peak probability between ADC, aMWF,
and T1w/T2w ratio.
DOI: https://doi.org/10.58530/2022/4721