4720
Preliminary Assessment of Intravoxel Incoherent Motion Diffusion-Weighted MRI (IVIM-DWI) Metrics in Normal Brain Tissue
Fan Yu1, Qiuxuan Li1, Cheng Zhao1, Mo Zhang1, Liangjie Lin2, Jiazheng Wang2, and Jie Lu1
1Radiology and Nuclear medicine, Xuanwu Hospital, Capital Medical University, Beijing, China, 2Philips Healthcare, Beijing, China, Beijing, China
1Radiology and Nuclear medicine, Xuanwu Hospital, Capital Medical University, Beijing, China, 2Philips Healthcare, Beijing, China, Beijing, China
Synopsis
The microstructure and micro-perfusion changes in normal brain aging is barely understand. The objective of this study is to describe these microscopic changes in normal brain tissue by intravoxel incoherent motion diffusion-weighted MRI (IVIM-DWI). Preliminary results show decreased D, D* and increased f in elder subjects compare with the youngers.
Introduction
Health of aging brain is a topic of increased interest in recent years given the expected aging of the world's population. Relationship has been found in iron accumulation [1], protein content [2], and perfusion defect [3] with the age. However, hardly any study focuses on microstructure and micro-perfusion changes in normal brain aging. Hence, this study is aimed to describe these microscopic changes in normal brain tissue by intravoxel incoherent motion diffusion-weighted MRI (IVIM-DWI).
Methods
25 subjects gave written informed consent before participating in this study. Inclusion criteria for the study were as follows: aged between 20 and 49 years old; normal results of T1WI, T2WI, fluid-attenuated inversion recovery, diffusion-weighted imaging; no history of head trauma, central nervous system infection, or cerebral structural lesions; and no psychiatric diseases or exposure to psychotropic drugs. All subjects were divided into three different age groups (group 1: 20-29, group 2: 30-39, group 3: 40-49). MR scans were carried out on a 3.0T scanner (Ingenia, Philips Healthcare, Best, the Netherlands) using a 16-channel head coil. Standard T1-weighted anatomical images were acquired with parameters as: TR/TE, 600/28.3 ms; acquisition matrix, 252×250; voxel size, 1.0×1.0 mm2; slice thickness/gap 1.0/-0.5 mm; 327 sagittal slices; flip angle, 90°). IVIM-DWI was performed using 10 b-values (0, 25, 50, 75, 100, 200, 500, 1000, 2000 and 3000) s/mm2, and other parameters included: TR/TE, 4200/105 ms; acquisition matrix, 110×110; voxel size 2.0×2.0 mm; slice thickness, 3.0 mm, number of slices, 28). IVIM images was reconstructed using the Medical Imaging Interaction Toolkit (MITK), with the apparent diffusion coefficient (D) and the perfusion fraction (f) first fitted using images by b values >1000 s/mm2, and then the pseudo-diffusion coefficient (D*) fitted with images by b values ≤ 1000 s/mm2. The atlas-based D, D*, f analyses were performed using the PMOD Software (Version 3.902). First, the D, D*, f parametric maps were registered to the T1WI image, and then the T1WI was registered to the standard brain. Then, 67 brain regions were separated by using the Anatomical Automatic Labeling (AAL) atlas provided by Montreal Neurological Institute (MNI). Finally, D, D*, f values of the 67 regions and whole brain were automatically calculated. A one-way analysis of variance (ANOVA) was applied to assess the statistical differences among the mean D, D* or f values for three different age groups. P<0.05 was considered statistically significant.
Results
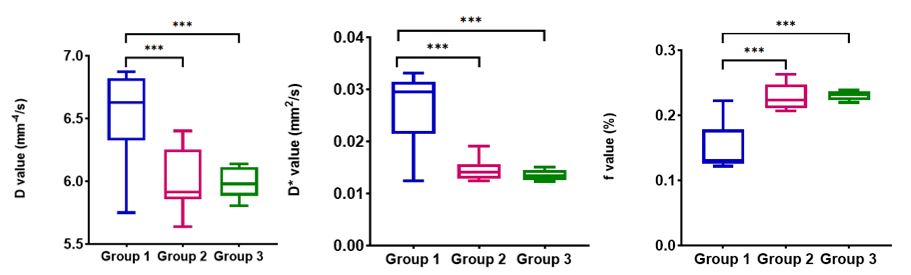
For whole brain analysis, D and D* value were significantly higher in group 1 compared with group 2 and 3 (P≤0.001). Compared with group 2 and 3, f value was significantly lower in group 1 (P<0.001, table 1). No significant differences were observed in D, D*, f value between group 2 and 3 (Figure 1). For regional analysis, D* value were significantly higher in group 1 compared with group 2 or 3 among all the 67 brain regions (P≤0.01). D value were significantly higher in group 1 compared with group 2 or 3 among 49 brain regions (P<0.05). f value was significantly higher in group 1 compared with group 2 or 3 among 62 brain regions (P<0.05, Figure 2).
Discussion
IVIM refers to a microscopic translational motion within a given voxel, and can be detected by using the diffusion weighted MR methods. IVIM-DWI provides important information about extracellular processes in various clinical conditions as well as in normal development and aging of brain. D, D* and f are three major parameters for IVIM-DWI. D value reflects the pure water diffusion coefficient, and is affected by many factors such as the extracellular space. Decreases in hippocampal volume caused by neurofibrillary tangle was significantly age-dependent [4]. The neurofibrillary tangle in elder subjects might lead to decreased extracellular space as well as decreased D value shown in this study. Pseudo-diffusion coefficient D* represents microcirculation of blood, and provide information about miroperfusion in tissues. D* was found to be correlated with cerebral blood flow. Decreased cerebral blood flow resulted from reduced metabolic level and cardiac function is one of the common changes during normal aging [5]. A decrease of D* was found in the elder groups in this study, which might reveal the cerebral blood flow changes from microcirculation aspect in normal appearance aging brain tissue. Perfusion volume fraction f represented volume of blood flowing into the capillary. In this study, we found f was significantly higher in elder group. The seemingly most straightforward explanation of this result is that more water molecules flow through the microvascular network that contributes to the fast component. This can be interpreted as a network with more dilated vessels. Vasodilation might be present during aging as a physical compensatory mechanism. However, the vasodilation is at the expense of cerebrovascular reserve. Reducing vascular variability was observed across aging populations [6].
Conclusion
Decreased D, D* and increased f were observed in elder subjects. This study gave preliminary insight into microscopic changes in normal brain tissue regarding the microstructure and micro-perfusion information, and could help to better understand the mechanism under the aging brain.
Health of aging brain is a topic of increased interest in recent years given the expected aging of the world's population. Relationship has been found in iron accumulation [1], protein content [2], and perfusion defect [3] with the age. However, hardly any study focuses on microstructure and micro-perfusion changes in normal brain aging. Hence, this study is aimed to describe these microscopic changes in normal brain tissue by intravoxel incoherent motion diffusion-weighted MRI (IVIM-DWI).
Methods
25 subjects gave written informed consent before participating in this study. Inclusion criteria for the study were as follows: aged between 20 and 49 years old; normal results of T1WI, T2WI, fluid-attenuated inversion recovery, diffusion-weighted imaging; no history of head trauma, central nervous system infection, or cerebral structural lesions; and no psychiatric diseases or exposure to psychotropic drugs. All subjects were divided into three different age groups (group 1: 20-29, group 2: 30-39, group 3: 40-49). MR scans were carried out on a 3.0T scanner (Ingenia, Philips Healthcare, Best, the Netherlands) using a 16-channel head coil. Standard T1-weighted anatomical images were acquired with parameters as: TR/TE, 600/28.3 ms; acquisition matrix, 252×250; voxel size, 1.0×1.0 mm2; slice thickness/gap 1.0/-0.5 mm; 327 sagittal slices; flip angle, 90°). IVIM-DWI was performed using 10 b-values (0, 25, 50, 75, 100, 200, 500, 1000, 2000 and 3000) s/mm2, and other parameters included: TR/TE, 4200/105 ms; acquisition matrix, 110×110; voxel size 2.0×2.0 mm; slice thickness, 3.0 mm, number of slices, 28). IVIM images was reconstructed using the Medical Imaging Interaction Toolkit (MITK), with the apparent diffusion coefficient (D) and the perfusion fraction (f) first fitted using images by b values >1000 s/mm2, and then the pseudo-diffusion coefficient (D*) fitted with images by b values ≤ 1000 s/mm2. The atlas-based D, D*, f analyses were performed using the PMOD Software (Version 3.902). First, the D, D*, f parametric maps were registered to the T1WI image, and then the T1WI was registered to the standard brain. Then, 67 brain regions were separated by using the Anatomical Automatic Labeling (AAL) atlas provided by Montreal Neurological Institute (MNI). Finally, D, D*, f values of the 67 regions and whole brain were automatically calculated. A one-way analysis of variance (ANOVA) was applied to assess the statistical differences among the mean D, D* or f values for three different age groups. P<0.05 was considered statistically significant.
Results
For whole brain analysis, D and D* value were significantly higher in group 1 compared with group 2 and 3 (P≤0.001). Compared with group 2 and 3, f value was significantly lower in group 1 (P<0.001, table 1). No significant differences were observed in D, D*, f value between group 2 and 3 (Figure 1). For regional analysis, D* value were significantly higher in group 1 compared with group 2 or 3 among all the 67 brain regions (P≤0.01). D value were significantly higher in group 1 compared with group 2 or 3 among 49 brain regions (P<0.05). f value was significantly higher in group 1 compared with group 2 or 3 among 62 brain regions (P<0.05, Figure 2).
Discussion
IVIM refers to a microscopic translational motion within a given voxel, and can be detected by using the diffusion weighted MR methods. IVIM-DWI provides important information about extracellular processes in various clinical conditions as well as in normal development and aging of brain. D, D* and f are three major parameters for IVIM-DWI. D value reflects the pure water diffusion coefficient, and is affected by many factors such as the extracellular space. Decreases in hippocampal volume caused by neurofibrillary tangle was significantly age-dependent [4]. The neurofibrillary tangle in elder subjects might lead to decreased extracellular space as well as decreased D value shown in this study. Pseudo-diffusion coefficient D* represents microcirculation of blood, and provide information about miroperfusion in tissues. D* was found to be correlated with cerebral blood flow. Decreased cerebral blood flow resulted from reduced metabolic level and cardiac function is one of the common changes during normal aging [5]. A decrease of D* was found in the elder groups in this study, which might reveal the cerebral blood flow changes from microcirculation aspect in normal appearance aging brain tissue. Perfusion volume fraction f represented volume of blood flowing into the capillary. In this study, we found f was significantly higher in elder group. The seemingly most straightforward explanation of this result is that more water molecules flow through the microvascular network that contributes to the fast component. This can be interpreted as a network with more dilated vessels. Vasodilation might be present during aging as a physical compensatory mechanism. However, the vasodilation is at the expense of cerebrovascular reserve. Reducing vascular variability was observed across aging populations [6].
Conclusion
Decreased D, D* and increased f were observed in elder subjects. This study gave preliminary insight into microscopic changes in normal brain tissue regarding the microstructure and micro-perfusion information, and could help to better understand the mechanism under the aging brain.
Acknowledgements
No acknowledgement found.References
1. Li Y, Sethi SK, Zhang C, Miao Y, Yerramsetty KK, Palutla VK, Gharabaghi S, Wang C, He N, Cheng J, Yan F, Haacke EM. Iron Content in Deep Gray Matter as a Function of Age Using Quantitative Susceptibility Mapping: A Multicenter Study. Front Neurosci. 2021;14:607705. 2. Zhang Z, Zhang C, Yao J, Gao F, Gong T, Jiang S, Chen W, Zhou J, Wang G. Amide proton transfer-weighted magnetic resonance imaging of human brain aging at 3 Tesla. Quant Imaging Med Surg. 2020;10(3):727-742. 3. Tarumi T, Zhang R. Cerebral blood flow in normal aging adults: cardiovascular determinants, clinical implications, and aerobic fitness. J Neurochem. 2018;144(5):595-608. 4. Kaye JA, Swihart T, Howieson D, Dame A, Moore MM, Karnos T, Camicioli R, Ball M, Oken B, Sexton G. Volume loss of the hippocampus and temporal lobe in healthy elderly persons destined to develop dementia. Neurology. 1997;48(5):1297-304. 5. Shaw TG, Mortel KF, Meyer JS, Rogers RL, Hardenberg J, Cutaia MM. Cerebral blood flow changes in benign aging and cerebrovascular disease. Neurology. 1984;34(7):855-62. 6. Handwerker DA, Gazzaley A, Inglis BA, D'Esposito M. Reducing vascular variability of fMRI data across aging populations using a breathholding task. Hum Brain Mapp. 2007;28(9):846-59.Figures
Figure
1. Comparison of D, D*, f values among different age groups. Significant
differences were observed in D, D*, f value between group 1 and 2, also between
group 1 and 3.

Figure 2. Heatmap of the p value
for comparison of D, D* and f values between group 1 and 2 or 3 in 67 brain
regions. Bring blue cell represents P>0.05. D* value were significantly
different between groups among all the 67 brain regions.
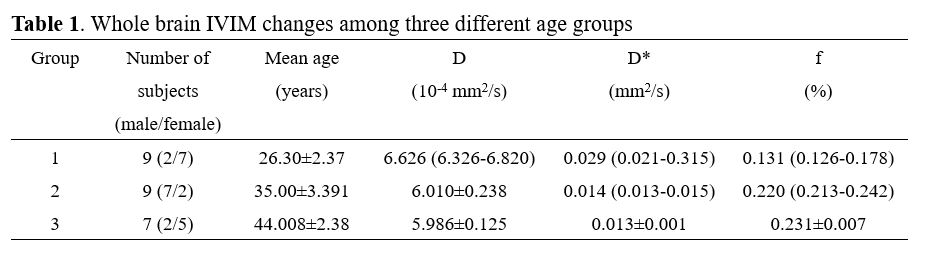
Table 1. Whole brain IVIM changes among
three different age groups
DOI: https://doi.org/10.58530/2022/4720