4719
An improved asymmetric susceptibility tensor imaging model with frequency offset correction1Biomedical Engineering, School of Biomedical Engineering, Shanghai Jiao Tong University, Shanghai, China, 2Department of Electrical Engineering and Computer Sciences, University of California, Berkeley, CA, United States
Synopsis
The existing reconstruction methods for susceptibility tensor imaging assume that frequency shifts are purely from magnetic susceptibility effects, which may result in noise and error propagation in the calculated susceptibility quantities. In this study, we proposed an extended asymmetric susceptibility tensor model that introduced the non-susceptibility-induced frequency shift, i.e. offset term. Simulation, ex vivo, and in vivo data were reconstructed using the proposed model and compared models. Experimental results show that the proposed method leads to more discernable fiber structures and more accurate fiber orientation estimation. This study inspires STI reconstruction from the perspective of better modeling frequency sources.
Introduction
Susceptibility tensor imaging (STI) has demonstrated great potential in characterizing the anisotropic susceptibility of tissues. The conventional STI model exhibits substantial noise and error propagation in the calculated susceptibility quantities and fiber orientations. Recently, Cao et al. proposed an asymmetric STI model (aSTI) that can effectively suppress noise and artifacts in the calculated tensor elements 1. However, mounting evidence indicates that the measured frequency shifts can be induced not only by the anisotropic susceptibility but also by non-susceptibility effects from chemical exchange 2-5, chemical shift 6, tissue microstructure 7, and tissue compartmentalization 8. Based on these findings, we proposed an extended asymmetric STI model with frequency offset correction, termed Fc-aSTI. Fc-aSTI encompasses both susceptibility- and non-susceptibility-related frequency shifts. Experimental results indicate that Fc-aSTI can further improve STI reconstruction results benefitting from the separation of non-susceptibility components from the total frequency shift.Methods
The proposed Fc-aSTI model is expressed as: $$\begin{equation}\delta=\delta_\boldsymbol{\chi}+\delta_{offset} \tag{1} \end{equation}$$where $$$\begin{equation}\delta\end{equation}$$$, $$$\begin{equation}\delta_\boldsymbol{\chi}\end{equation}$$$ and $$$\begin{equation}\delta_{offset}\end{equation}$$$ denote normalized field shift, susceptibility-induced shift, and non-susceptibility-related shift, respectively. In the solving process, we adopted the aSTI model to account for noise effects. Hence, $$$\delta_\boldsymbol{\chi}(\boldsymbol{\rm k})$$$ in the Fourier domain is given by $$\delta_\boldsymbol{\chi}(\boldsymbol{\rm k})=D_{11}\chi_{11}(\boldsymbol{\rm k})+D_{12}\chi_{12}(\boldsymbol{\rm k})+...+D_{32}\chi_{32}(\boldsymbol{\rm k})+D_{33}\chi_{33}(\boldsymbol{\rm k}) \tag{2}$$where $$D_{ij}=\frac{H_iH_j}{3}-\frac{\boldsymbol{\rm k}^\rm T \widehat{\boldsymbol{\rm H}}(\it {k_iH_j}\rm )}{k^2} \tag{3}$$In Eq. (3), $$$\widehat{\boldsymbol{\rm H}}=[H_1,H_2,H_3]^\rm T$$$ represents the unit direction vector of the applied magnetic field. $$$\boldsymbol{\rm k}=[k_1,k_2,k_3]^\rm T$$$ represents a vector of Fourier domain coordinates and $$$k^2=k_1^2+k_2^2+k_3^2$$$.In the Fourier domain, Eq. (1) is linear. Given N measurements of different head orientations, the frequency shift can be expressed as the following linear equation system:$$\begin{bmatrix}\delta^{(1)}(\boldsymbol{\rm k})\\\delta^{(2)}(\boldsymbol{\rm k})\\\vdots\\\delta^{(N)}(\boldsymbol{\rm k}) \end{bmatrix}=\begin{bmatrix}1 & D_{11}^{(1)} & \cdots & D_{33}^{(1)}\\ \vdots & \vdots & \vdots & \vdots \\ 1 & D_{11}^{(N)} & \cdots & D_{33}^{(N)} \end{bmatrix}\begin{bmatrix}\delta_{offset}(\boldsymbol{\rm k})\\\chi_{11}(\boldsymbol{\rm k})\\\vdots\\\chi_{33}(\boldsymbol{\rm k}) \end{bmatrix}\tag{4}$$Eq. (4) is rank deficient. To estimate magnetic susceptibility anisotropy (MSA) and principal eigenvector (PEV), pseudoinverse was calculated to solve the asymmetric susceptibility tensor and then MSA and PEV maps were derived 1. After that, the underlying true susceptibility tensor was imposed cylindrical symmetry constraint to further improve the accuracy of mean magnetic susceptibility (MMS) and offset estimation by solving the following equation using the least-squares method: $$\delta=\boldsymbol{F}^{-1}\{\frac{1}{3}\widehat{\boldsymbol{\rm H}}^{\rm T}\boldsymbol{F}[\chi_{MMS}\boldsymbol{\rm I}+\chi_{MSA}(\boldsymbol{\rm T}-\frac{1}{3}\boldsymbol{\rm I})]\widehat{\boldsymbol{\rm H}}-\widehat{\boldsymbol{\rm k}}^{\rm T}\widehat{\boldsymbol{\rm H}}\frac{\widehat{\boldsymbol{\rm k}}^{\rm T}\boldsymbol{F}[\chi_{MMS}\boldsymbol{\rm I}+\chi_{MSA}(\boldsymbol{\rm T}-\frac{1}{3}\boldsymbol{\rm I})]\widehat{\boldsymbol{\rm H}}}{k^2}\}+\delta_{offset} \tag{5}$$where $$$\boldsymbol{\rm T}=\boldsymbol{\rm V_1}\boldsymbol{\rm V_1}^{\rm T}$$$, and $$$\boldsymbol{\rm V_1}$$$ is the PEV. $$$\boldsymbol{\rm I}$$$ denotes the identity matrix. $$$\boldsymbol{F}$$$ and $$$\boldsymbol{F^{-1}}$$$ represent Fourier transform and inverse Fourier transform matrix, respectively.
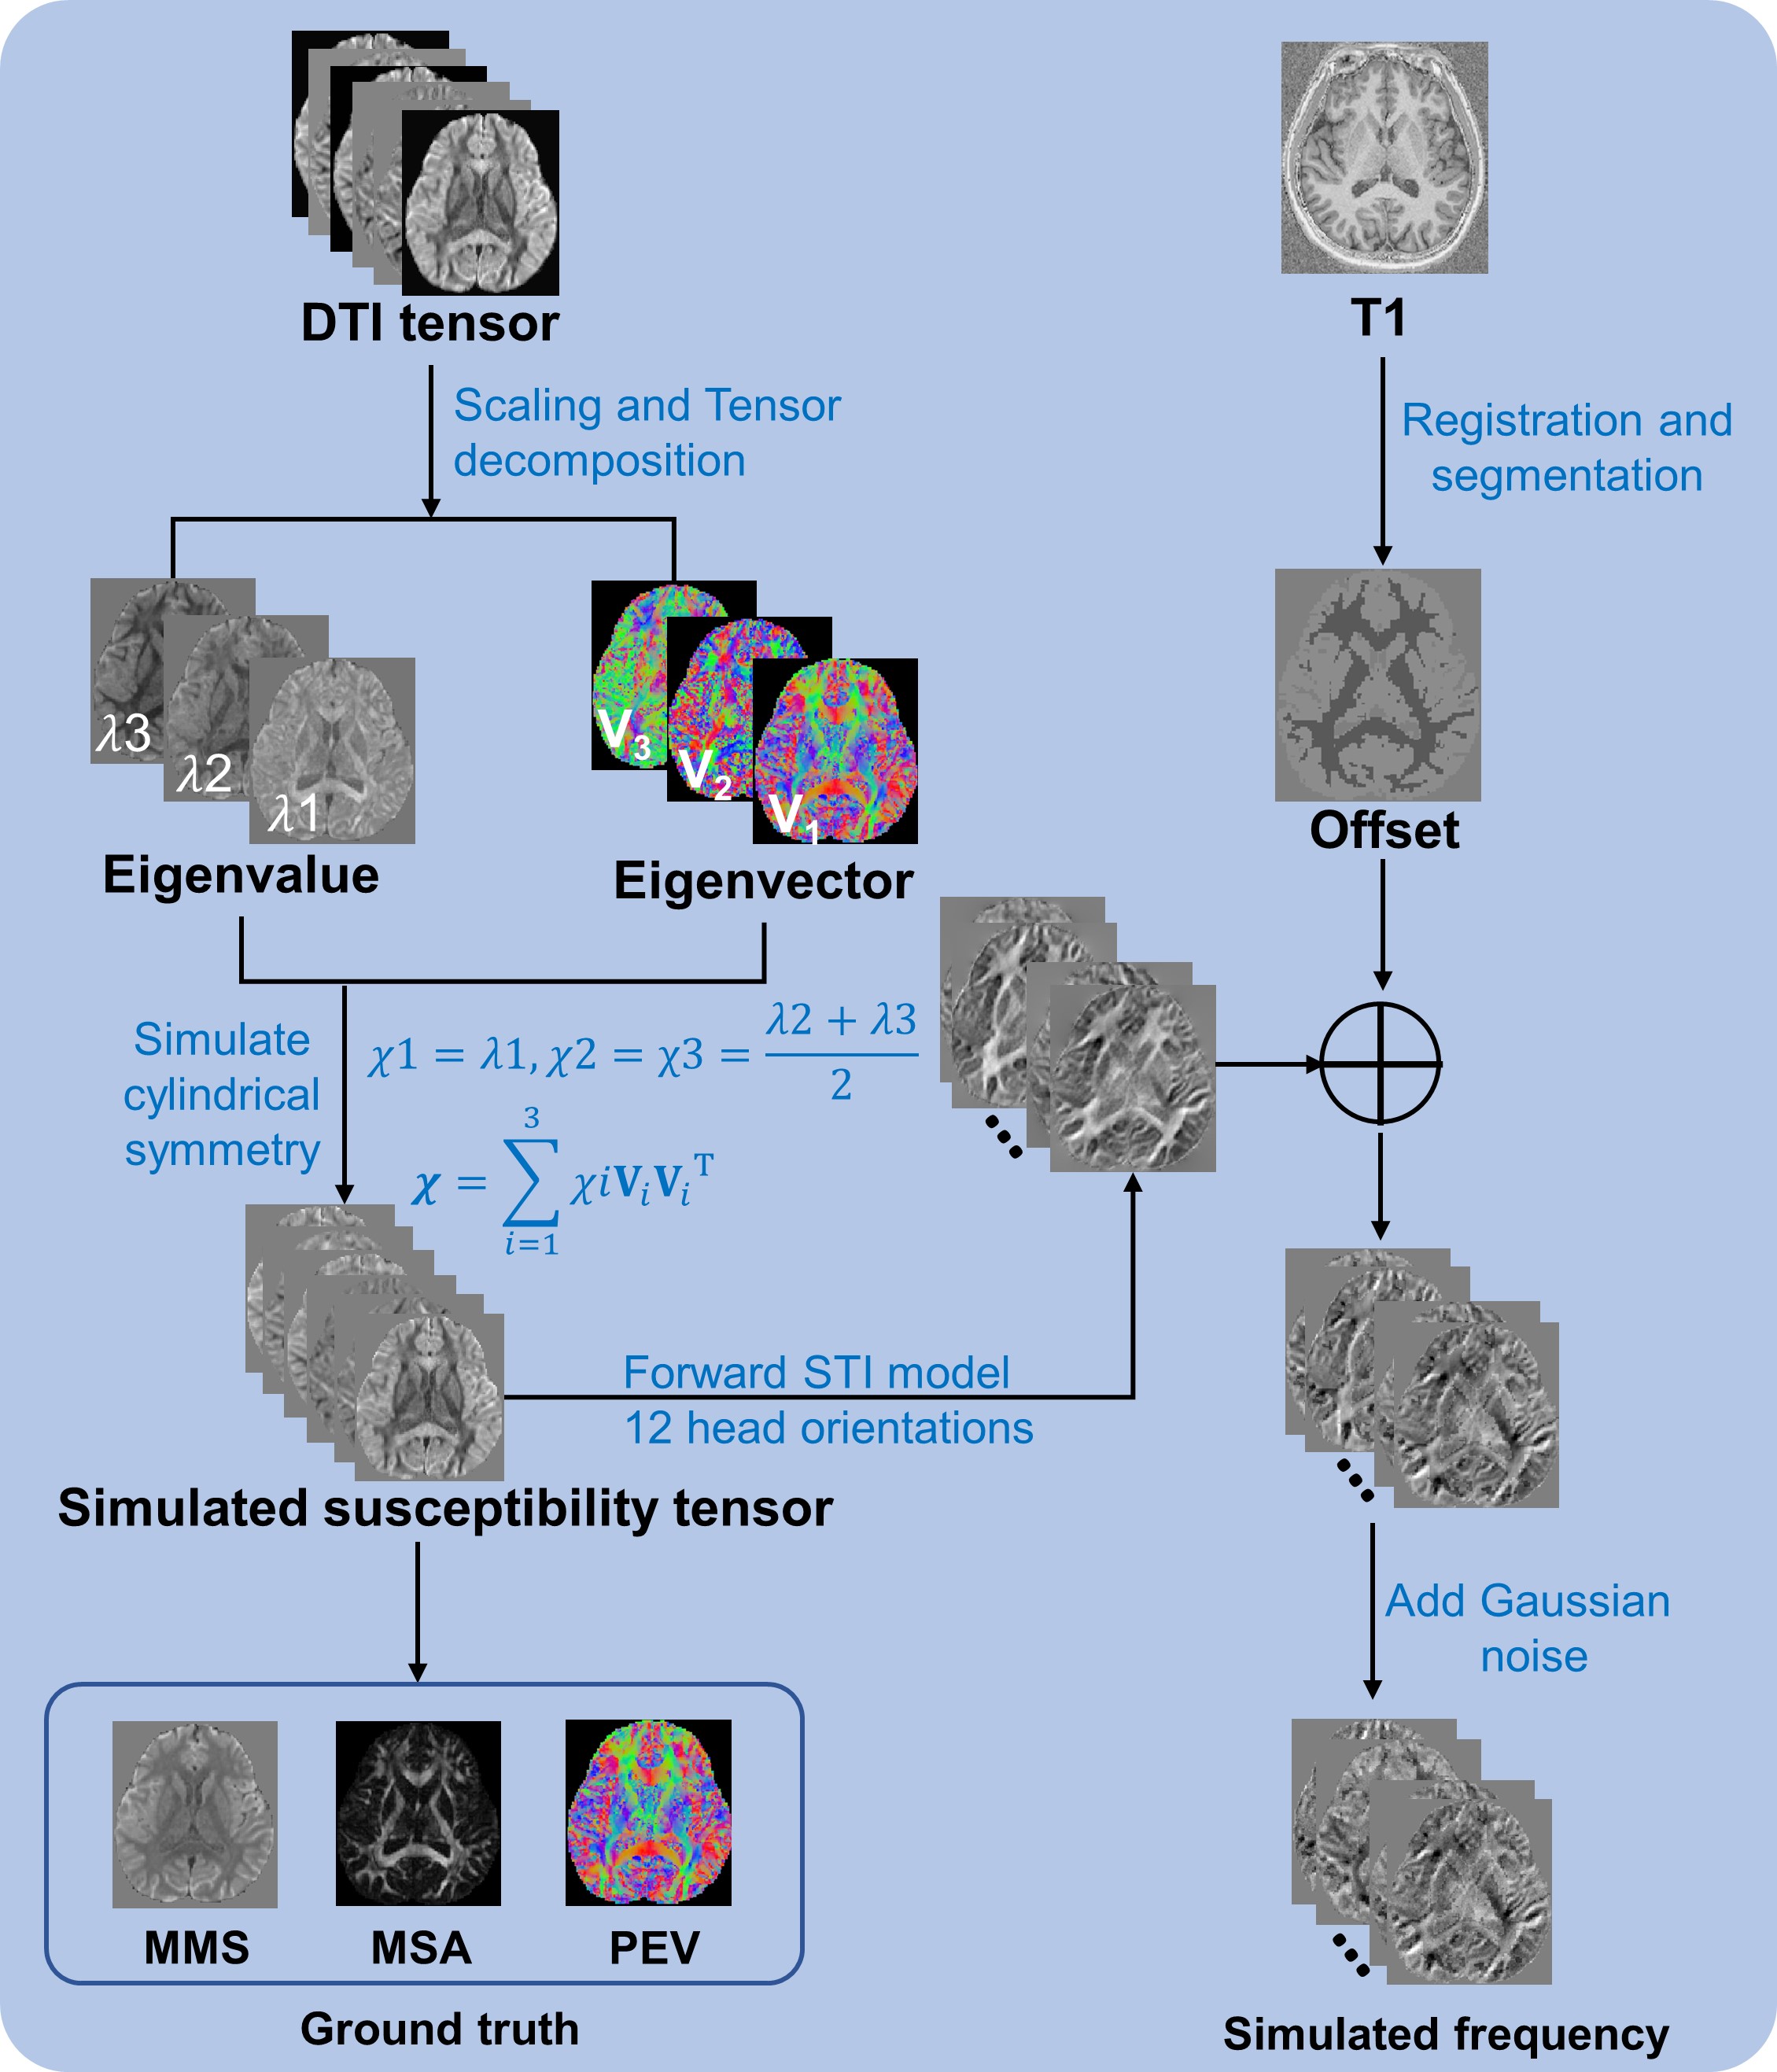
Experiments were carried out on simulation, ex vivo, and in vivo data. The simulation schematic diagram is shown in Fig. 1. For the ex vivo data, mouse brain in the study by Dibb and Liu 9 was used. An in vivo experiment was also conducted, where the subject was scanned with the following parameters: 23 head orientations, matrix size=210×224×160, voxel size=1 mm3 isotropic, flip angle=$$$15^\circ$$$, TR=38 ms, $$$\rm TE_1$$$/spacing/$$$\rm TE_6$$$=7.7/5/32.7 ms, GRAPPA factor=2.
To illustrate the effectiveness of the proposed model, ablation experiments were performed in which Fc-aSTI was compared with conventional STI, conventional STI with the proposed frequency offset correction (Fc-STI), and aSTI.
Results
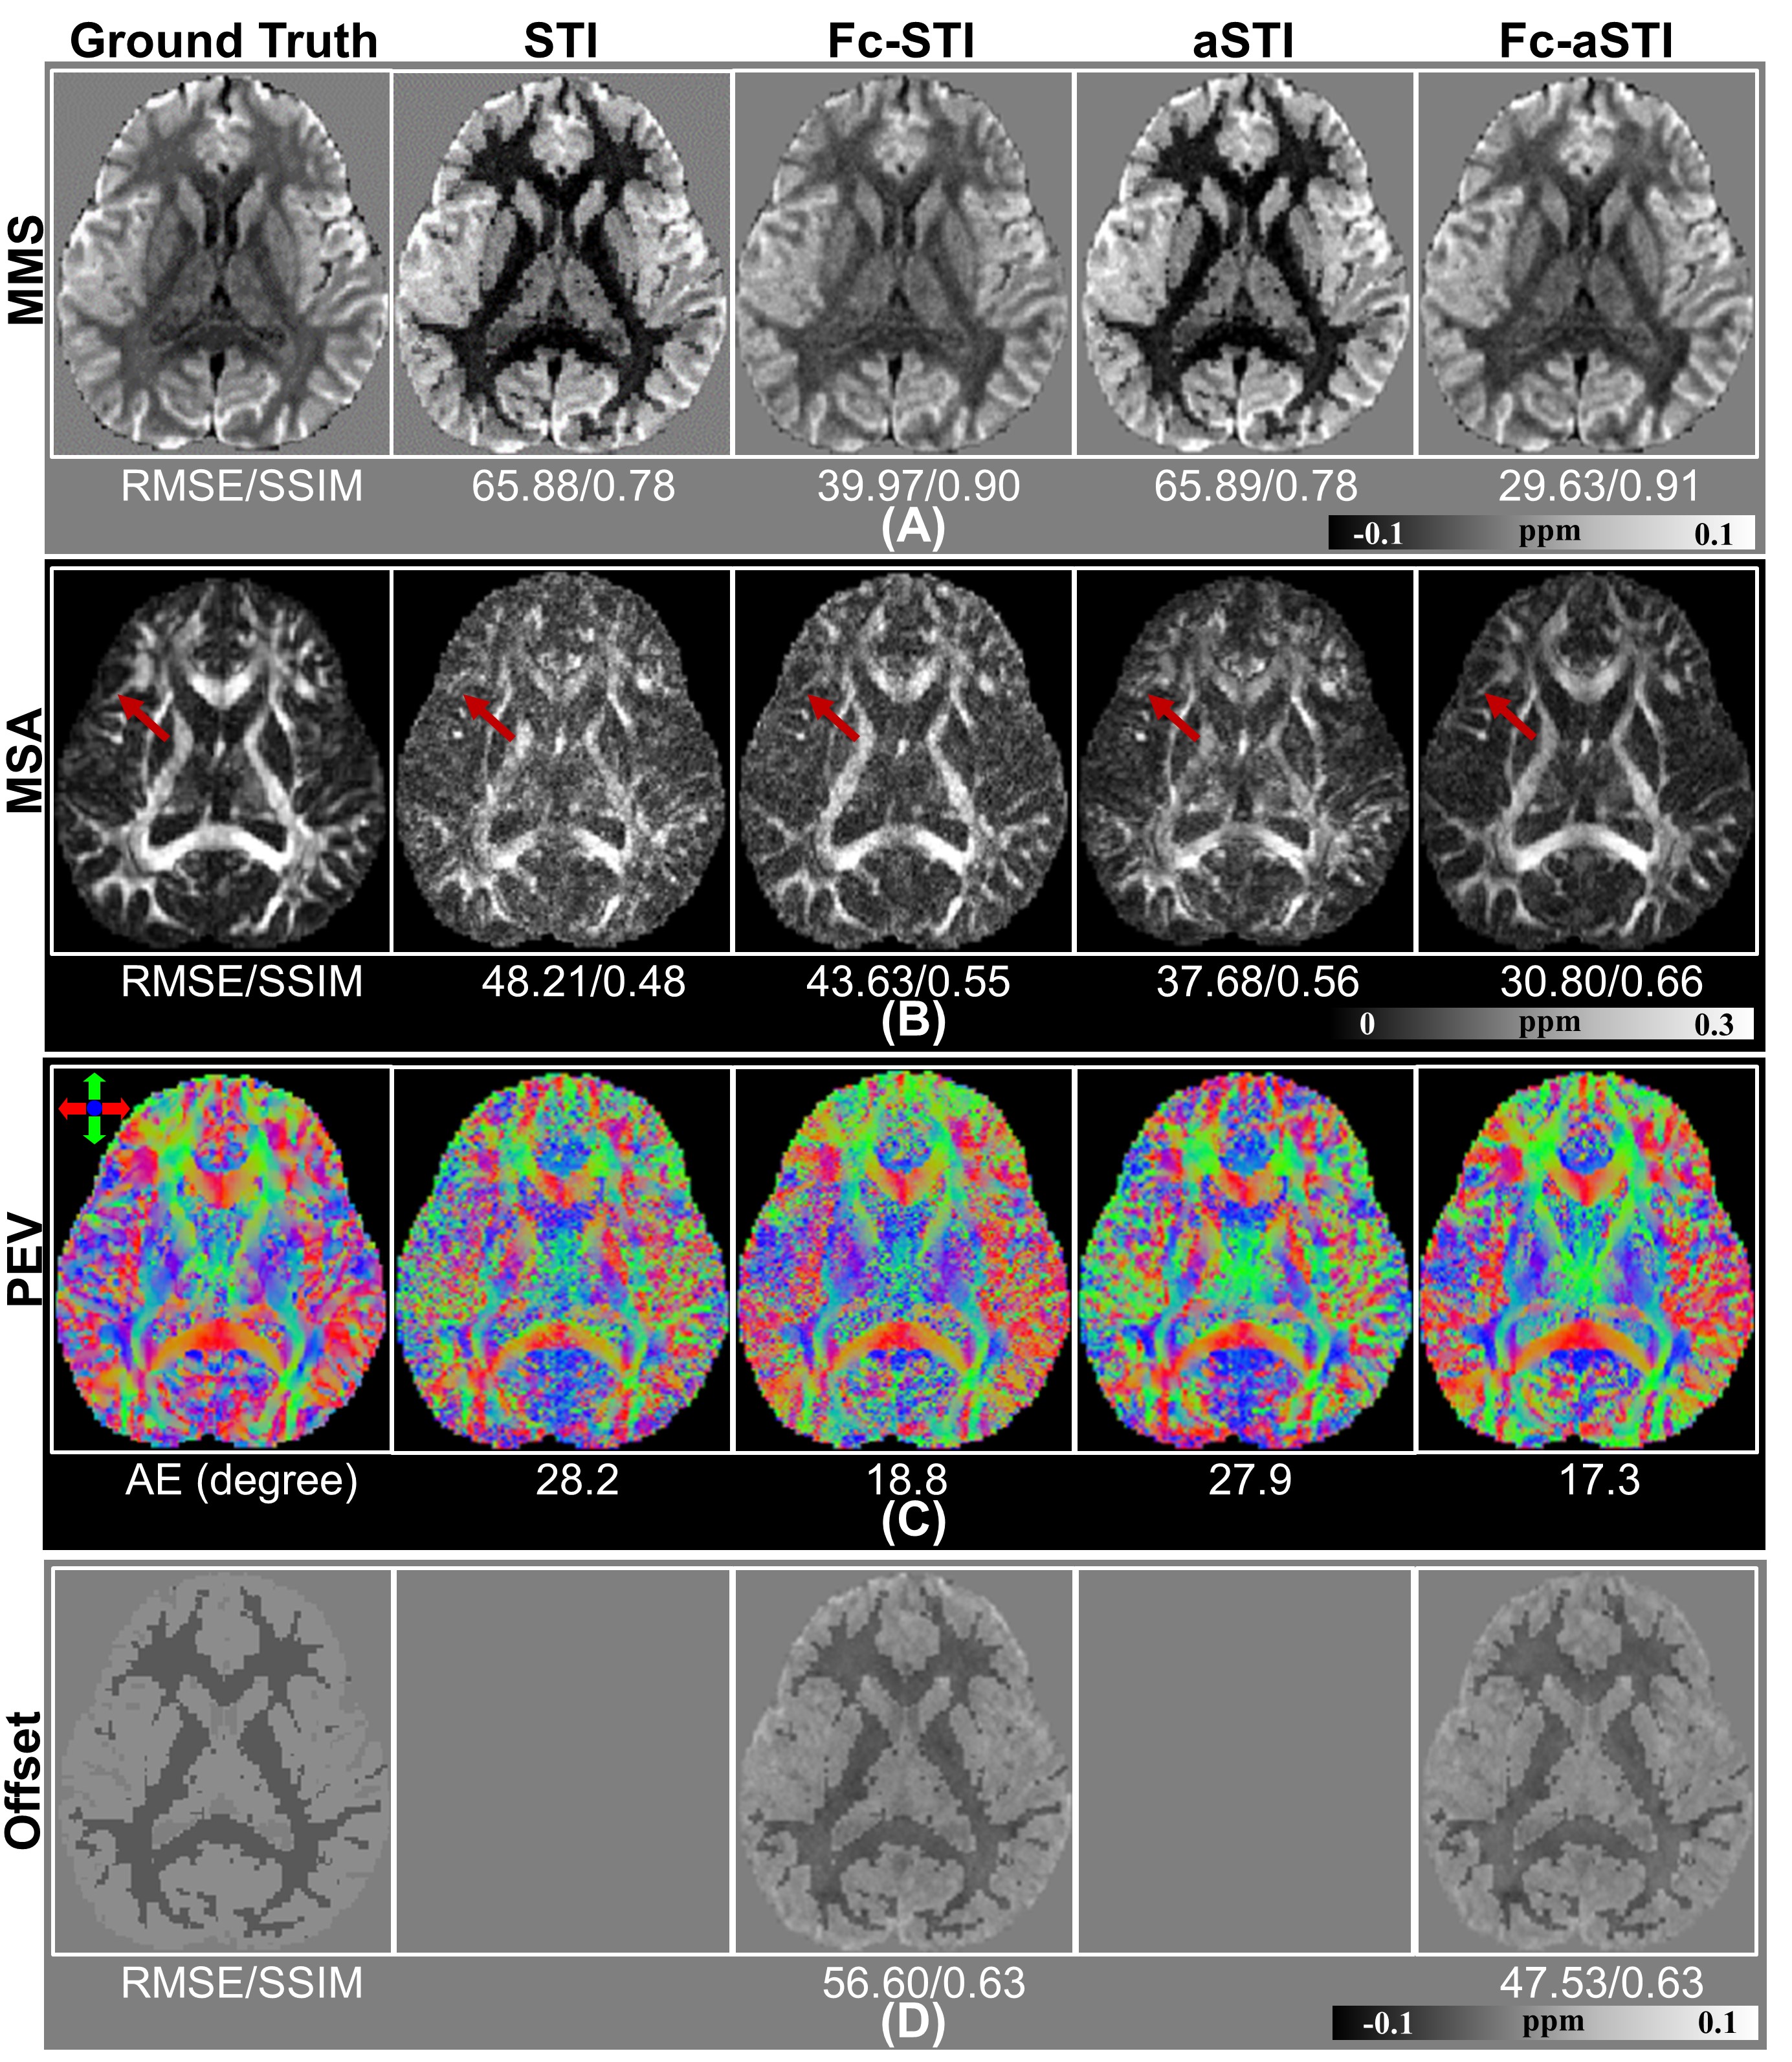
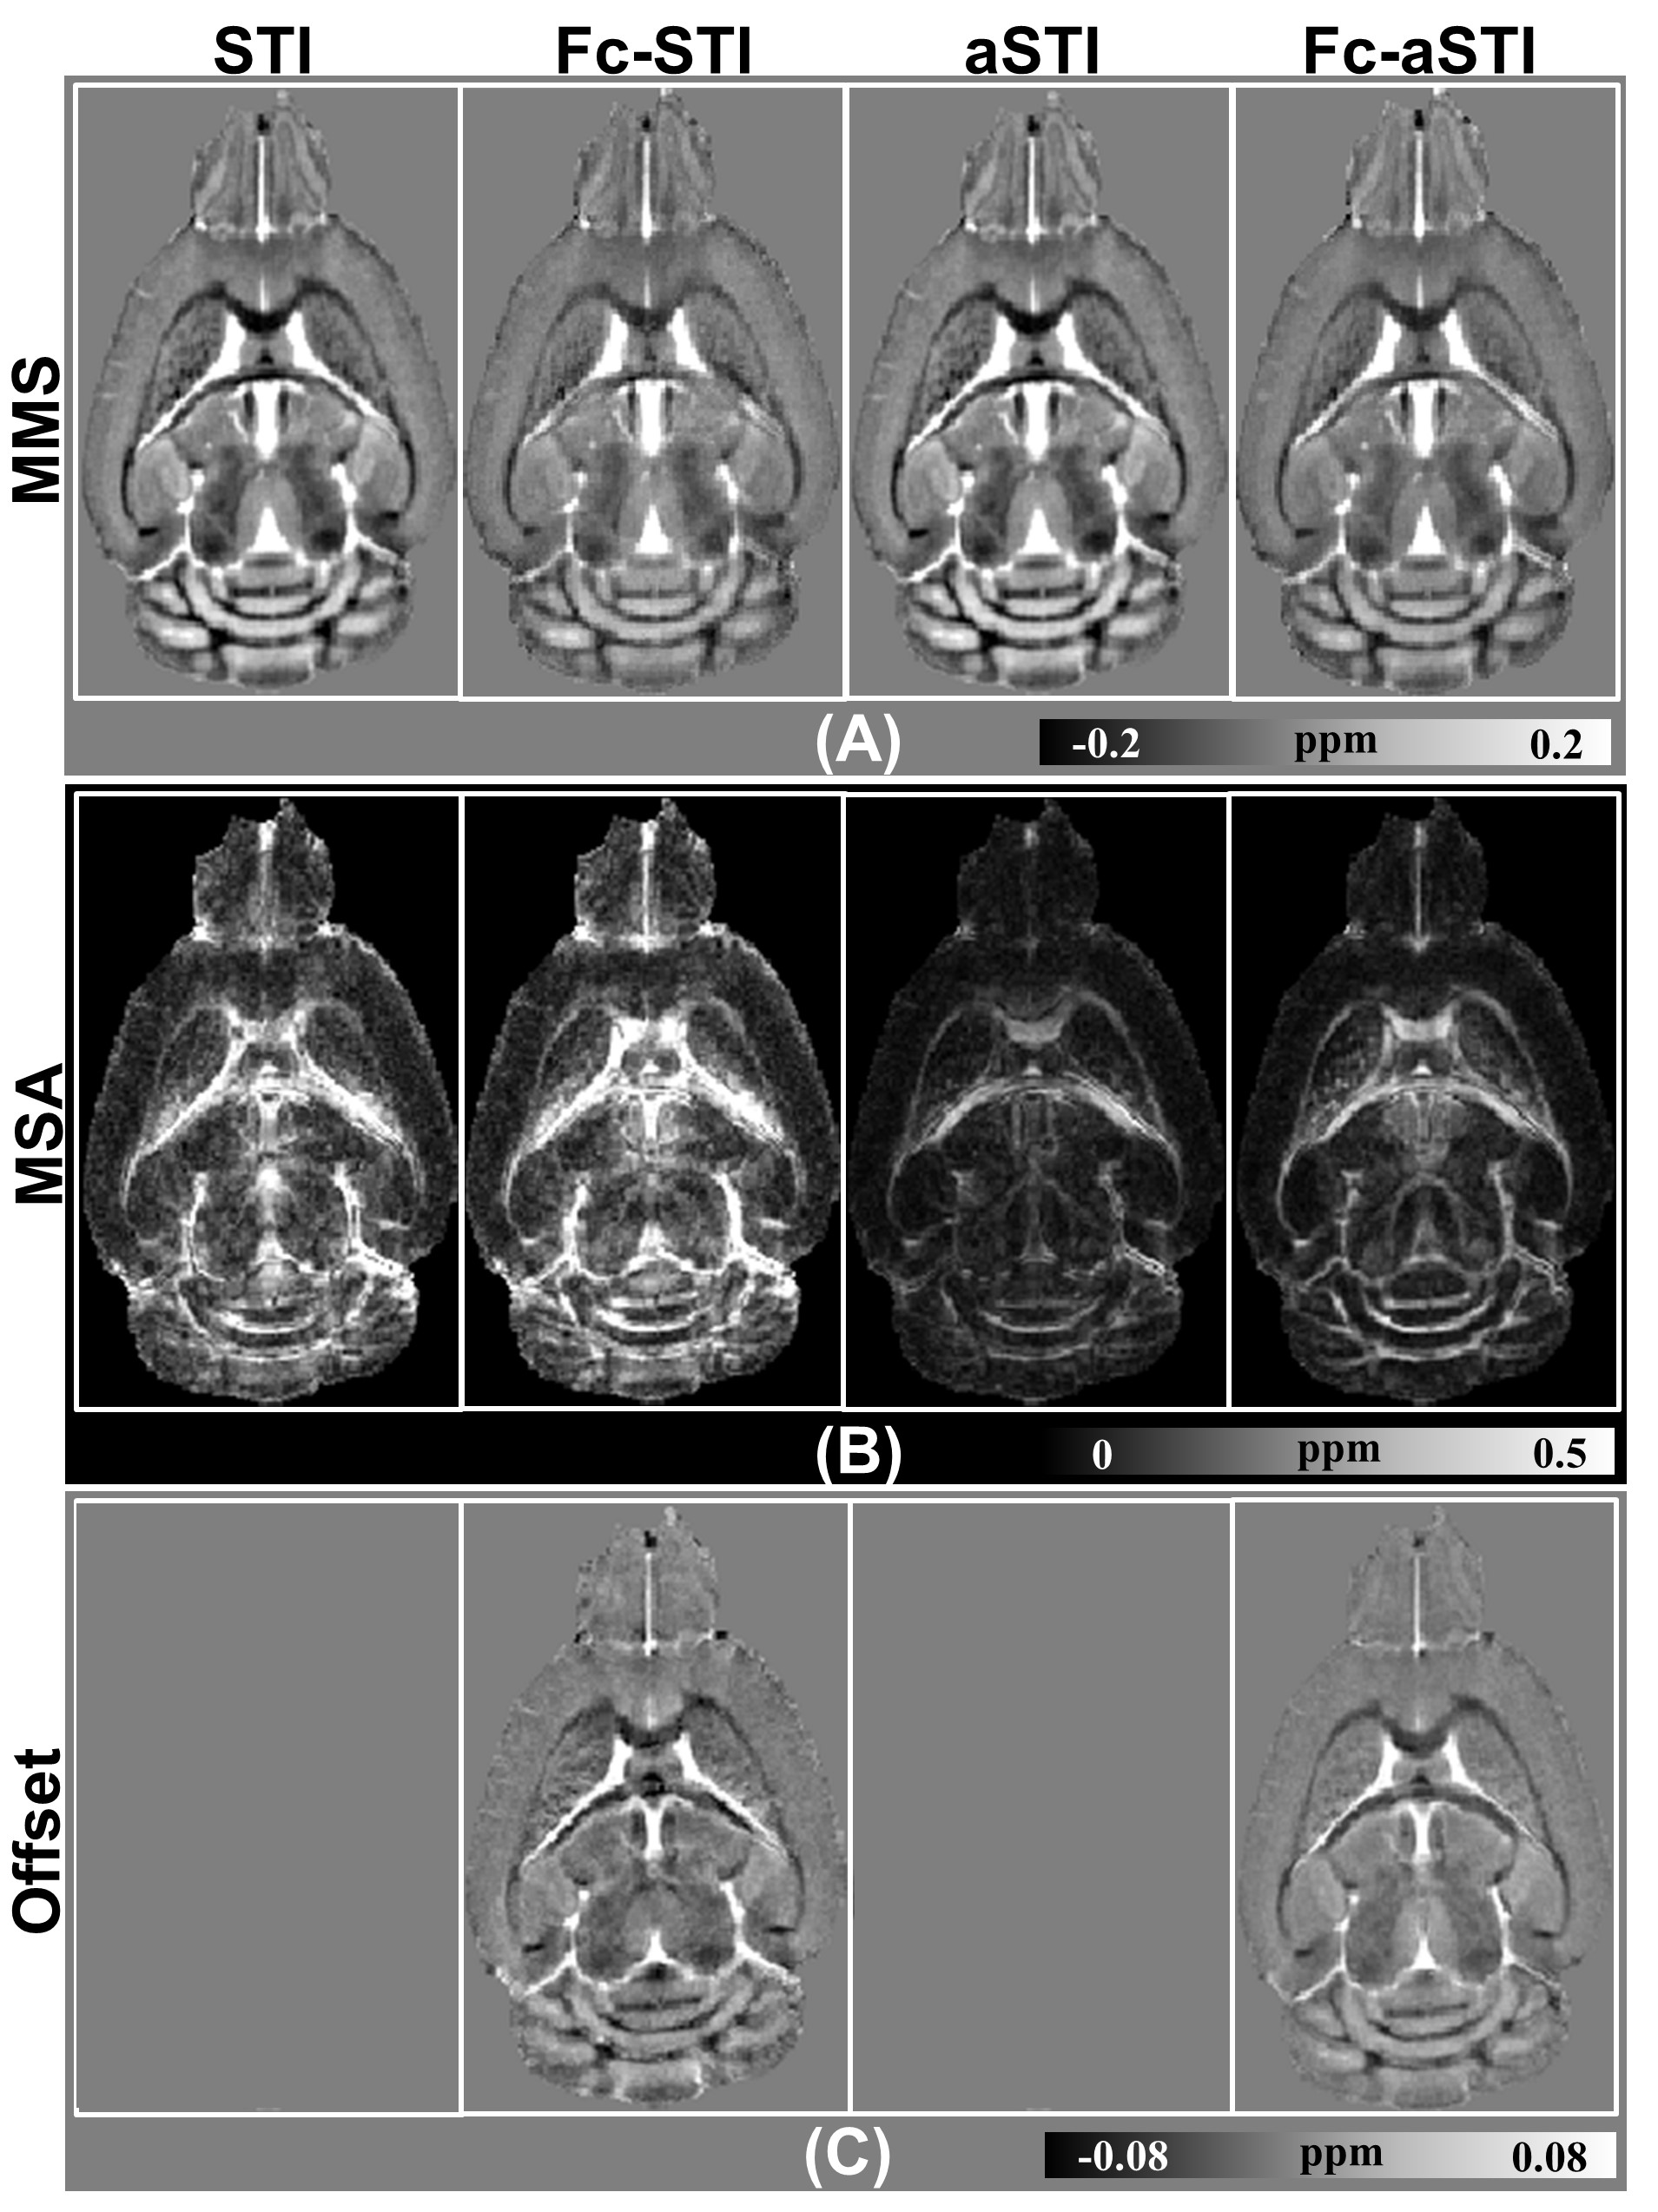
Fig. 2 compares the results of the four models on simulation data with 5% Gaussian noise (The standard deviation is 5% of the maximum value in simulated frequency data). MMS maps reconstructed by Fc-STI and Fc-aSTI show closer contrast to ground truth (Fig. 2A). For MSA maps, Fc-aSTI can effectively suppress susceptibility anisotropy in the isotropic regions, making small white matter structures more distinguishable (red arrows in Fig. 2B). The PEV maps are shown in Fig. 2C. Visually, fiber orientations estimated by Fc-aSTI are more similar to the ground truth. Quantitative metrics, root mean squared error (RMSE), structural similarity index (SSIM), and angular error (AE) 10 are summarized at the bottom of each image. Fc-aSTI achieves the best results.Fig. 3 shows the results on mouse brain data. The MSA map in Fc-aSTI exhibits discernable anisotropy in white matter fiber bundles as well as the medium-size neurons within the putamen (Fig.3B). The frequency offset maps estimated by Fc-STI and Fc-aSTI have similar contrast as presented in Fig. 3C.
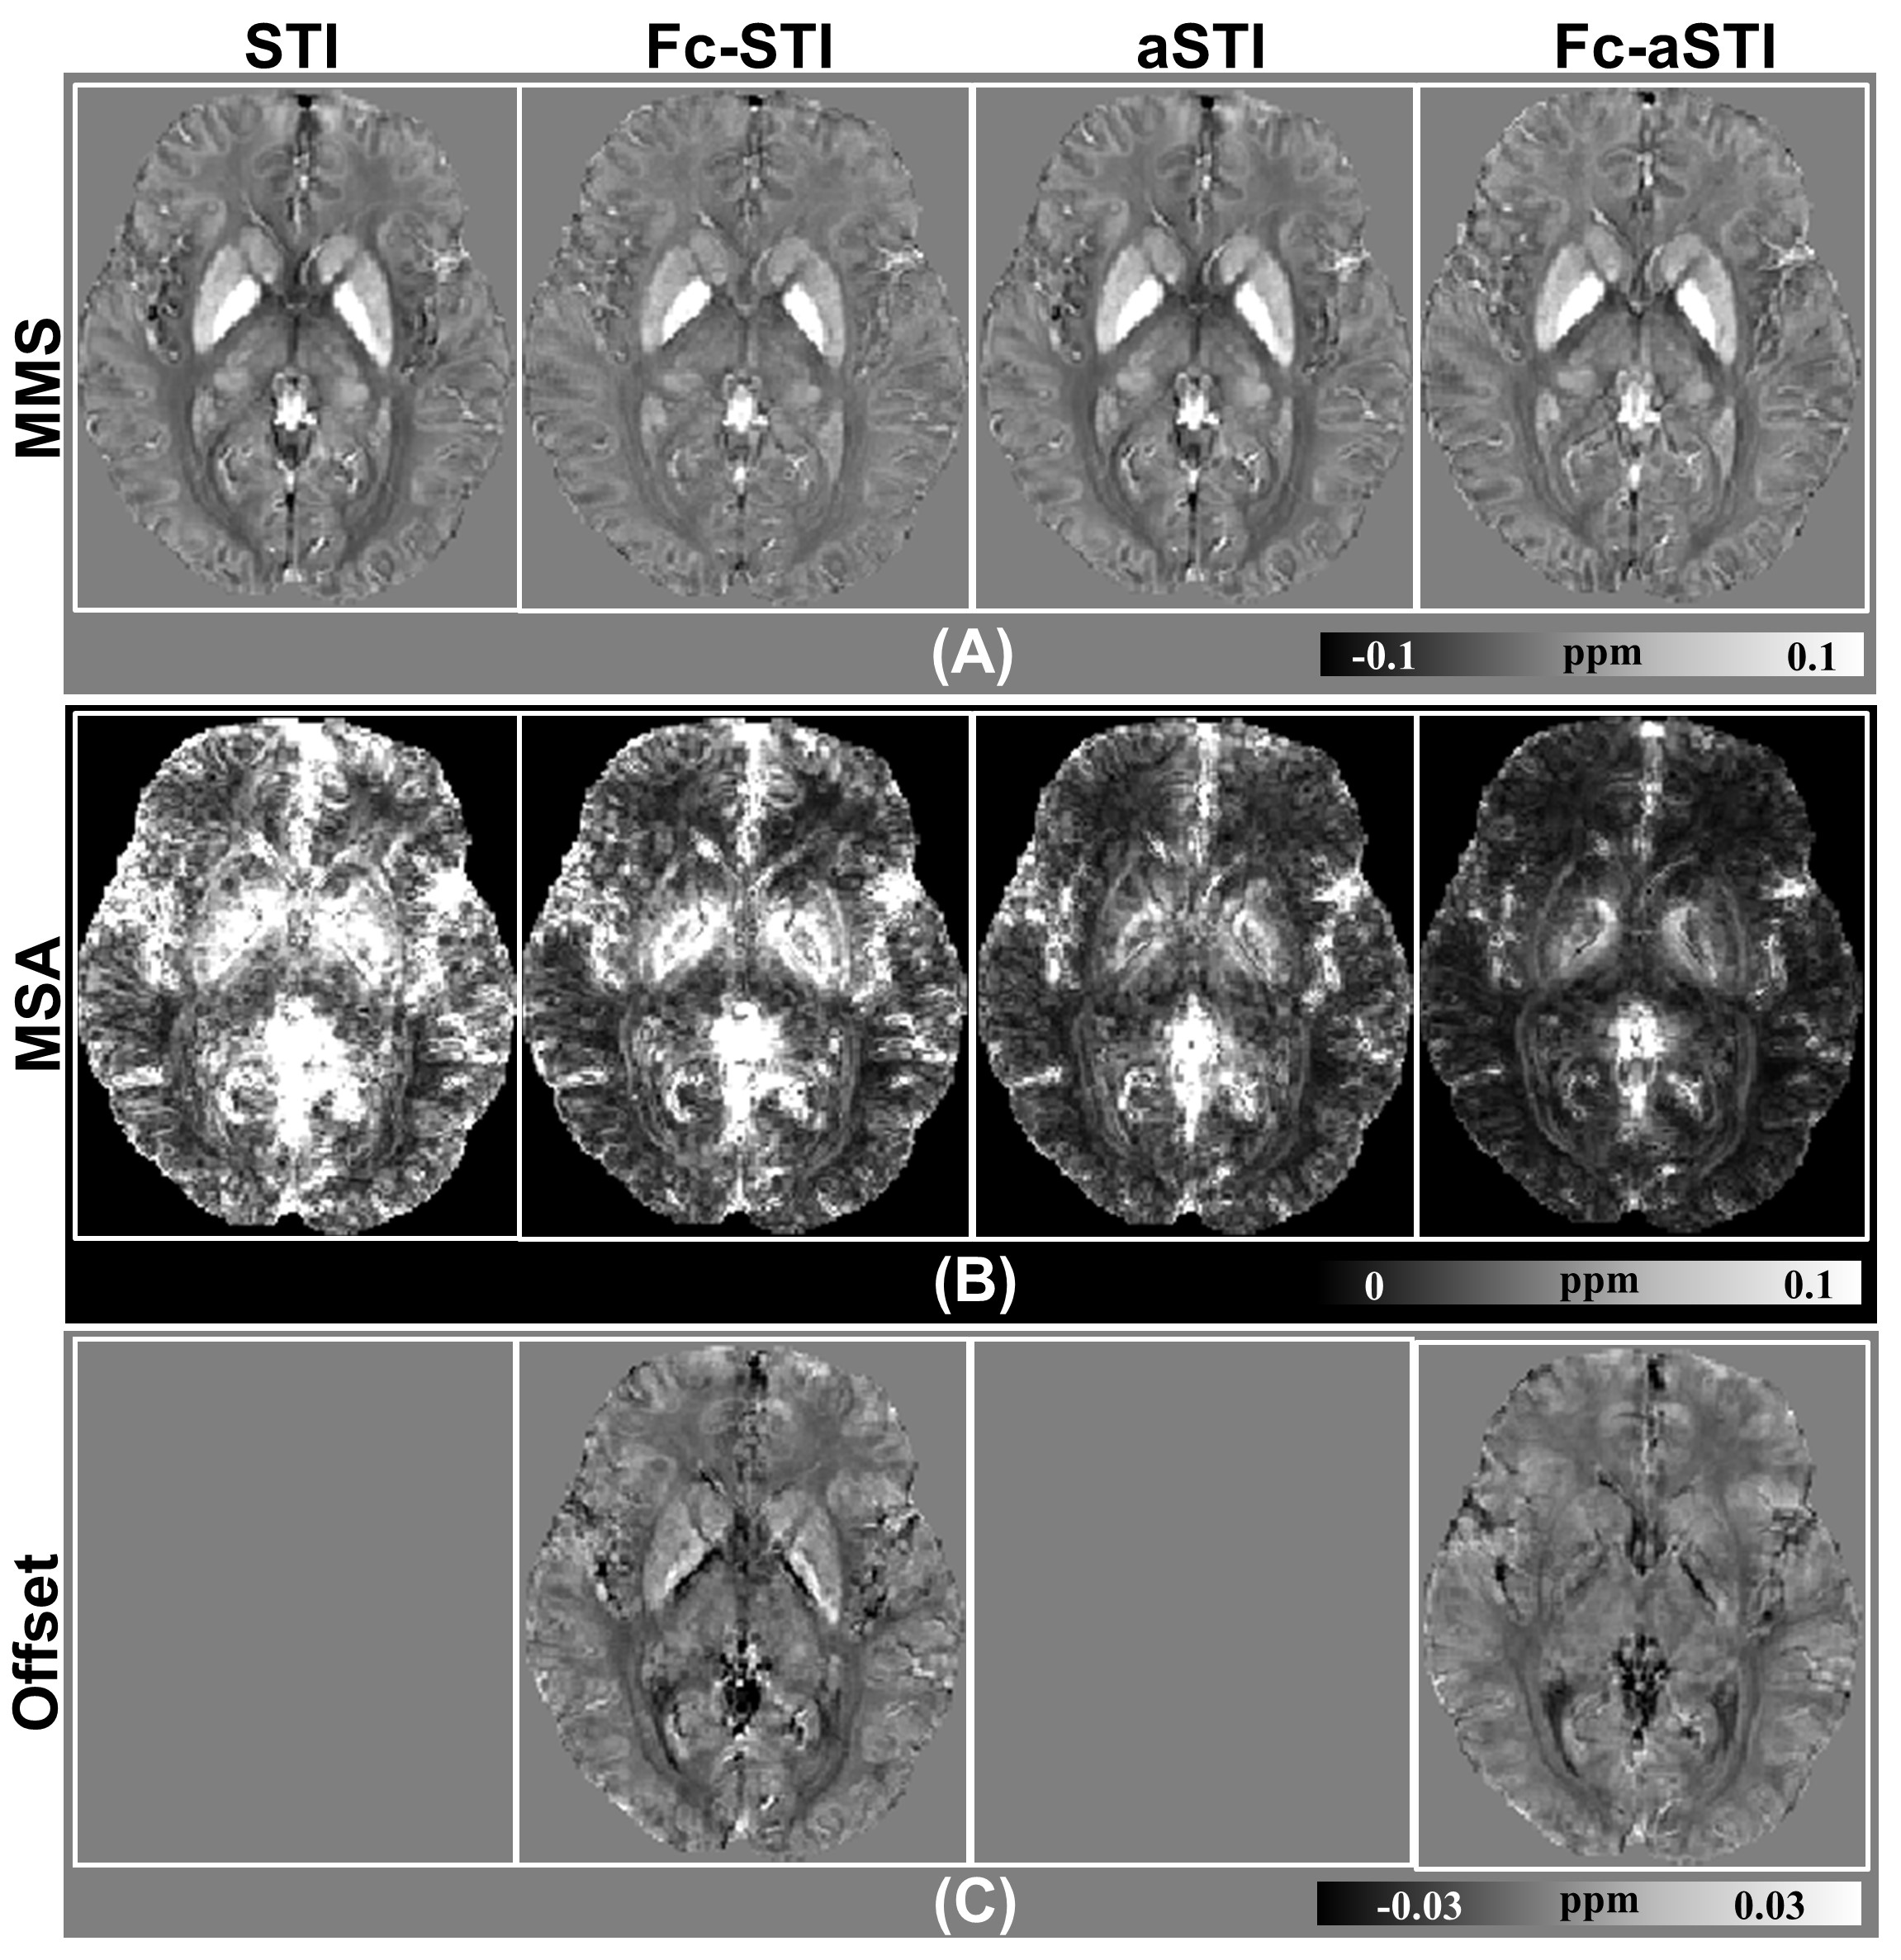
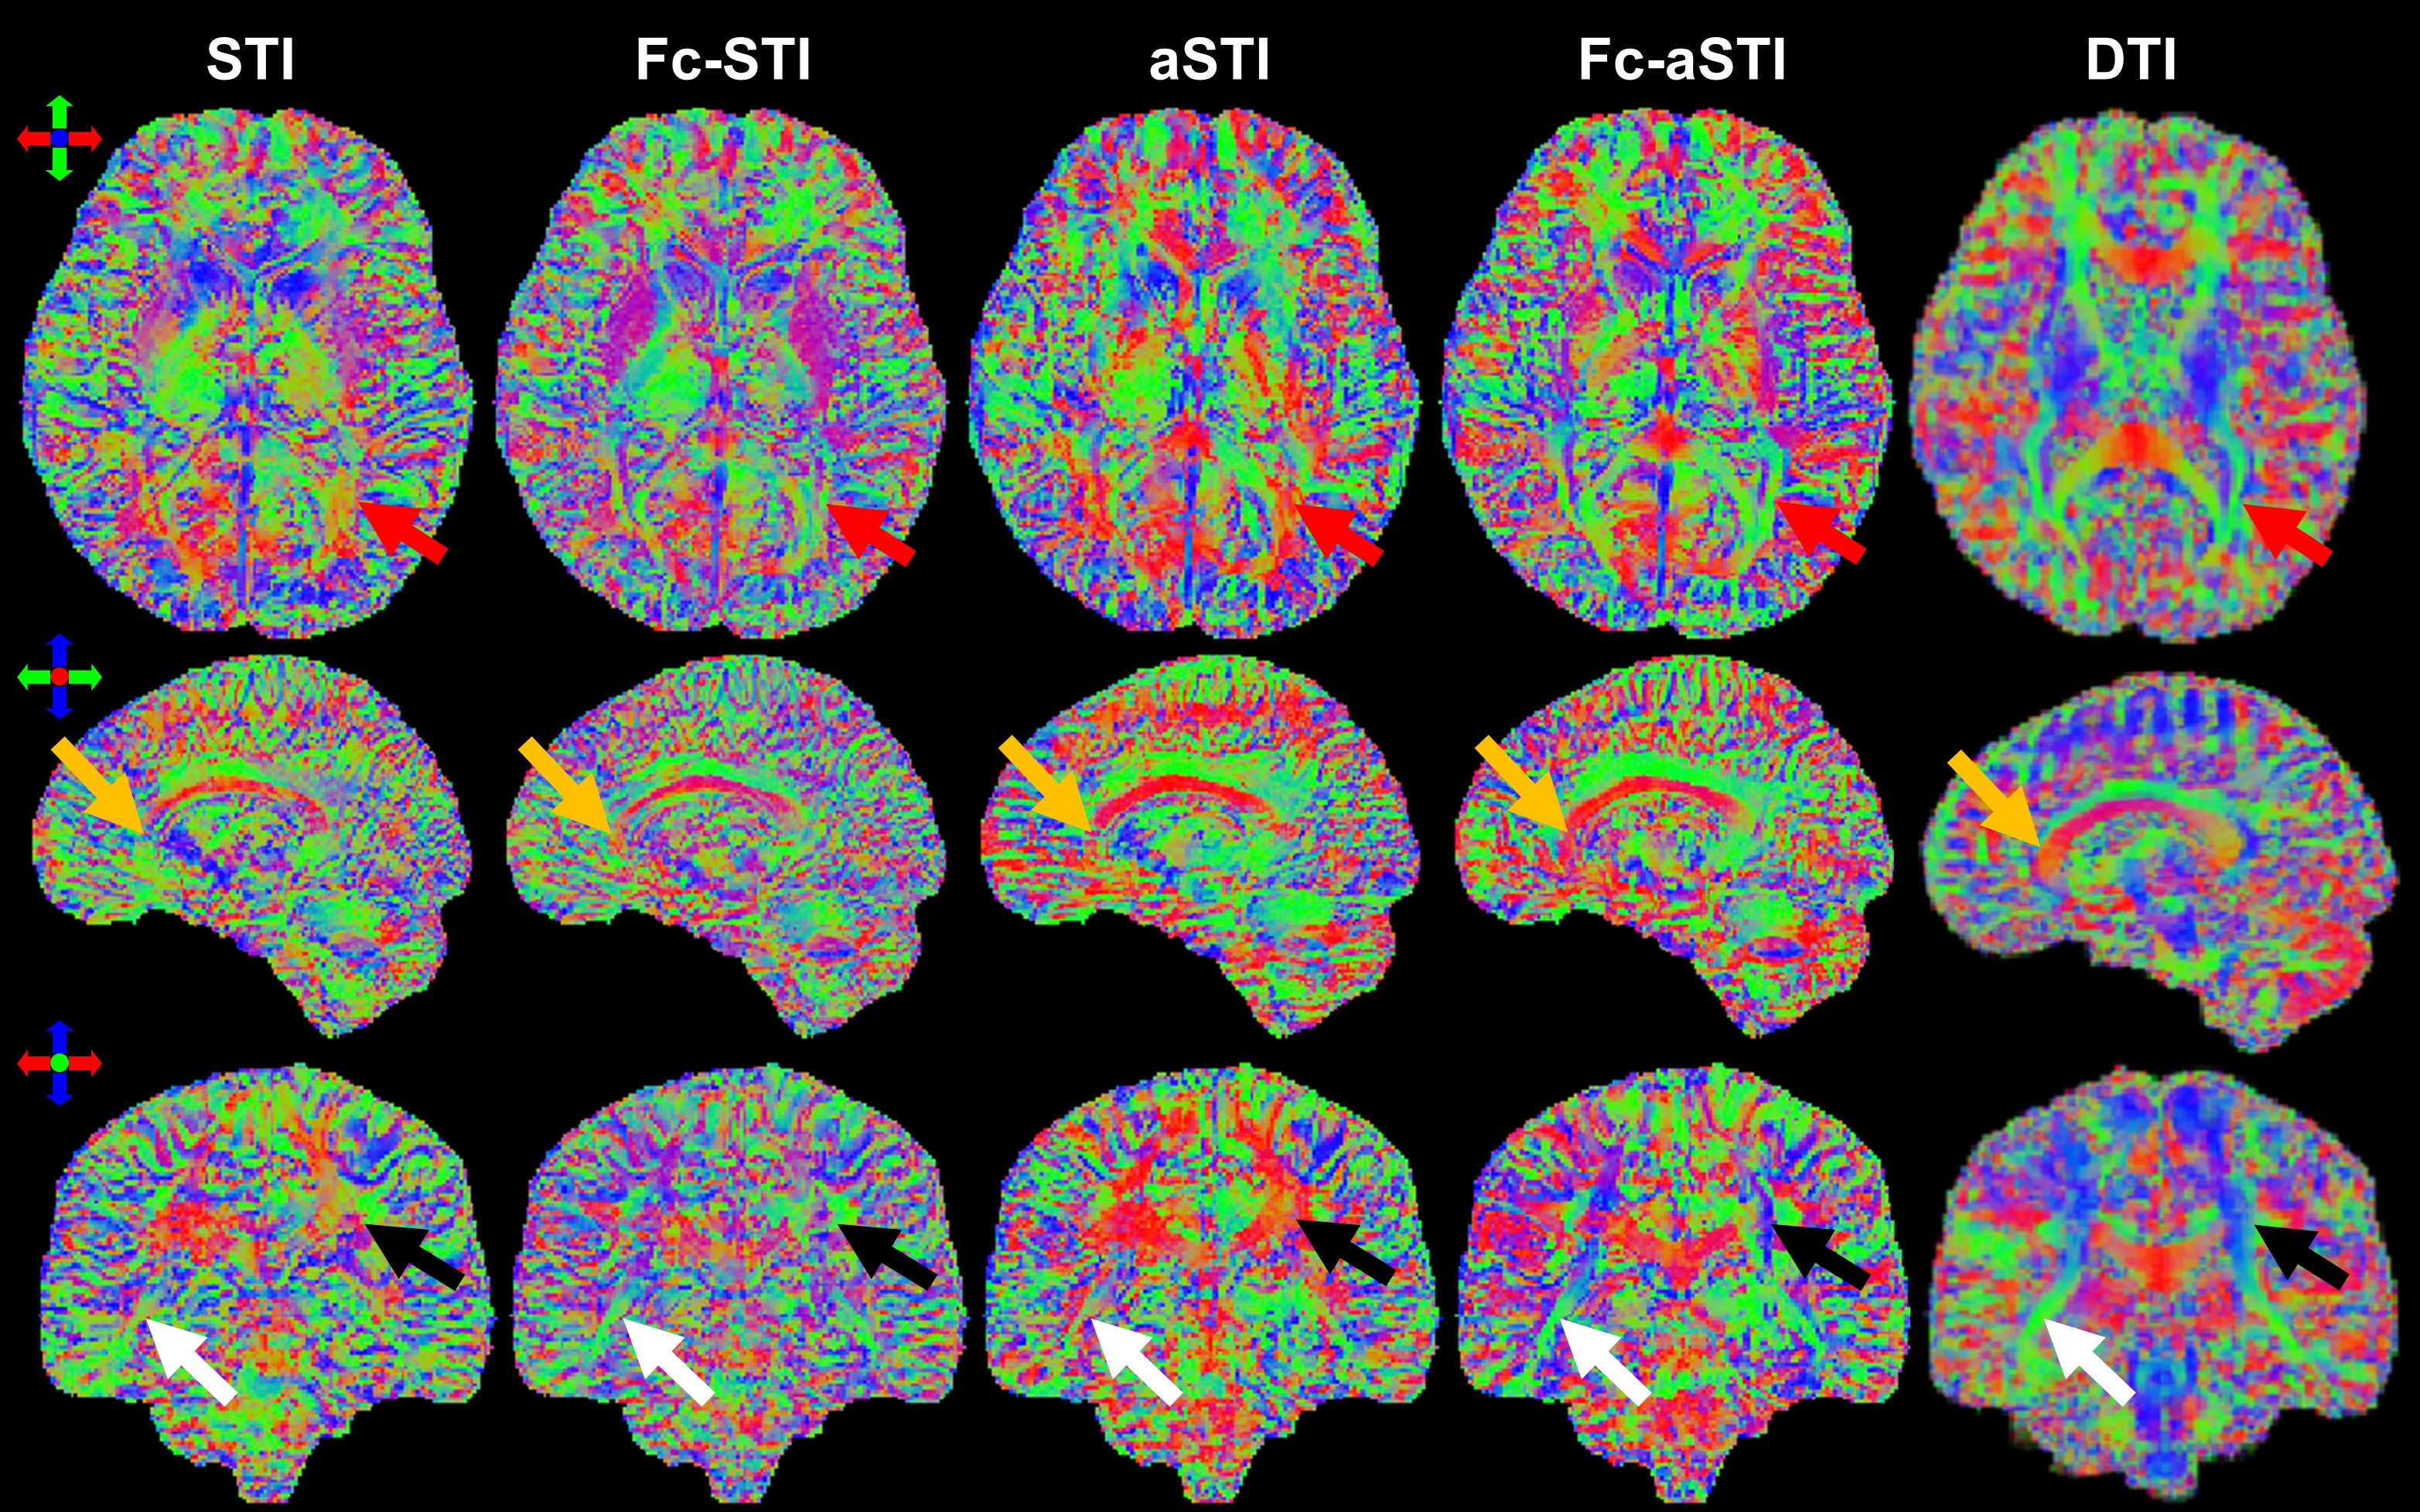
Fig. 4 shows the results on human brain data. The white matter fibers in the MSA maps from Fc-aSTI are more organized and noticeable (Fig. 4B). The estimated offset results by Fc-STI and Fc-aSTI show similar contrast (Fig. 4C). Fig. 5 presents PEV maps. The major white matter fibers are more organized and the high similarity of their orientations was found between the results from DTI and Fc-aSTI, as indicated by the arrows.
Discussion
Comparison results of different models show that the proposed model can effectively suppress noise effects, resulting in a decreased anisotropy in the gray matter and thus a more reliable calculation of MSA maps. Additionally, the non-susceptibility-related components, i.e. offset, are removed, enabling more discernable fiber structures and more accurate fiber orientation estimation. These improvements demonstrate that Fc-aSTI can more accurately characterize the actual physical scenario of MRI frequency sources by using aSTI model and removing the frequency offset.Conclusion
Our study inspires STI reconstruction from the perspective of better modeling frequency sources. Furthermore, Fc-aSTI holds the potential to better understand magnetic susceptibility anisotropy of white matter myelination and demyelination in the brain.Acknowledgements
This study is supported by the National Natural Science Foundation of China (61901256, 91949120) and the Science and Technology Commission of Shanghai Municipality under Grant 20DZ2220400.References
1. Cao S, Wei H, Chen J, et al. Asymmetric susceptibility tensor imaging. Magn Reson Med. 2021;86(4):2266-2275.
2. Leutritz T, Hilfert L, Smalla KH, et al. Accurate quantification of water-macromolecule exchange induced frequency shift: effects of reference substance. Magn Reson Med. Jan 2013;69(1):263-268.
3. Luo J, He X, d'Avignon DA, et al. Protein-induced water 1H MR frequency shifts: contributions from magnetic susceptibility and exchange effects. J Magn Reson. Jan 2010;202(1):102-108.
4. Shmueli K, Dodd SJ, Li TQ, et al. The contribution of chemical exchange to MRI frequency shifts in brain tissue. Magn Reson Med. Jan 2011;65(1):35-43.
5. Shmueli K, Dodd SJ, van Gelderen P, et al. Investigating lipids as a source of chemical exchange-induced MRI frequency shifts. NMR in Biomedicine. 2017;30(4):e3525.
6. Kuchel PW, Chapman BE, Bubb WA, et al. Magnetic susceptibility: Solutions, emulsions, and cells. Concepts in Magnetic Resonance Part A. 2003;18A(1):56-71.
7. Wharton S, Bowtell R. Effects of white matter microstructure on phase and susceptibility maps. Magn Reson Med. 2015;73(3):1258-1269.
8. Wharton S, Bowtell R. Fiber orientation-dependent white matter contrast in gradient echo MRI. Proc Natl Acad Sci U S A. 2012;109(45):18559-18564.
9. Dibb R, Liu C. Joint eigenvector estimation from mutually anisotropic tensors improves susceptibility tensor imaging of the brain, kidney, and heart. Magn Reson Med. 2017;77(6):2331-2346.
10. Li X, van Zijl PC. Mean magnetic susceptibility regularized susceptibility tensor imaging (MMSR-STI) for estimating orientations of white matter fibers in human brain. Magn Reson Med. Sep 2014;72(3):610-619.
Figures