4718
A self-supervised deep learning approach for quantitative susceptibility mapping without ground truth labels1School of Biomedical Engineering, Shanghai Jiao Tong University, Shanghai, China
Synopsis
Supervised deep learning methods for QSM reconstruction from tissue phase mainly rely on the ground truth susceptibility maps for training, which are not available for QSM. To address this issue, we propose a self-supervised deep learning method, TKD2TKD, for susceptibility reconstruction using artifact-contaminated TKD-TKD pairs acquired at different head orientations of one subject. The primary motivation of TKD2TKD is that the average of the network gradients by feeding TKD pairs will converge to the true gradient of that trained with high-quality averaged TKD images. The preliminary results suggested that TKD2TKD performed well in QSM reconstruction with improved susceptibility quantification accuracy.
Introduction
Quantitative susceptibility mapping (QSM) has shown superiority in quantifying the intrinsic magnetic susceptibility of tissue and demonstrated its potential for disease diagnosis. Solving the ill-posed dipole inversion problem from tissue phase to susceptibility source is challenging for QSM reconstruction. While deep learning methods have yielded promising performance in tackling this inverse process, however, these approaches rely on a large amount of ground truth QSM images as references for training. Furthermore, one major challenge for deep learning QSM is that what is the ground truth susceptibility for single-orientation QSM1. COSMOS (calculation of susceptibility through multiple orientation sampling)2 is usually regarded as a gold standard but ignores the anisotropic nature of susceptibility in brain white matter. STI (susceptibility tensor imaging) χ333 could be another candidate susceptibility reference, which is difficult to collect on the human brain in vivo. For single-orientation data, which is more realistic in clinical routine, truncated k-space division (TKD) algorithm4 is often used to truncate the singularity of dipole kernel in k-space to avoid division by zero but suffers from severe streaking artifacts. In this study, we developed a novel deep learning-based QSM reconstruction approach, termed TKD2TKD, for learning the underlying susceptibility maps directly from the streaking artifact-contained TKD images.Methods
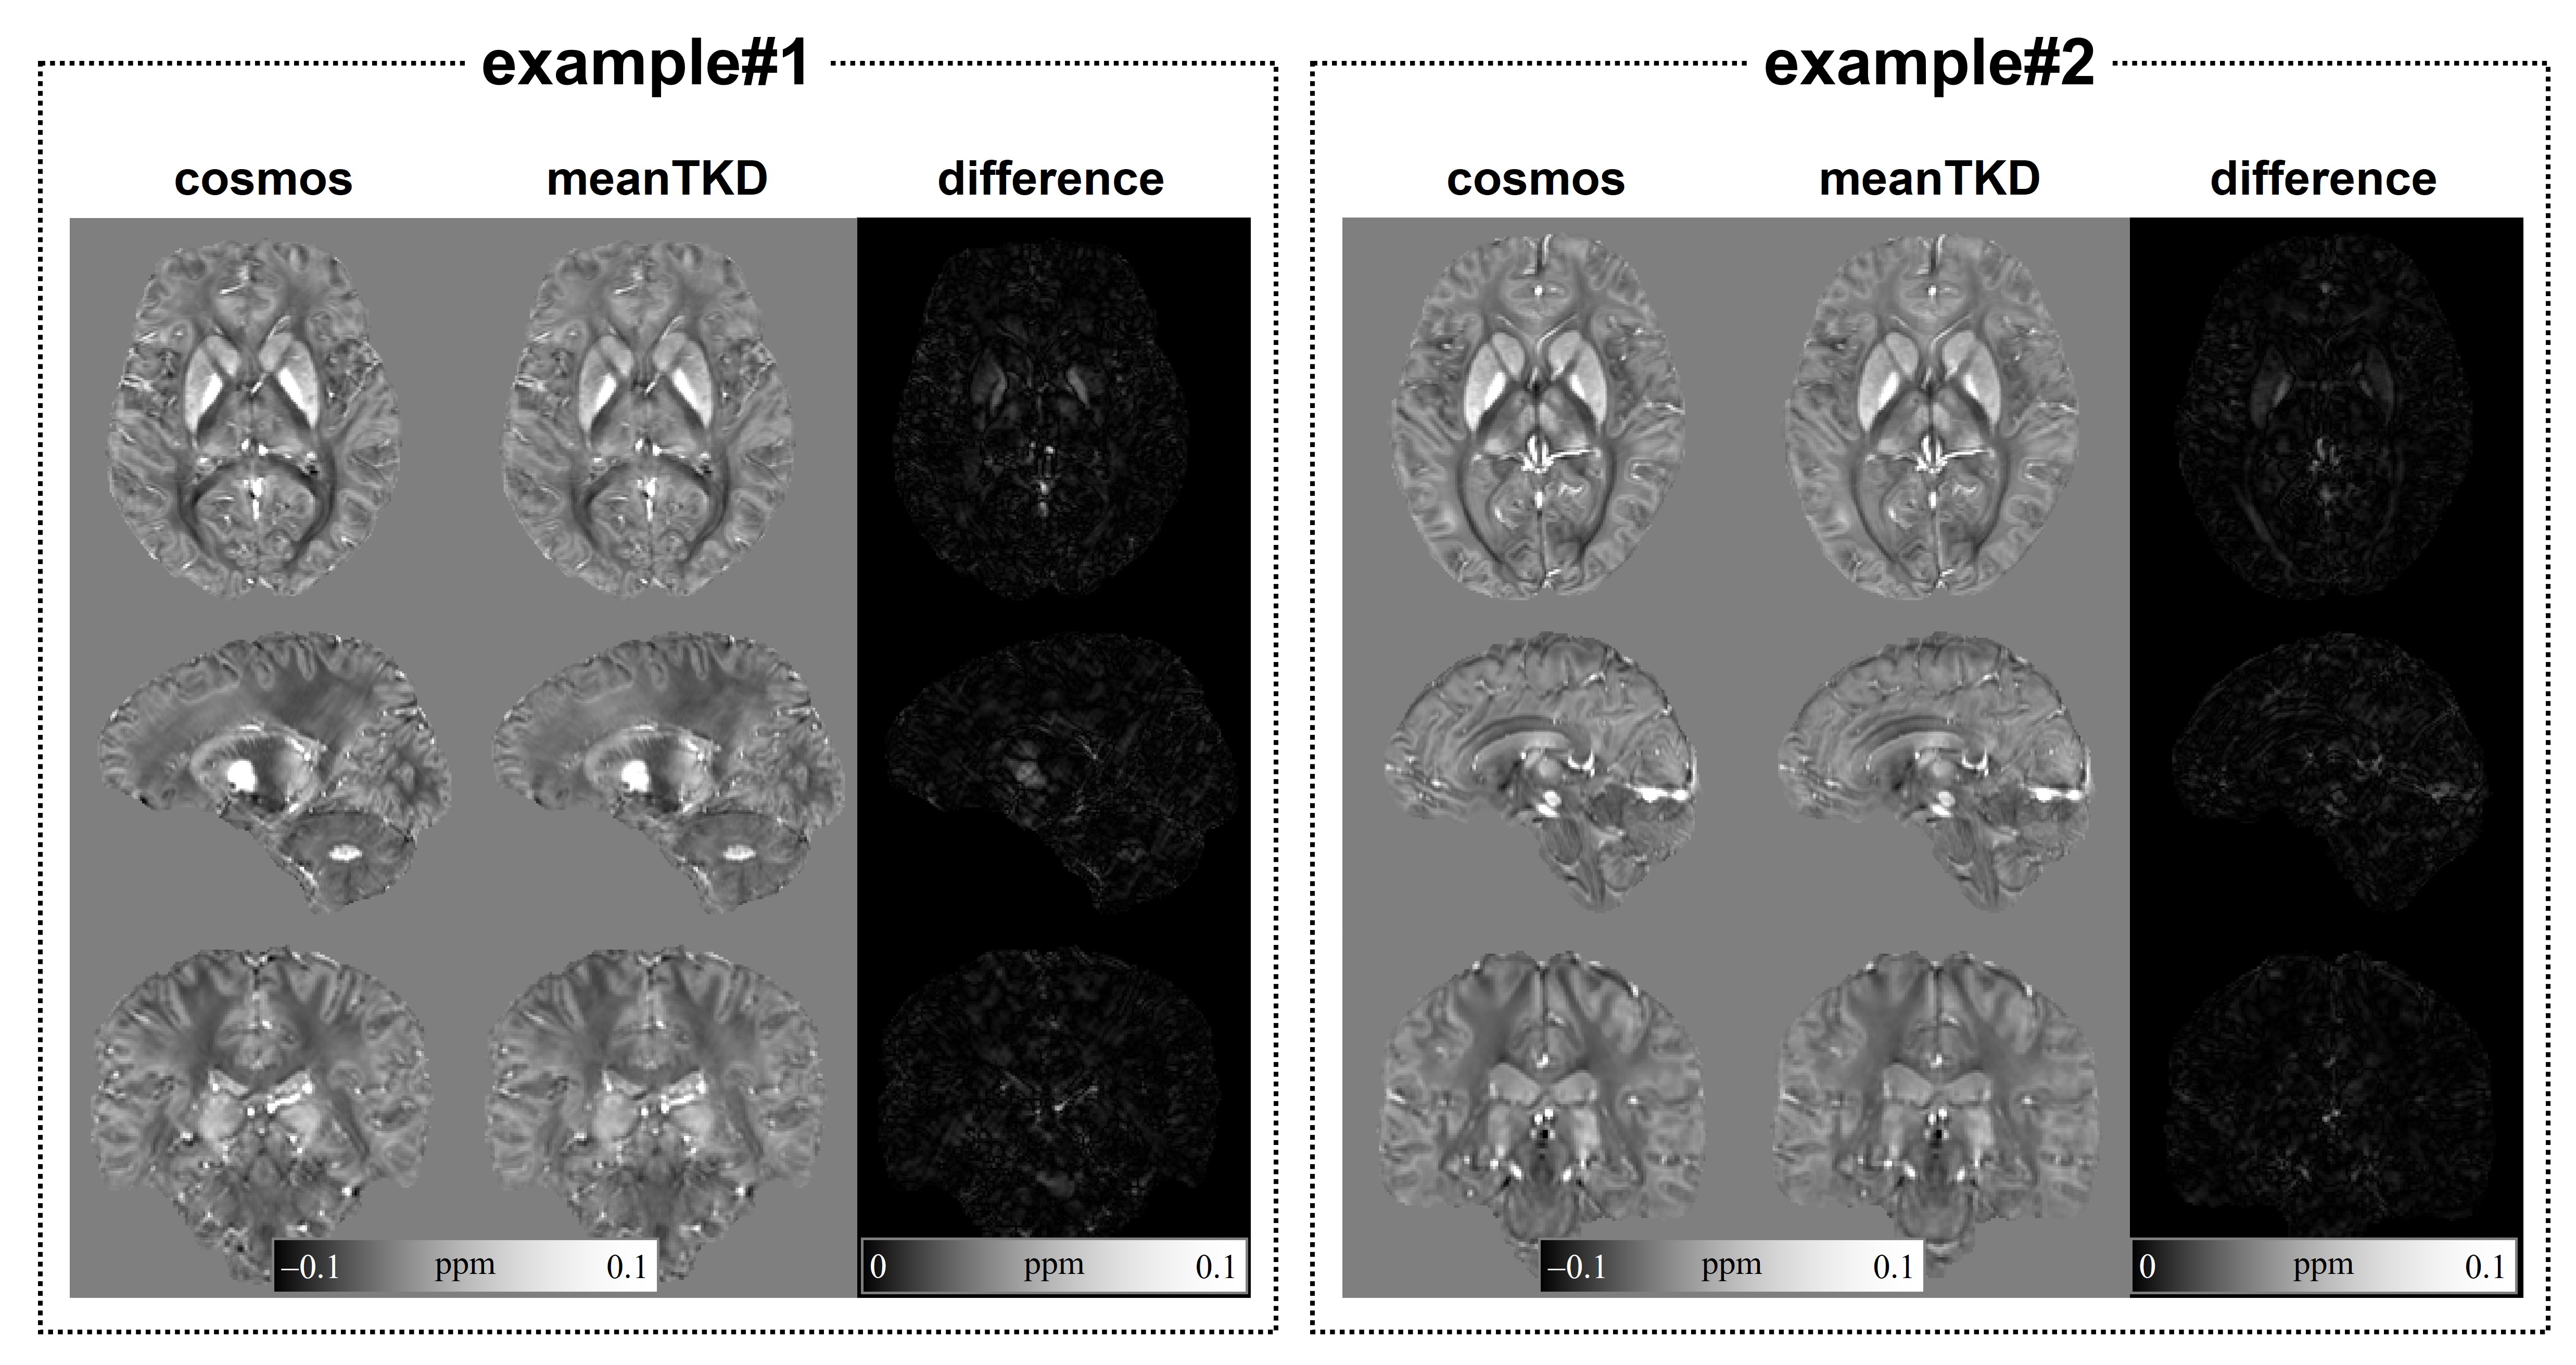
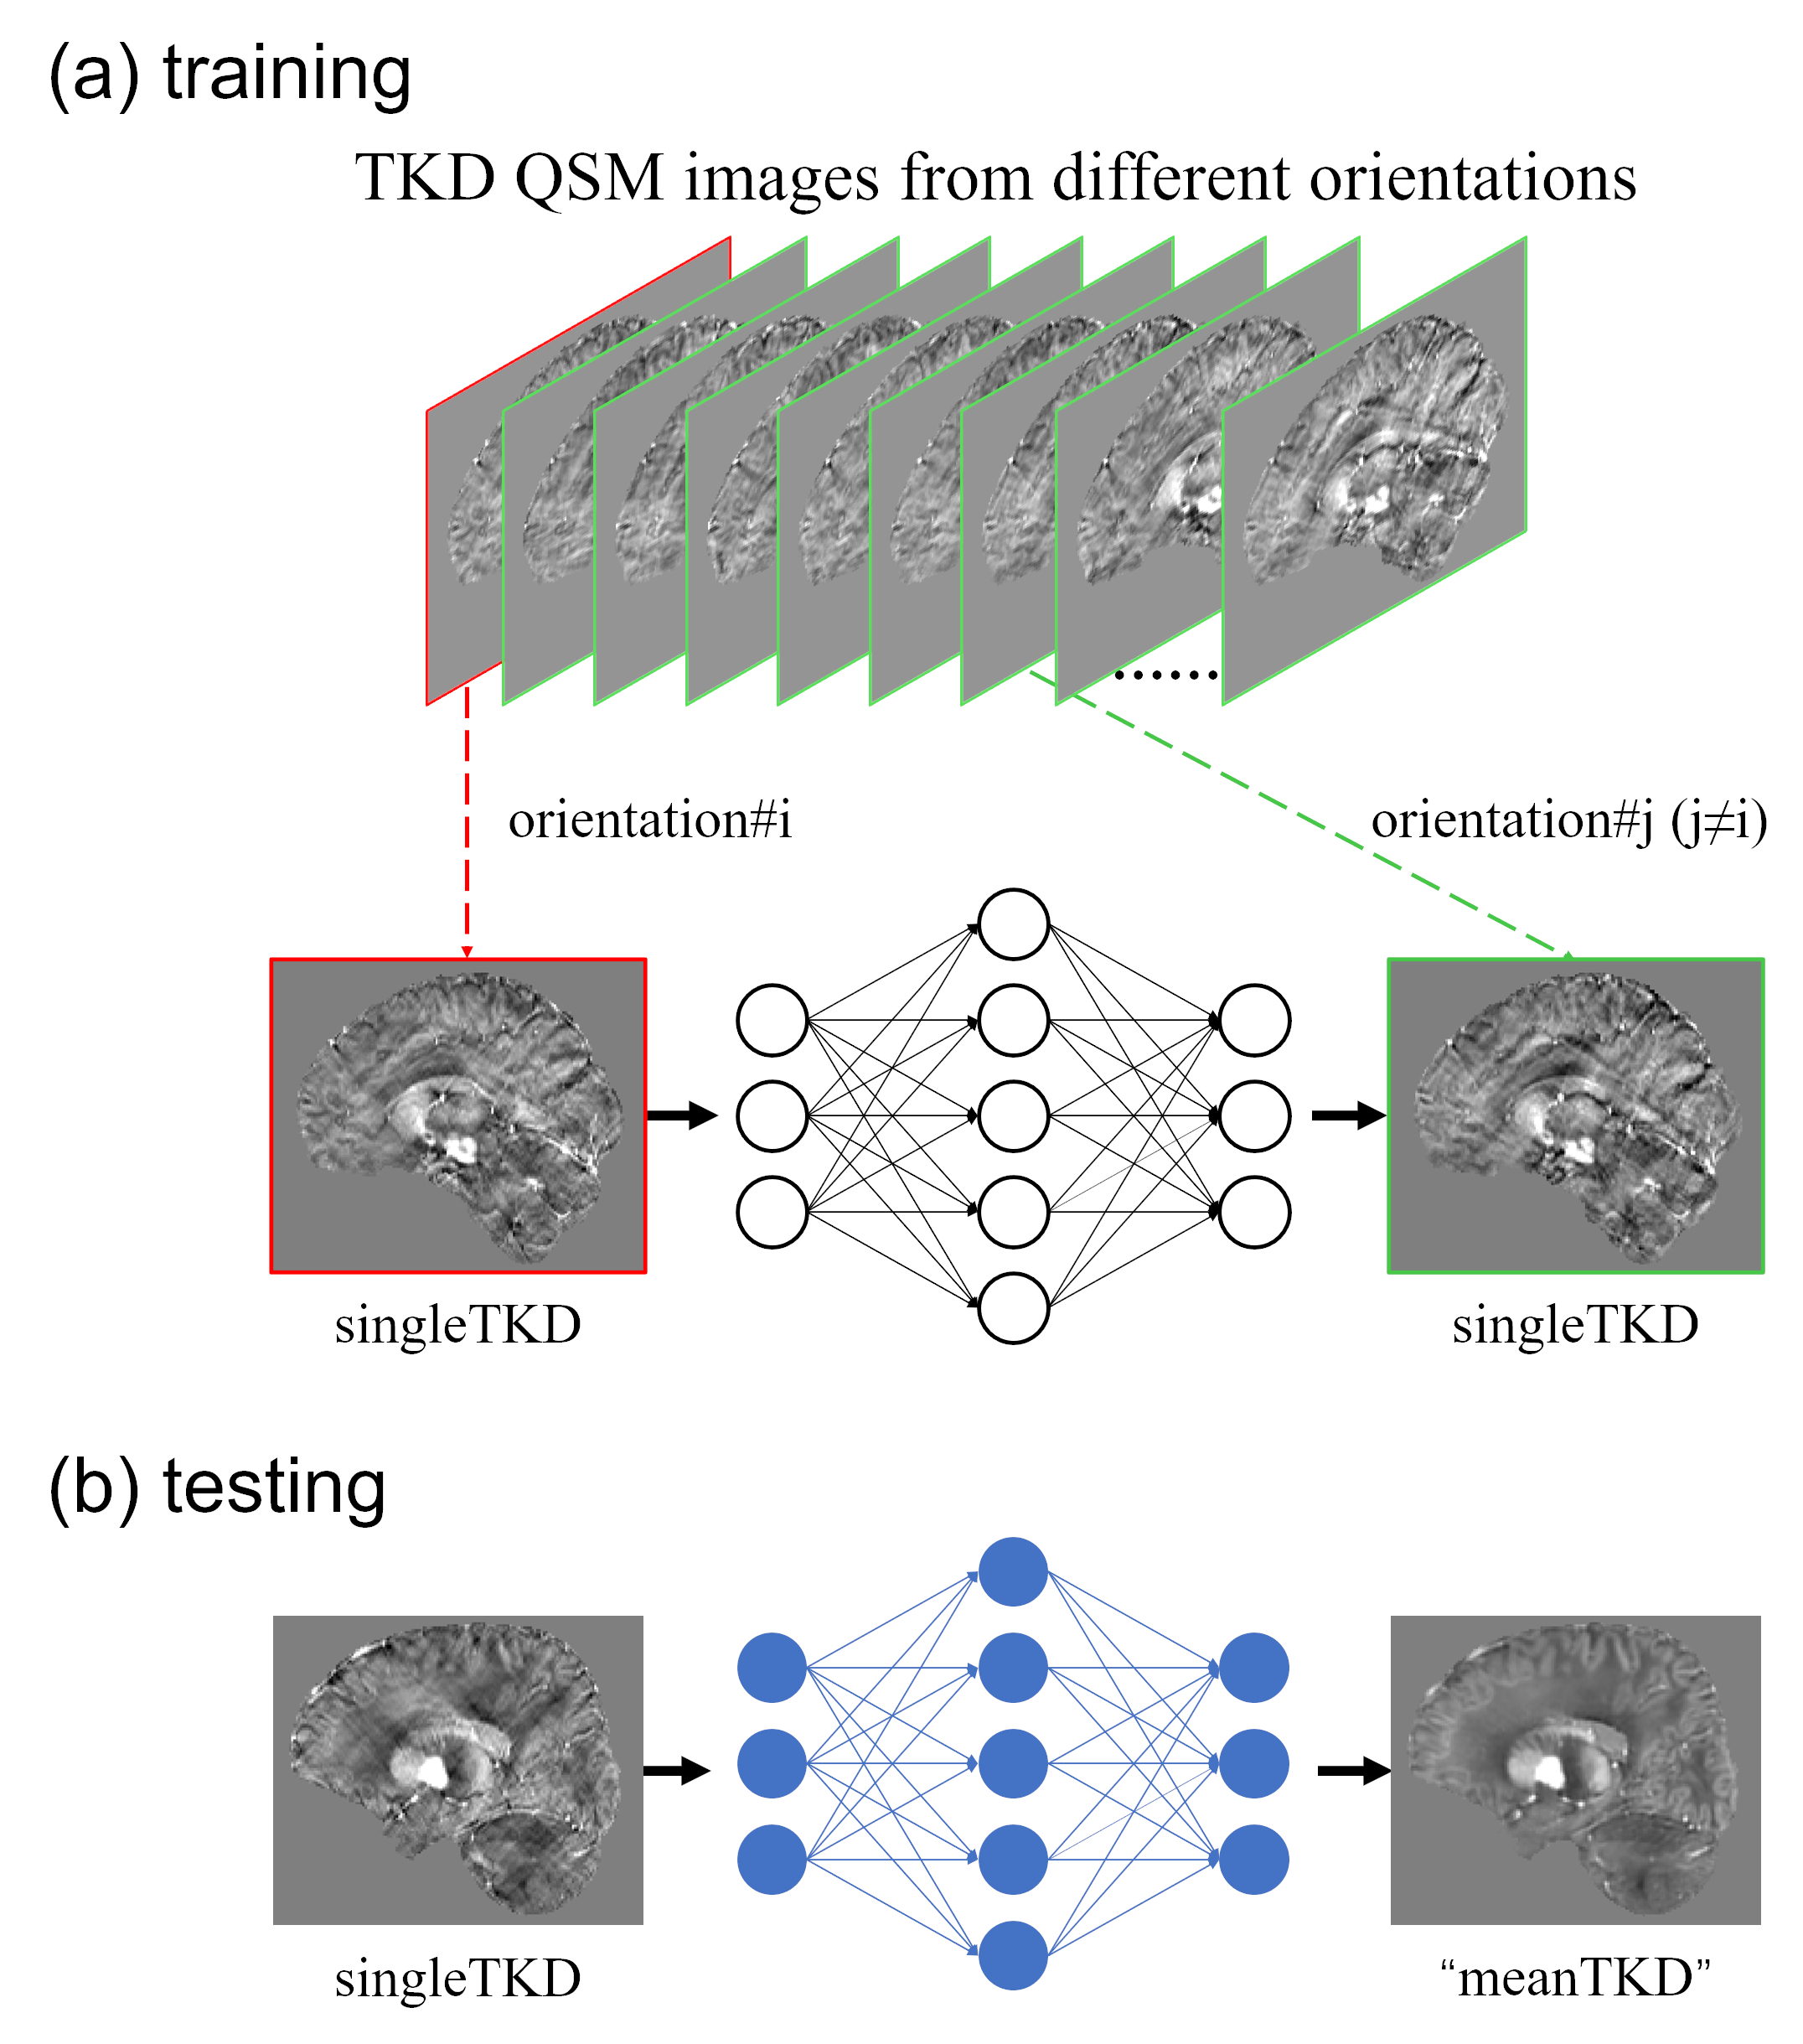
General PrincipleFor TKD images at multiple orientations, the pattern of streaking artifacts is unique in each head orientation (singleTKD) after directly inverting the rotated and truncated dipole kernels in k-space with respect to the main head direction. The streaking artifacts in multiple TKD QSM images could cancel each other and be suppressed on the average TKD QSM images (meanTKD) across different head orientations (Fig 1). Therefore, the meanTKD images could also be regarded as the underlying QSM reference. Furthermore, the deep neural network would be approximal to a mean estimator to produce the high-quality QSM images similar to meanTKD when only singleTKD image pairs were fed into the network5,6.
The general principle of TKD2TKD is depicted in Fig 2. The broadly used 3D U-net architecture with encoder and decoder parts was adopted for the TKD2TKD scheme. Two TKD images from different orientations were chosen as input-target image pairs for network training. TKD image from a single head direction was used as input for prediction.
For one subject with N head orientations, the number of input-output pairs will be N for the supervised method and N×N×(N-1) for TKD2TKD due to its mutual learning strategy. This indicated that TKD2TKD could naturally enlarge the sample size when data was given.
Training Data
The gradient-recalled echo data of one healthy human subject at 3T (TR=38 msec, TE1/ΔTE/TE6=7.7/5/32.7 msec, spatial resolution=1×1×1 mm3, 29 head orientations) was acquired for training. The tissue phases from multiple orientations were aligned to the normal supine position after phase unwrapping and background phase removal. The rotation matrix was automatically saved and then applied to the generation process of dipole kernel for TKD reconstruction, as well as STAR-QSM7 for evaluation purposes. The threshold for TKD was set as 0.1. TKD images in other directions were registered to the normal supine position by inverting the transformation matrix.
Performance Evaluation
Eight subjects (11~27 head directions) with the same acquisition parameters as the training dataset but not involved in the training process were used for evaluation. TKD image at the main direction was the input of the network. The region of interest (ROI) analysis was performed to assess the accuracy of susceptibility measurement in deep gray matter (DGM). TKD2TKD was also tested on QSM challenge 2016 data (12 orientations)1.
Results
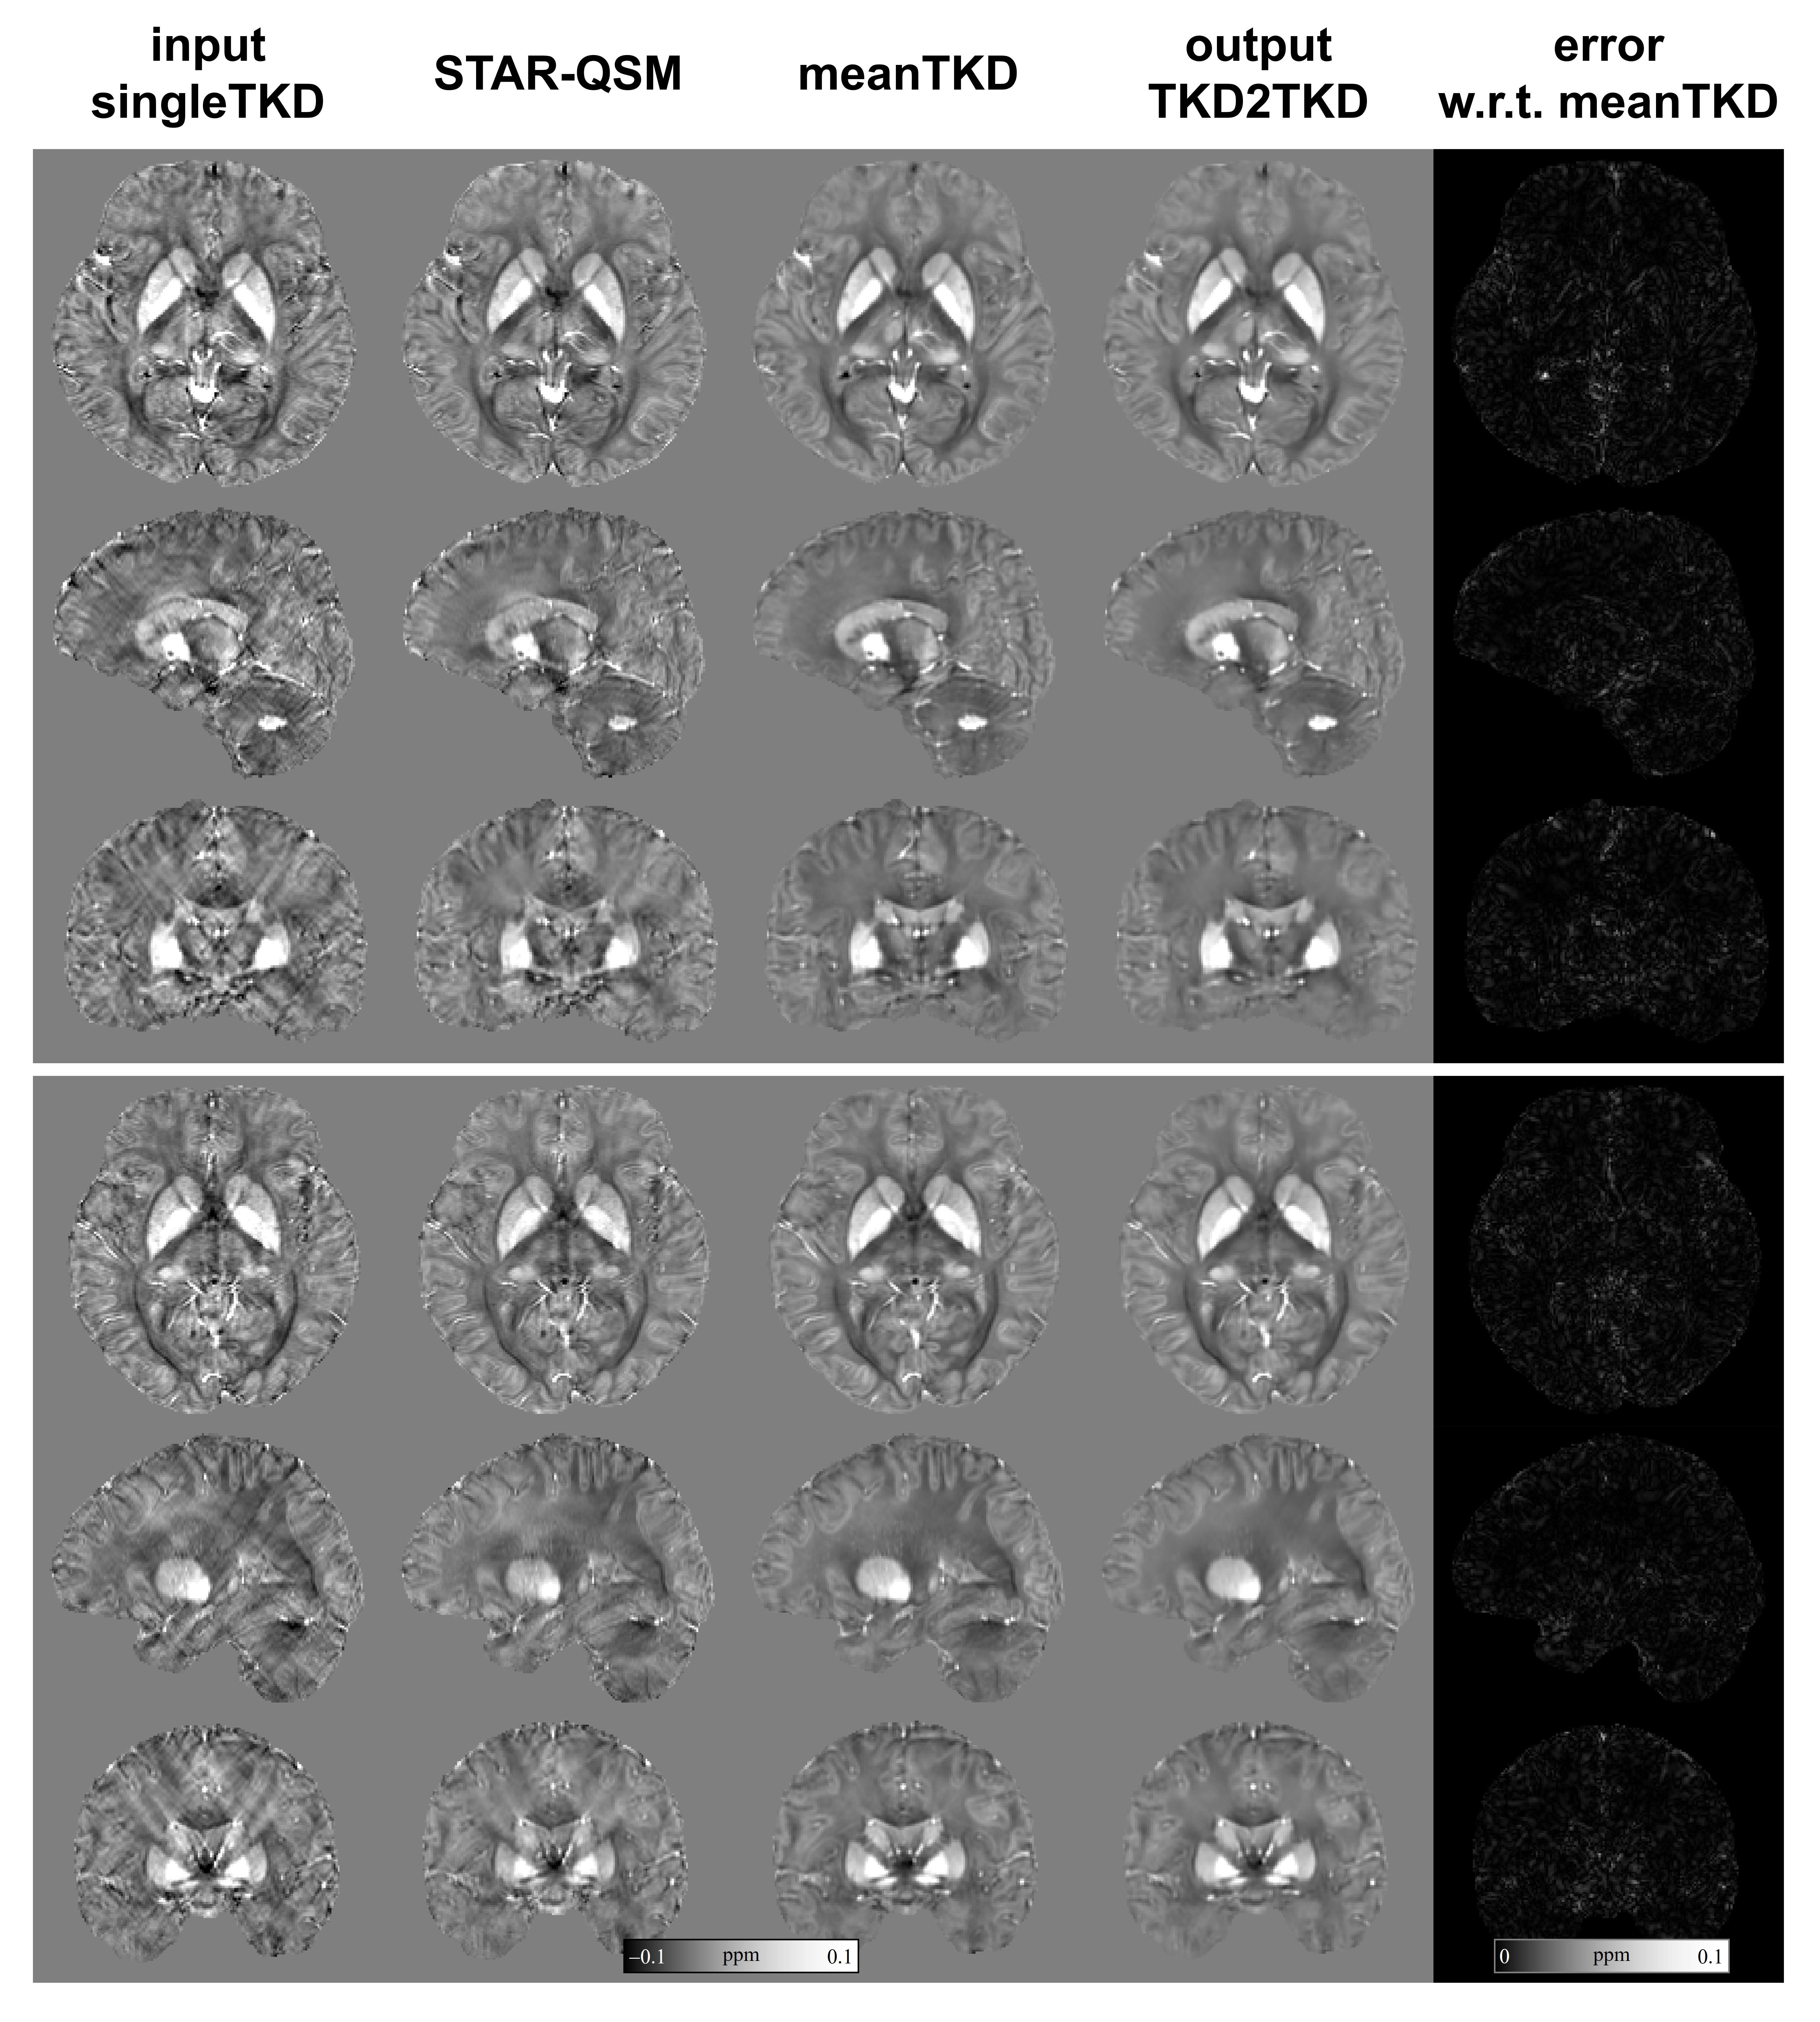
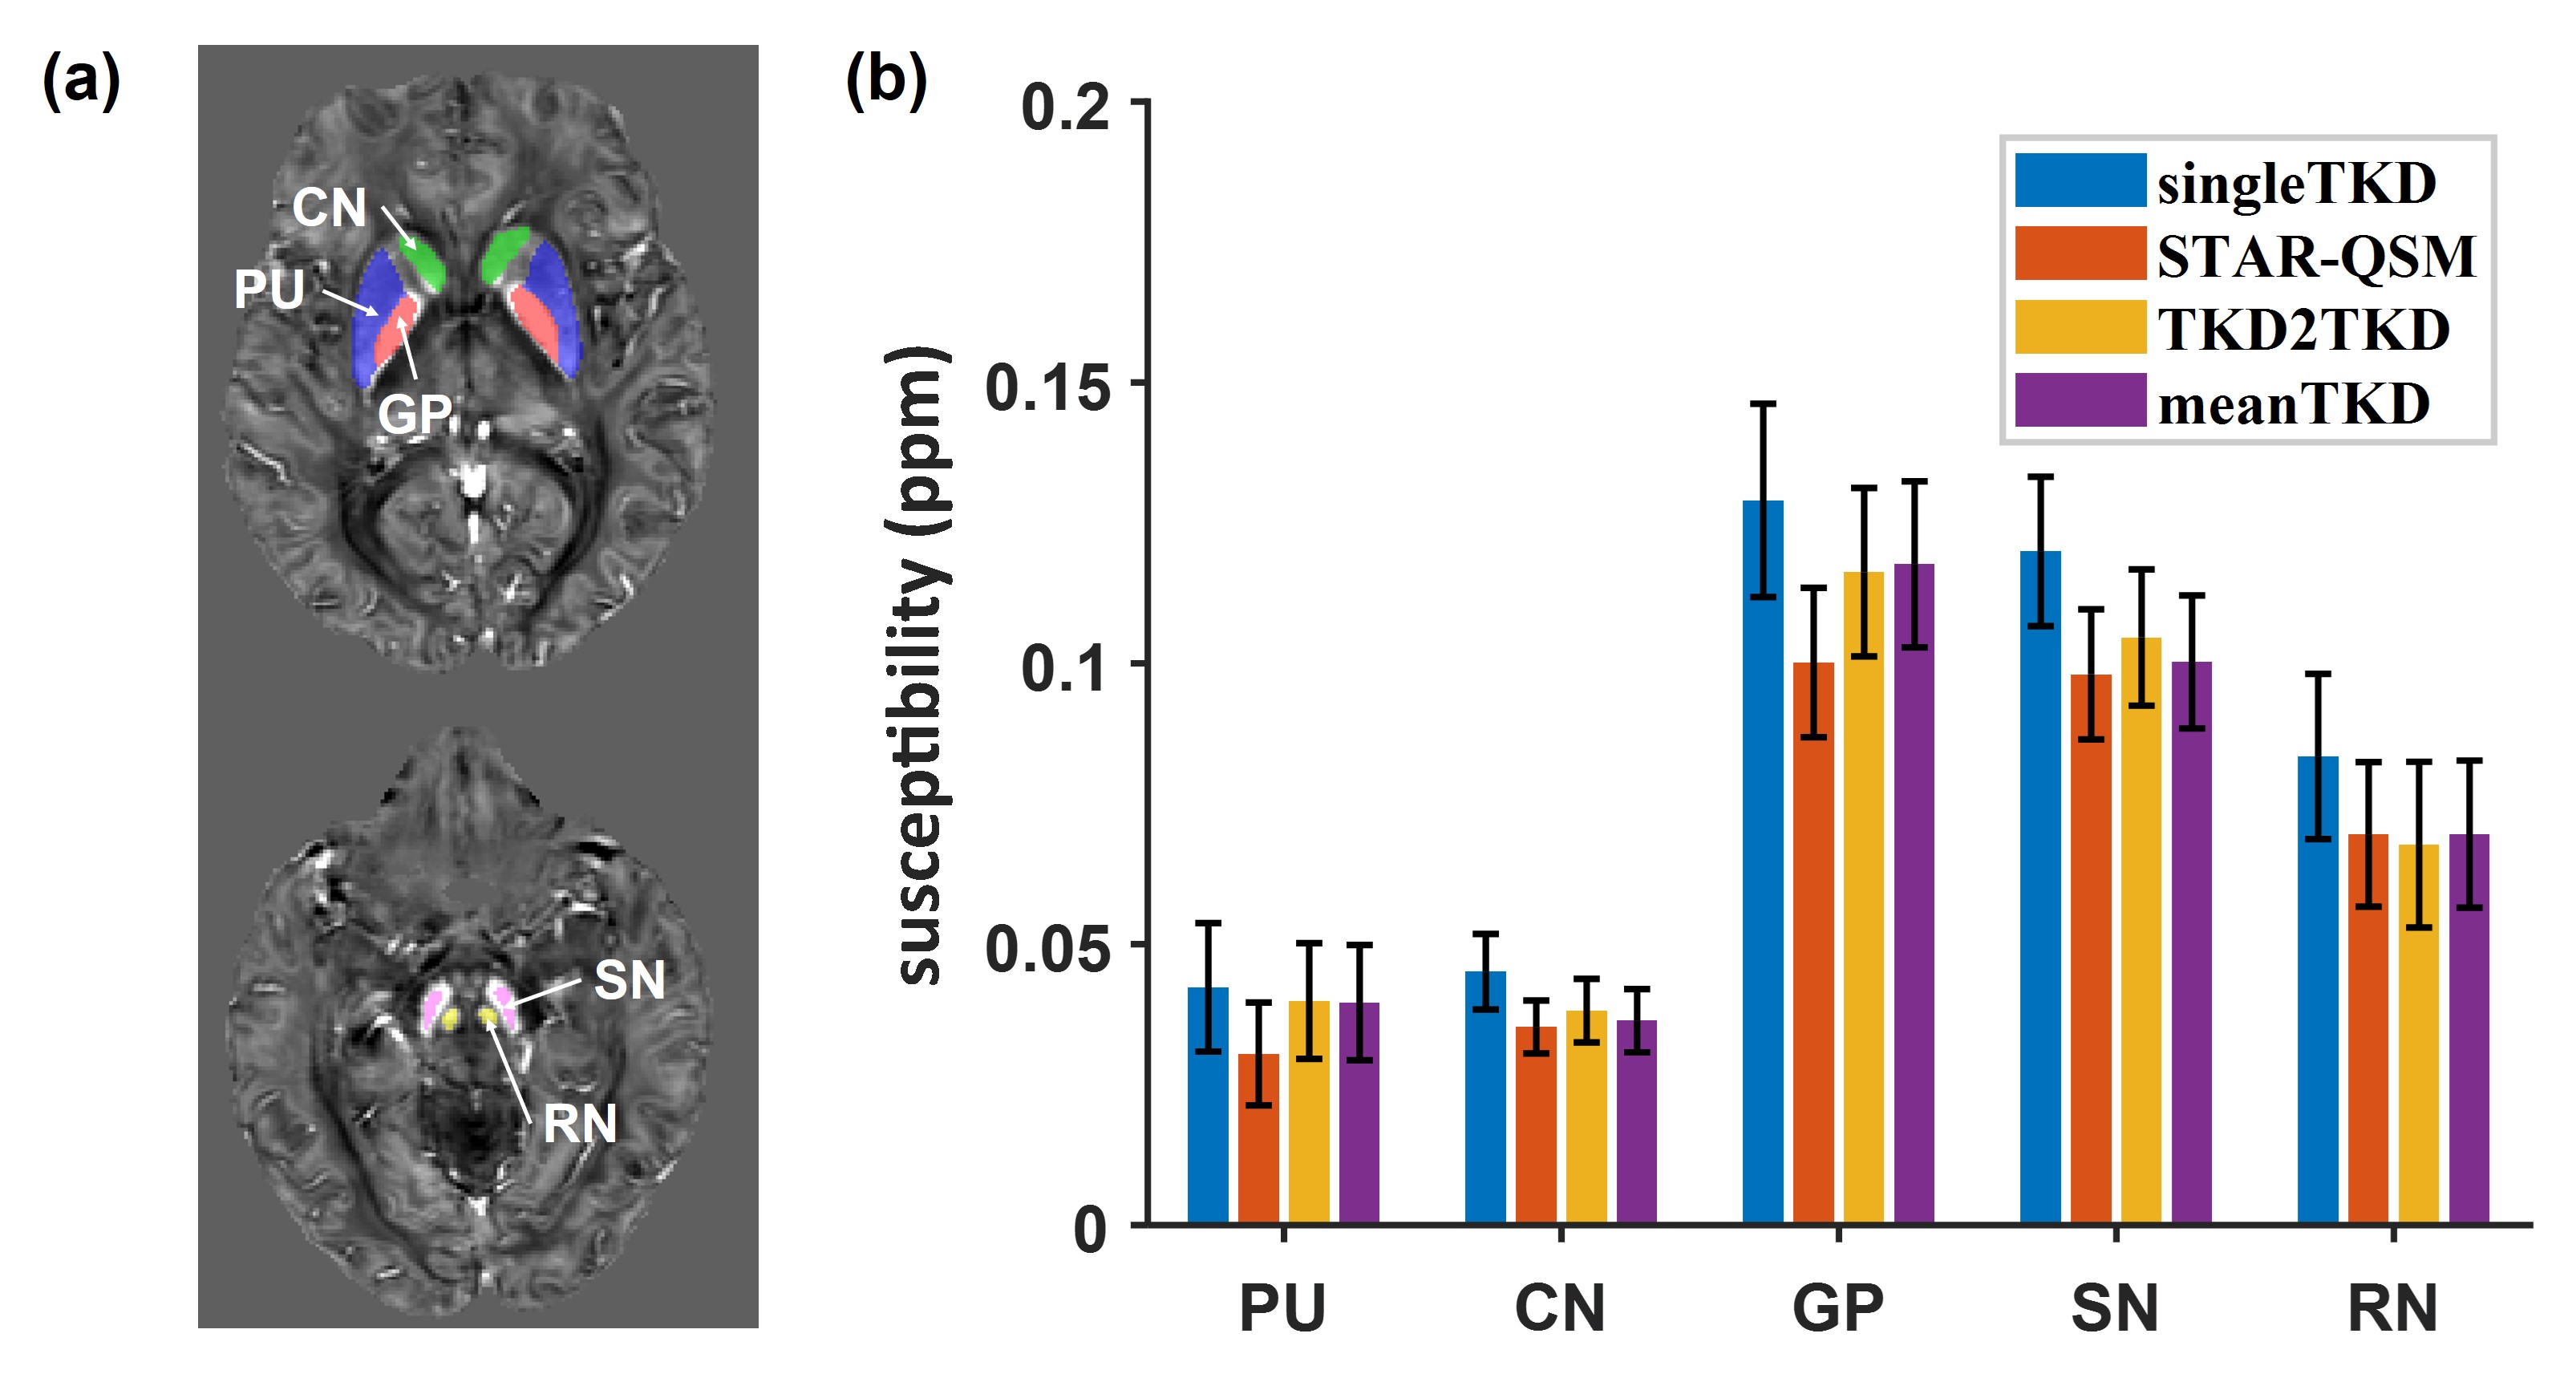
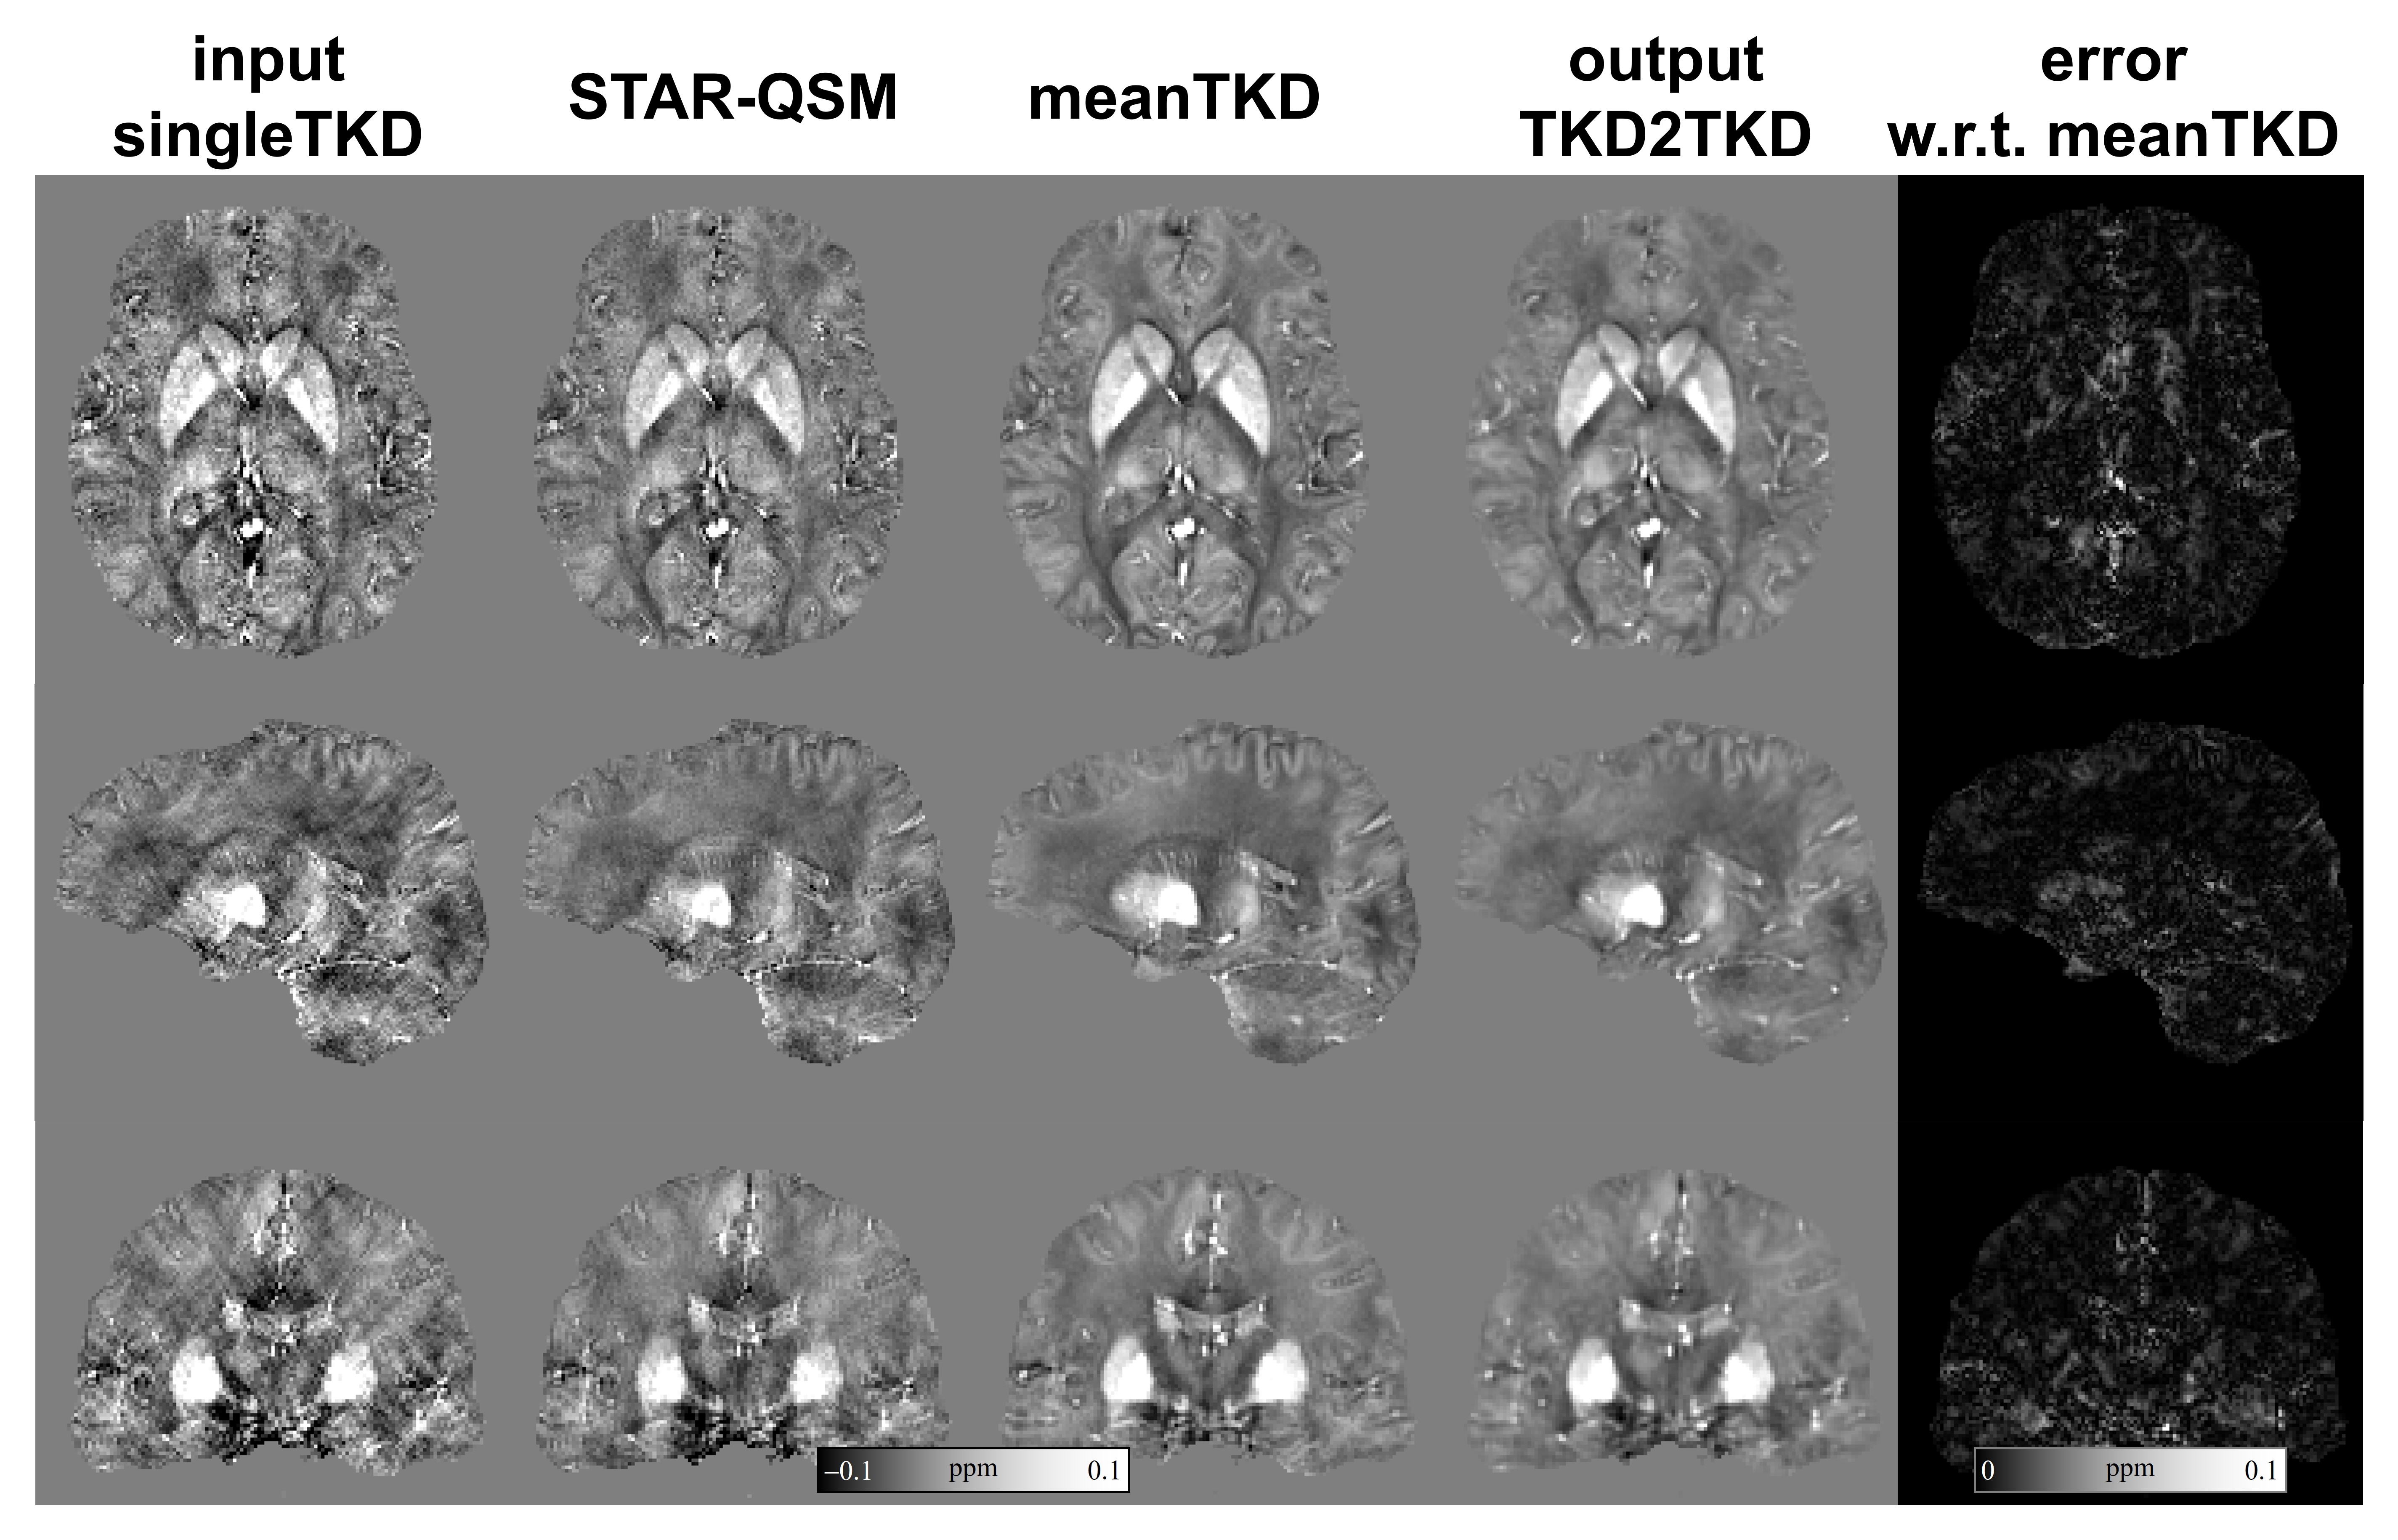
Fig 3 shows the predicted susceptibility map by TKD2TKD and its absolute difference map with respect to meanTKD on two healthy subjects. Visually, both singleTKD and STAR-QSM suffered from streaking artifacts with a low signal-to-noise ratio. In contrast, TKD2TKD provided improved image quality with a clear delineation between gray and white matters in the brain cortex.Fig 4 shows the results of ROI analysis in DGM. The mean susceptibility value in DGM measured by TKD2TKD was closer to that measured on meanTKD maps, which are regarded as the “reference” for performance evaluation in this study.
Fig 5 shows the reconstructed QSM on 2016 QSM challenge data in three orthogonal planes. Visually, TKD2TKD showed less noise and revealed better tissue structural contrast than single orientation reconstruction methods.
Discussion
In this study, we proposed a novel deep learning-based method for QSM reconstruction without ground truth susceptibility as training labels. TKD2TKD could surpass the performance of singleTKD and STAR-QSM from single orientation QSM. Moreover, TKD2TKD could suppress the artifacts and noise for QSM, providing an improved susceptibility quantification accuracy. More importantly, our proposed neural network was trained only on one subject data, which is helpful when extensive training data are not available for QSM.Conclusion
In conclusion, our preliminary results indicated that the TKD2TKD strategy could possess the potential for accurate susceptibility mapping only using paired TKD images from one subject for training. Future studies focusing on the preconditions and fundamental basis of TKD2TKD were needed to achieve the interpretability of the TKD2TKD method.Acknowledgements
No acknowledgement found.References
1. Langkammer C, Schweser F, Shmueli K, et al. Quantitative susceptibility mapping: Report from the 2016 reconstruction challenge. Magnetic Resonance in Medicine 2018;79(3):1661-1673.
2. Liu T, Spincemaille P, de Rochefort L, et al. Calculation of susceptibility through multiple orientation sampling (COSMOS): A method for conditioning the inverse problem from measured magnetic field map to susceptibility source image in MRI. Magnetic Resonance in Medicine 2009;61(1):196-204.
3. Liu, C. Susceptibility tensor imaging. Magnetic Resonance in Medicine 2010;63(6):1471-1477.
4. Shmueli K, de Zwart JA, van Gelderen P, et al. Magnetic susceptibility mapping of brain tissue in vivo using MRI phase data. Magnetic Resonance in Medicine 2009;62(6):1510-1522.
5. Lehtinen J, Munkberg J, Hasselgren J, et al. Noise2noise: Learning image restoration without clean data. arXiv preprint arXiv:180304189 2018.
6. Li X, Zhang G, Wu J, et al. Reinforcing neuron extraction and spike inference in calcium imaging using deep self-supervised denoising. Nature Methods 2021:1-6.
7. Wei H, Dibb R, Zhou Y, et al. Streaking artifact reduction for quantitative susceptibility mapping of sources with large dynamic range. NMR in Biomedicine 2015;28(10):1294-1303.
Figures