4710
Accelerating Cerebrovascular 4D Flow by Low-Rank and Sparsity Constraints at Ultra-High Field
Xueying Zhao1, Pierre-Francois Van de Moortele2, Ying-Hua Chu3, and He Wang1,4
1Institute of Science and Technology for Brain-inspired Intelligence, Fudan University, Shanghai, China, 2Center for Magnetic Resonance Research, University of Minnesota, minneapolis, MN, United States, 3MR Collaboration, Siemens Healthineers Ltd., Shanghai, China, Shanghai, China, 4Human Phenome Institute, Fudan University, Shanghai, China
1Institute of Science and Technology for Brain-inspired Intelligence, Fudan University, Shanghai, China, 2Center for Magnetic Resonance Research, University of Minnesota, minneapolis, MN, United States, 3MR Collaboration, Siemens Healthineers Ltd., Shanghai, China, Shanghai, China, 4Human Phenome Institute, Fudan University, Shanghai, China
Synopsis
Inspired by the success of low-rank and sparsity (L+S) representation in 4D flow MRI acceleration of great vessels (e.g. hearts or aortic), we managed to implement a generalized L+S reconstruction framework for cerebrovascular 4D flow at 7T. The iterative hard-thresholding approach was adopted instead of the popular used soft-thresholding method because we found soft-thresholding underestimated the reconstructed phase value while hard-thresholding well preserved the phase information. The L+S reconstructed magnitude and phase value at an acceleration factor of 10 is comparable to the fully sampled reference and represents less errors compared with other compressed sensing based approaches.
Introduction
4D flow MRI is a time-resolved Phase-Contrast MRI technique with velocity encoding along all three flow directions and 3D anatomic coverage, which allows for the comprehensive evaluation of complex blood flow patterns by 3D blood flow visualization and flexible retrospective quantification of flow parameters1. The pathological altered hemodynamic information provided by 4D flow serves as an important indicator in cerebrovascular diseases, for instance, to evaluate the risks of brain aneurysm ruputure2. However, the clinical usage of 4D flow is largely hindered by its long acquisition time, especially for brain application because a higher spatial resolution is required compared to 4D flow applications in the heart and great vessels. Recently, Giuseppe V. et al. have revealed that aortic 4D flow data can be represented as the sum of a low-rank and a sparse component(L+S)3. Inspired by their work, we managed to implement a generalized L+S reconstruction framework to cerebral 4D flow MRI at 7T. Compared to the existing Compressing Sensing methods, our L+S framework showed lower errors in the reconstructed magnitude and phase data at an acceleration factor of 10.Methods
The L+S reconstruction was performed in MATLAB by solving a regularized least-squares problem while tuning two independent parameters ($$$\lambda_L$$$, $$$\lambda_S$$$) to weigh the low-rank and the sparsity penalty4, as shown below:$$ {\bf \hat{L}}, {\bf \hat{S}} = \mathop{\arg\min}\limits_{\bf{L},{\bf{S}}}\frac{1}{2}\parallel {{\bf E}}({\bf L}+{\bf S})-{\bf d} \parallel^2_2+\lambda_L\parallel {\bf L} \parallel_*+\lambda_S\parallel {\bf \Psi} {\bf S} \parallel_1$$ The first term represents the data consistency, where $$${\bf E}$$$ is the encoding operator consisting of the product of the undersampled Fourier transform and coil sensitivity maps. The vector $$${\bf d}$$$ represents the acquired data, corrupted by noise. The second term is the nuclear norm of the $$${\bf L}$$$ component. And the last term represents the L1 norm of the $$${\bf S}$$$ component, in which $$${\bf \Psi}$$$ is the sparsity transform, which incorporates both Hadamard transforms on the velocity encoding dimensions and Fourier transforms on the temporal dimension. The feasibility of the proposed L+S reconstruction was tested using retrospective undersampling of fully sampled data(FOV=224*224*20mm, spatial resolustion=1*1*3mm, temporal resolution=47ms, acquired at 7T Scanner, Terra, Siemens Healthcare, Erlangen, Germany), which enables comparison reconstruction results with the fully sampled reference. The variable density undersampling pattern was generated by Gaussian random sampling at different downsampling rates(R=10, 16, 20). Vessel masks were generated from PC-MRA data for quantitative ROI analysis. The performance of the proposed L+S framework was compared with CS approaches using the BART toolbox5 with three different regularization penalties: Total Variation(CS_TV), global low-rank(CS_GLR), and locally low-rank(CS_LLR).Results & Discussion
Figure 1 is an example showing the reconstructed L component (Low-rank matrix) and S component (Sparsity matrix) of the L+S algorithm, in which the k-space undersampling rate is 10. As displayed in the magnitude image, the overall brain structure was described by the L component, while the S component mainly captures the dynamic brain vascular information from the whole brain background. A visual comparison between the L+S reconstruction at R=10 and the fully sampled reference can be found in Figure 2. The quantitative comparison results are listed in Table 1, the averaged magnitude and phase error within the vessel ROI are less than 1% at R=10 and increased with R. As shown in Table 2, the accuracy of reconstructed magnitude and phase values of L+S outperformed three compressed sensing based approaches with different regularization constraints. Note that, during the iterative L+S reconstruction process, we utilized the hard-thresholding method instead of the popular used soft-thresholding approach, because we found the soft-thresholding will underestimate the phase value of the reconstructed 4D flow image while hard-thresholding well preserved the phase information, as exhibited in Figure 3.Conclusion
Our preliminary experiment results support the assumption that the L+S algorithm is suitable for 4D flow acceleration in the cerebrovascular context. The L+S reconstructed magnitude and phase value at an acceleration factor of 10 are comparable to the fully sampled reference with better accuracy than compressed sensing based approaches.Acknowledgements
Funding: This work was supported by the National Natural Science Foundation of China (No. 81971583), National Key R&D Program of China (No. 2018YFC1312900), Shanghai Natural Science Foundation (No. 20ZR1406400), Shanghai Municipal Science and Technology Major Project (No.2017SHZDZX01, No.2018SHZDZX01), China Scholarship Council (CSC) and ZJLab. Also, we appreciated the help from the Center for Magnetic Resonance Research(CMRR), University of Minnesota.References
- Michael M, Alex F, Sebastian K, et al. 4D flow MRI. Journal of magnetic resonance imaging : JMRI, vol. 36, no. 5, pp. 1015–1036, Nov. 2012, doi: 10.1002/JMRI.23632.
- Susanne S, Sameer A. A, Parmede V, et al. Three-dimensional hemodynamics in intracranial aneurysms: influence of size and morphology. Journal of magnetic resonance imaging : JMRI, vol. 39, no. 1, pp. 120–131, Jan. 2014, doi: 10.1002/JMRI.24110.
- Giuseppe V, Nicola M, Adrian H, et al. Accelerating 4D flow MRI by exploiting low-rank matrix structure and Hadamard sparsity. Magnetic resonance in medicine, vol. 78, no. 4, pp. 1330–1341, Oct. 2017, doi: 10.1002/MRM.26508.
- Ricardo O, Emmanuel C, and Daniel K. S. Low-rank plus sparse matrix decomposition for accelerated dynamic MRI with separation of background and dynamic components. Magnetic resonance in medicine, vol. 73, no. 3, pp. 1125–1136, Mar. 2015, doi: 10.1002/MRM.25240.
- BART Toolbox for Computational Magnetic Resonance Imaging, DOI: 10.5281/zenodo.592960.
Figures

Figure 1. An example showing the reconstructed L component (Low-rank matrix) and S component (Sparsity matrix) of the L+S algorithm(downsampling rate=10). The reconstructed magnitude images and phase images are represented at the 1st, 8th, and 16th cardiac frames.
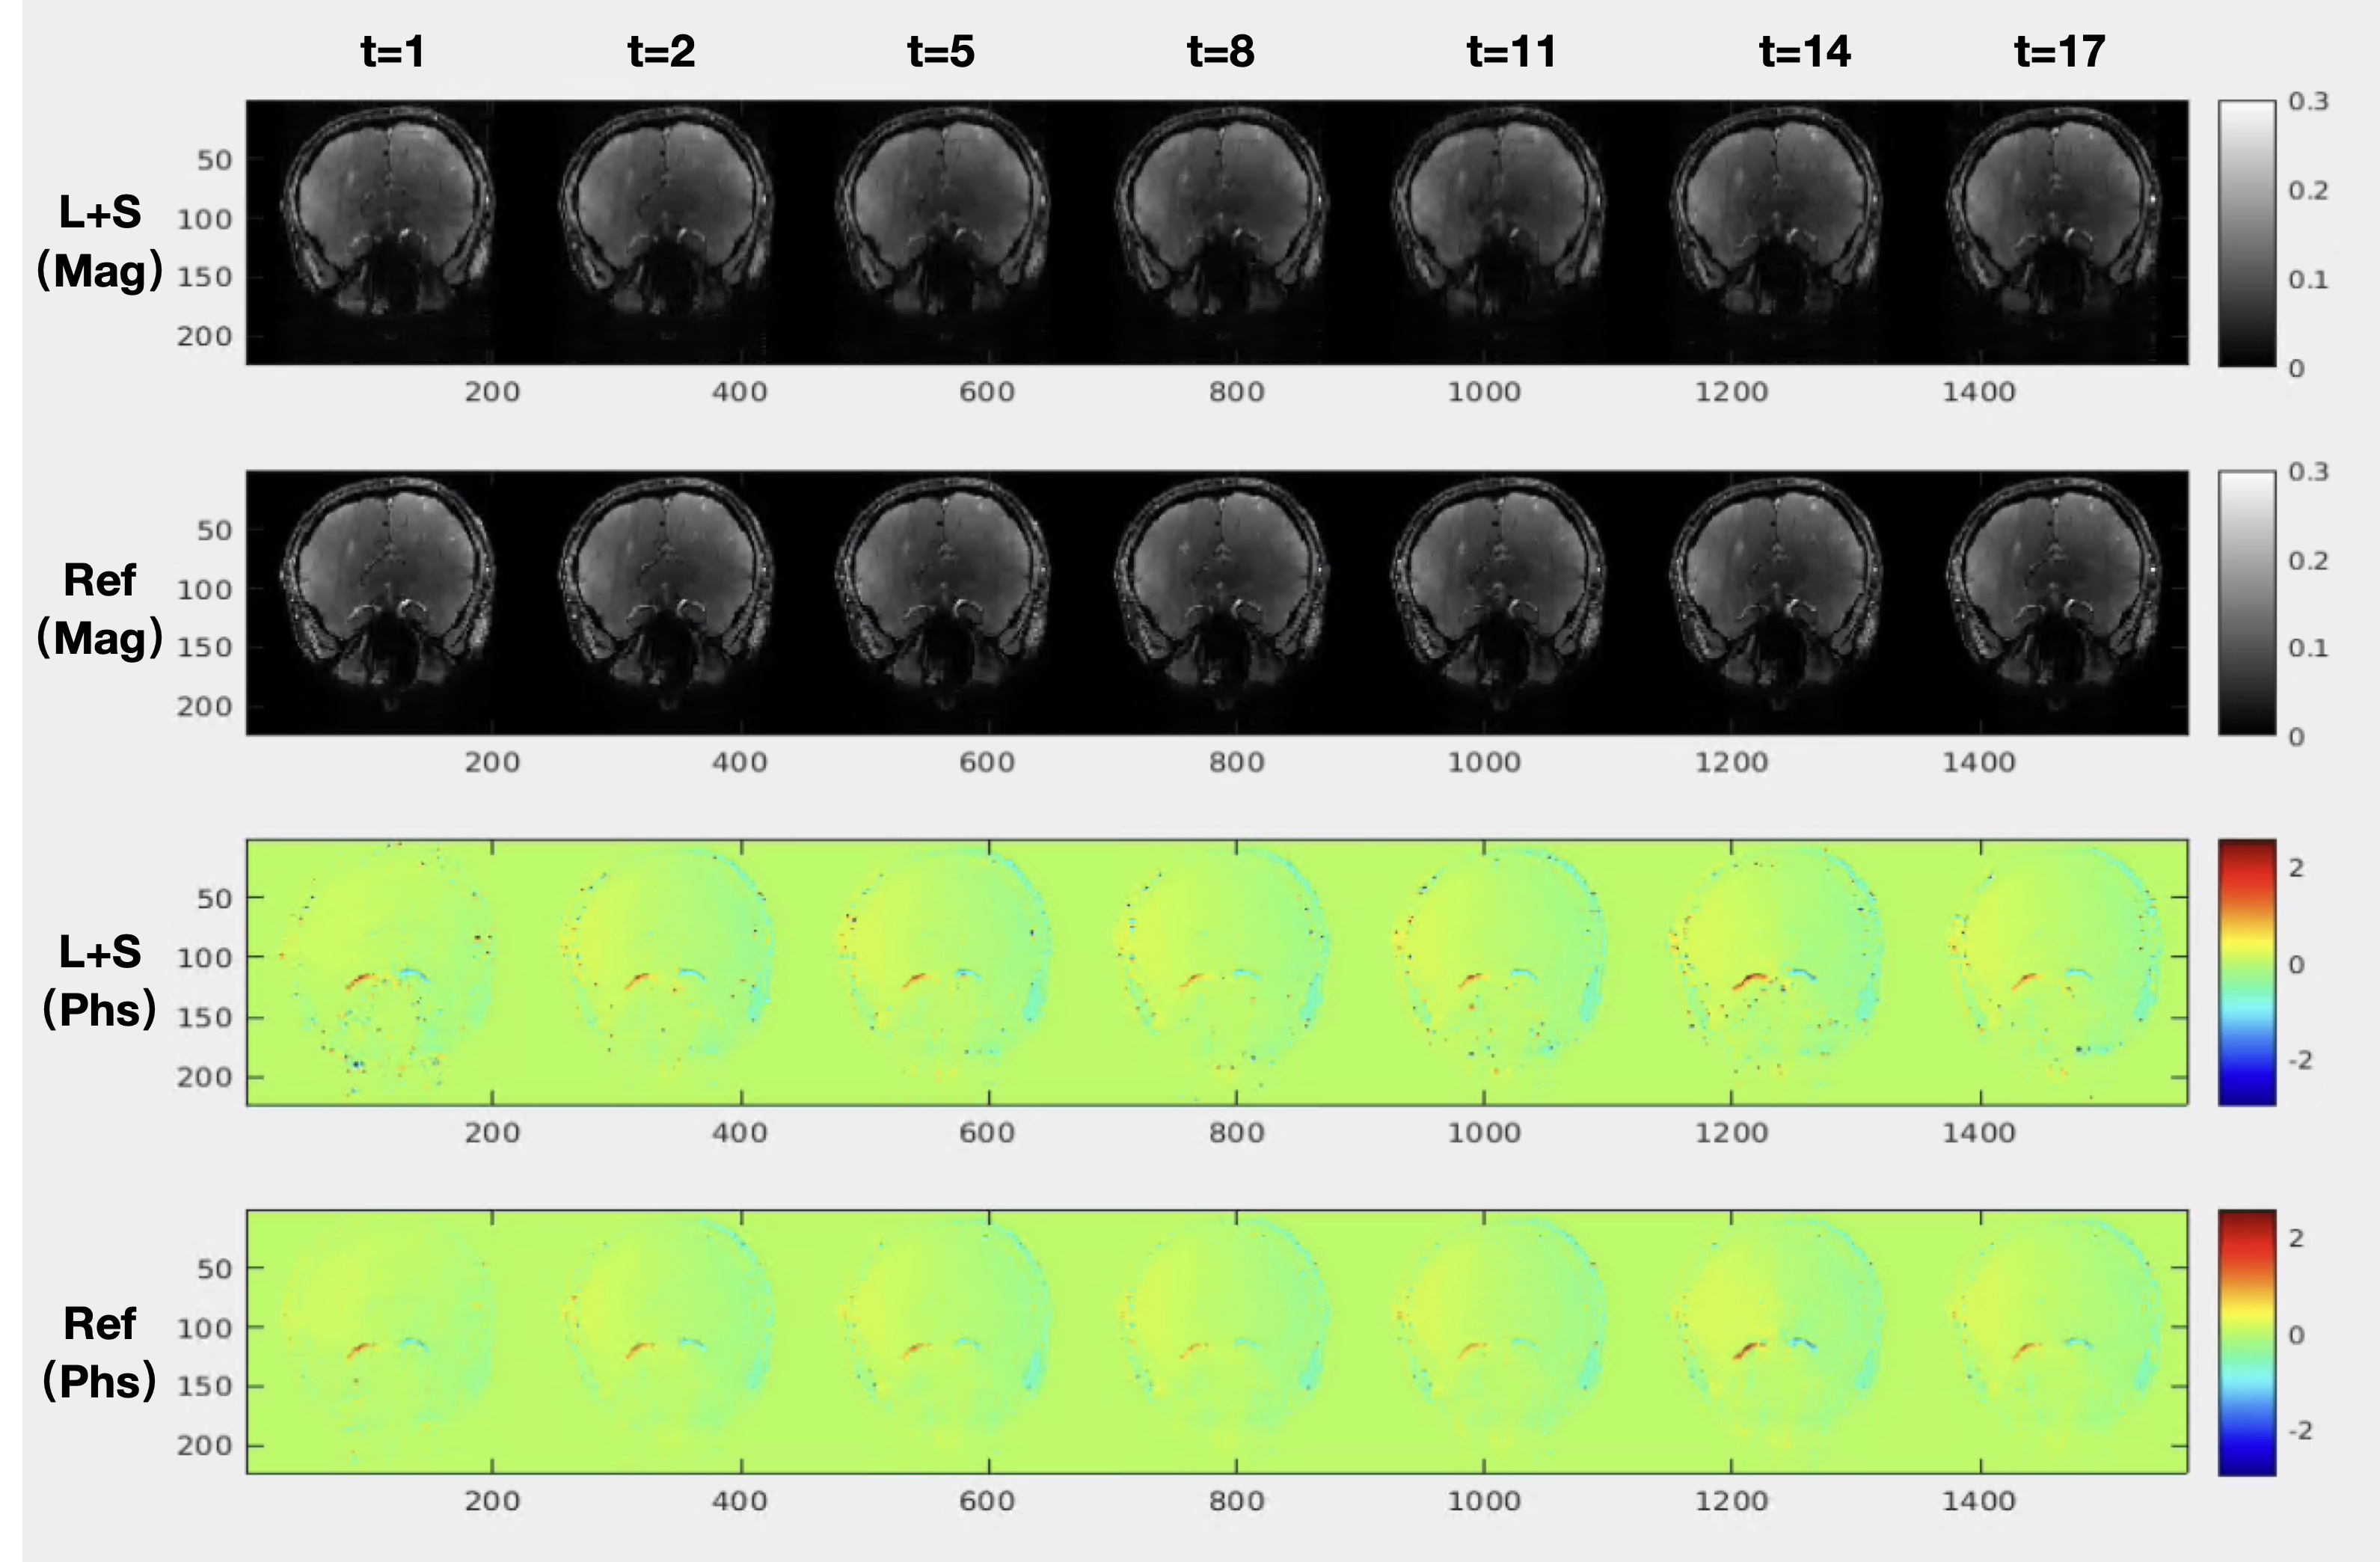
Figure 2. Qualitative comparison with the fully sampled reference. The L+S reconstructed magnitude and phase images (acceleration factor R=10) are displayed at different cardiac frames with the comparison of the fully sampled reference.
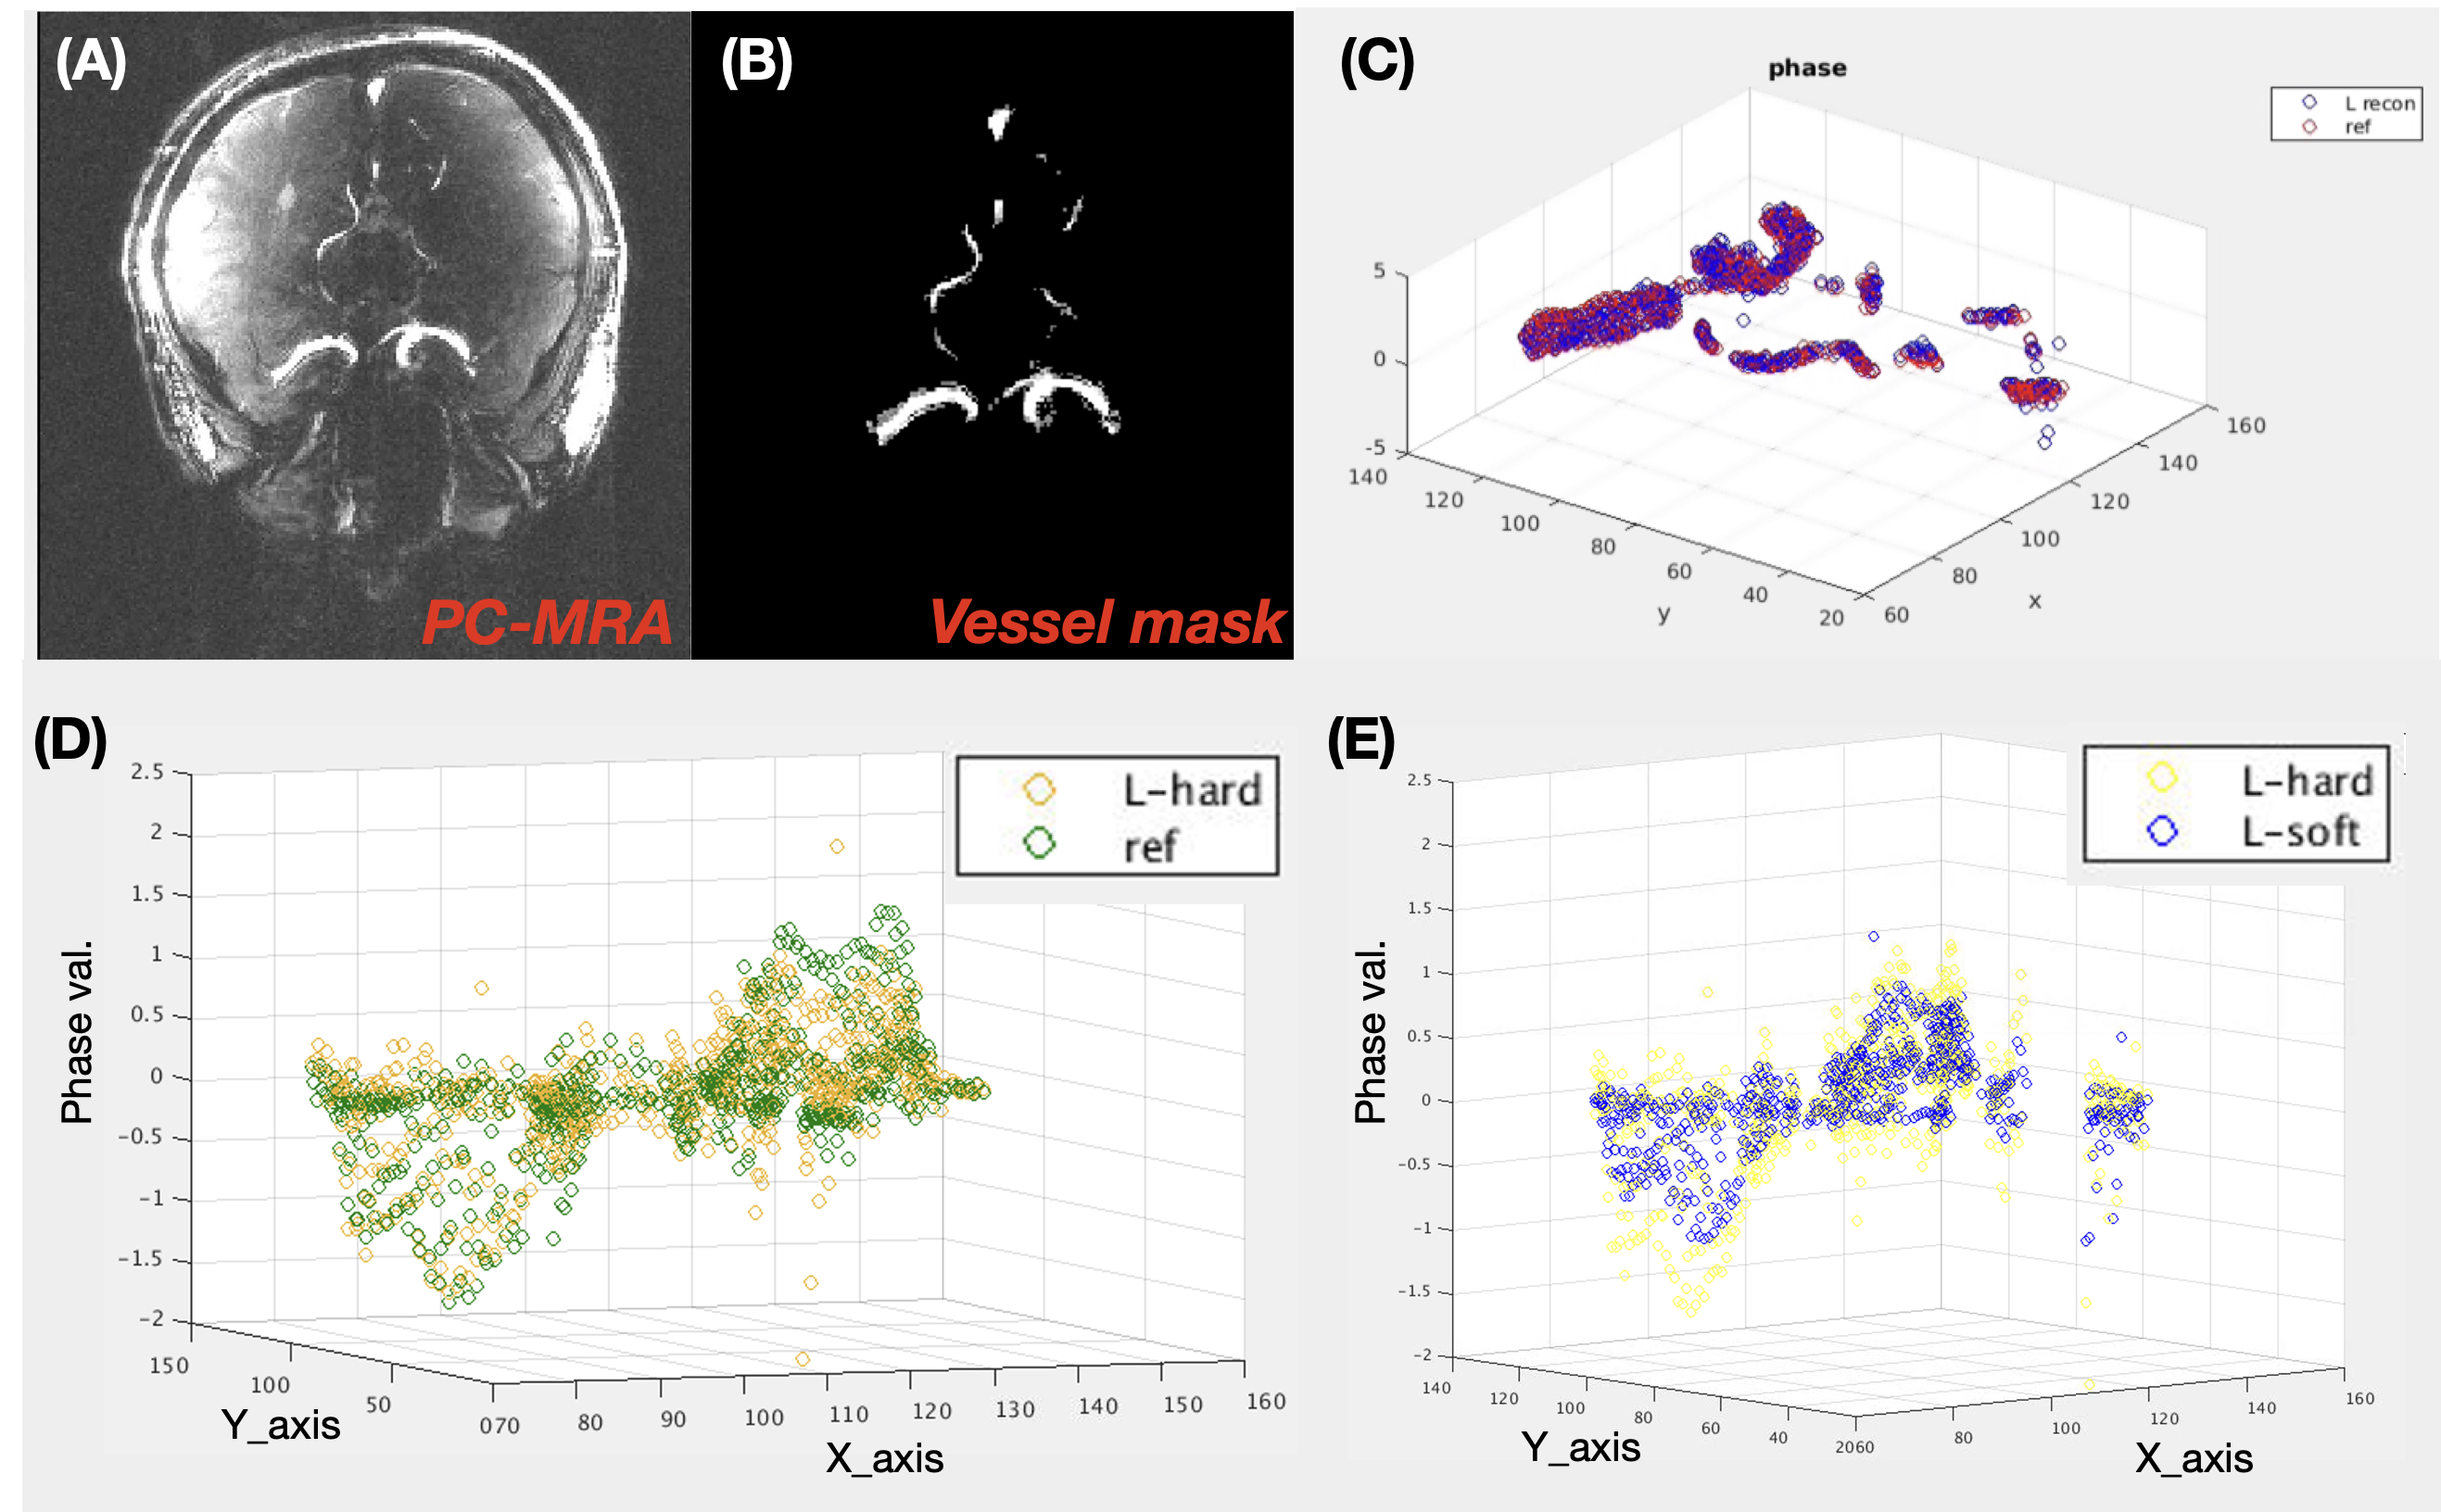
Figure 3. Scatter plot of the reconstructed phase value within the vessel ROI. (A-C) displays the process of 3D scatter generation. (D) shows that the reconstructed phase value using hard-threshold is in good agreement with the fully sampled reference, however, (E) reveals that the soft-threshold approach underestimated the 4D flow phase significantly.

Table 1 & Table 2. The averaged magnitude or phase error was calculated within the vessel region.
DOI: https://doi.org/10.58530/2022/4710