4709
Experimental study on intracranial gadolinium deposition in rats after linear conversion to macrocyclic gadolinium contrast agent1ningxia medical university, yinchuan, China, 2Ningxia Medical University General Hospital, yinchuan, China, 3GE Healthcare, Beijing, China
Synopsis
To investigate the changes of intracranial gadolinium deposition in rats with linear gadolinium deposition after continuous injection of large ring gadolinium contrast agent. The intracranial gadolinium deposition in these rats increased but was relatively small. The DCN T1 value measured on MRI ensemble sequence scan images was significantly negatively correlated with gadolinium concentration in cerebellar DCN. (ALL P values were less than 0.05).
Summary of Main Finding
In rats with linear gadolinium deposition, continuous use of macrocyclic GBCAs, gadoterate meglumine and gadobutrol has less intracranial gadolinium deposition than continuous use of linear GBCAs and is relatively safe.Introduction
In recent years, a number of human and animal experimental studies have shown that after repeated administration of linear GBCAs, the T1WI of deep cerebellar nucleus(DCN) presents high signal intensity and gadolinium deposition in organs [1-3]. Gadolinium deposition in brain tissues is significantly different after administration of different types of GBCAs [2-4]. DCN T1WI images of rats injected with macrocyclic GBCAs showed no significantly increased signal and significantly lower intracerebral gadolinium concentration [4].Currently, there are few reports on gadolinium deposition after receiving linear GBCAs followed by macrocyclic GBCAs. In this study, the DCN T1 relaxation and the gadolinium concentration in cerebellum of rats with linear gadolinium deposition model were prospectively evaluated in animal models after repeated administration of macrocyclic GBCAs (gadoterate meglumine and gadobutrol),along with HE staining section of cerebellum, aim to provide a reference for the selection of GBCAs in patients with linear gadolinium deposition in the brain.
Material and Methods
28 male SD rats were injected with gadolinium diamine (linear gadolinium contrast agent) for 20 times (4 times/week, 5 weeks in total, dose of 0.06mmol/kg). After the linear gadolinium deposition model was established, DCN tissues were extracted from 5 randomly selected rats after euthanasia. Rest rats were randomly divided into 4 groups and underwent another 20 times contrast injection of Gadolinium diamine (linear), gadoterate meglumine (macrocyclic), gadobutrol (macrocyclic) and hyperosmotic saline (1350 mOsm/kg) respectively, with the same injection frequency and dose as before. Brain MRI scan was performed before the first injection and in a weekly basis here after till the last injection, on a 3.0T MR scanner (Signa Architect, GE Healthcare) with a dedicated 8-channel rat coil. T1 relaxation value of DCN was derived from synthetic MRI using the magnetic resonance image compilation(MAGiC) with a multiecho and multidelay acquisition. Detailed scan parameters are as follow: (T1WI(FSE sequence) : TR=470ms, TE=10ms; T2WI(FSE sequence) : TR=2500ms, TE=85ms) and MAGiC sequence (TR=4000ms, TE=21.4/85.4ms).Horizontal axial scanning, each sequence collected 12 layers, layer thickness 2mm, spacing 0.2mm, matrix 128×128, FOV: 8.0×8.0mm. ). The rats were sacrificed in batches at the 10th weeks to extract the tissues, and the gadolinium concentration of cerebellum DCN was determined by inductively coupled plasma mass spectrometry (ICP-MS). The cerebellum HE staining section was observed and analyzed. The DCN T1 value was measured in MRI images, and the numerical differences at each time point were analyzed by ANOVA. Kruskal-wallis was used to test the difference of gadolinium concentration in cerebellar DCN tissues.Results
Of the 28 rats, 25 completed the experiment. 2 rats (W3, W5) died of anesthesia complications, and 1 rat (W4) died of caudal vein infection. Brain MRI of rats injected with Gadolinium diamine in the first five weeks, DCN T1 signal increased significantly after accumulative 12 injections(Figure 1),after grouping,DCN T1 signals in the Gadolinium diamine group were continuously and progressively increased , while no significant sustained increase was observed in the other groups (Figure 2).The DCN T1 value in gadolinium diamine group (595.50±20.96ms) was significantly lower than that in other groups (Figure 3),Gadolinium concentration (2.25±0.14ug/g) in gadolinium diamine group were significantly higher than those in other groups (Figure 4). (ALL P values were less than 0.05).No obvious abnormalities in the structure and morphology of most neurons in HE staining sections (X200) of DCN(Figure 5).
Discussion and Conclusion
The result of this study showed that T1 value of DCN continue to decrease after injection of linear GBCAs, which is consistent with the results of previous studies [5]. T1 shortening is also reflected in T1 weighted images, in which DCN signal hyperintensity can be visually observed at the third week in the first five weeks of linear gadolinium deposition modeling rats (Figure 1). In the second five weeks period, the DCN T1 value of the linear GBCAs group was much lower than that of the macrocyclic group and the hyperosmotic saline. And T1 values of macrocyclic group and the hyperosmotic saline group do not differ significantly. These results indicate that, continuous macrocyclic GBCAs injection, followed to linear GBCAs injection, will not worsen gadolinium deposition. ICP-MS result at the end of 10th week supported this statement. One interesting finding in our study is that, for macrocyclic group and the hyperosmotic saline group, at the end of 10th week, the T1 values have been recovered to the level of their initial pre-injection. However, ICP-MS results still revealed significant gadolinium concentration. This mis-match raise the concern of under estimation of macrocyclic GBCAs concentration purely by T1 value. Furthermore, the HE staining sections of the DCN region of the rat cerebellum indicated that there is no related pathological lesions in the brain, suggesting the conversion from linear GBCAs to macrocyclic GBCAs is relatively safe.Limitations of this study :(1)The detection level of trace element gadolinium is expected to be significantly reduced at the dose and frequency of GBCAs received by clinical patients. Further research designed with a lower dose and longer follow up time is needed.(2) Although gadolinium deposition in brain does not appear to be related to neurological histopathological injury, the subsequent physiological significance and ultimate clinical significance are unknown, and further research in this area is still needed.
To conclude, continuous macrocyclic GBCAs injection, followed to linear GBCAs injection, will not increase gadolinium deposition. There might be under estimation of macrocyclic GBCAs concentration purely by T1 value.
Acknowledgements
References
[1]Ozturk Kerem,Nascene David. Dentate nucleus signal intensity changes on T1-weighted MRI after repeated administrations of linear and macrocyclic gadolinium-based contrast agents: a pediatric intraindividual case-control study.[J]. Acta radiologica (Stockholm, Sweden : 1987),2021,{4}{5}.
[2]Minaeva Olga,Hua Ning,Franz Erich S,et al. Nonhomogeneous Gadolinium Retention in the Cerebral Cortex after Intravenous Administration of Gadolinium-based Contrast Agent in Rats and Humans.[J]. Radiology,2020,294(2).
[3] T1 signal intensity in the dentate nucleus after the administration of the macrocyclic gadolinium-based contrast agent gadoterate meglumine: an observational study.[J]. Radiologia,2020,{4}{5}.
[4]Robert P, Violas X, Grand S, et al. Linear Gadolinium-Based Contrast Agents Are Associated With Brain Gadolinium Retention in Healthy Rats[J]. Investigative radiology,2016,51(2):73-82.
[5]Jost G, Lenhard DC, Sieber MA, et al. Signal increase on unenhanced T1 -weighted images in the rat brain after repeated, extended doses of gadolinium-based contrast agents: comparison of linear and macrocyclic agents [J]. Invest Radiol, 2016, 51(2):83-89.
[6]McDonald Robert J,McDonald Jennifer S,Dai Daying,et al. Comparison of Gadolinium Concentrations within Multiple Rat Organs after Intravenous Administration of Linear versus Macrocyclic Gadolinium Chelates.[J]. Radiology,2017,285(2):
Figures
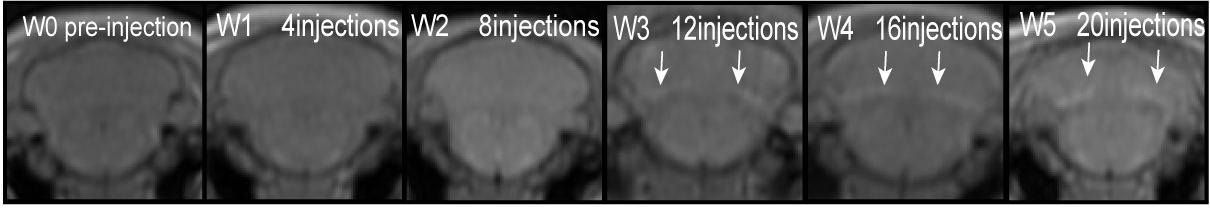
Figure 1. Brain T1WI MRI of rats injected with Gadolinium diamine in the first five weeks, and DCN signal increased significantly after accumulative 12 injections (arrow), and showed a sustained and significant high signal as the accumulative dose increased(arrow).
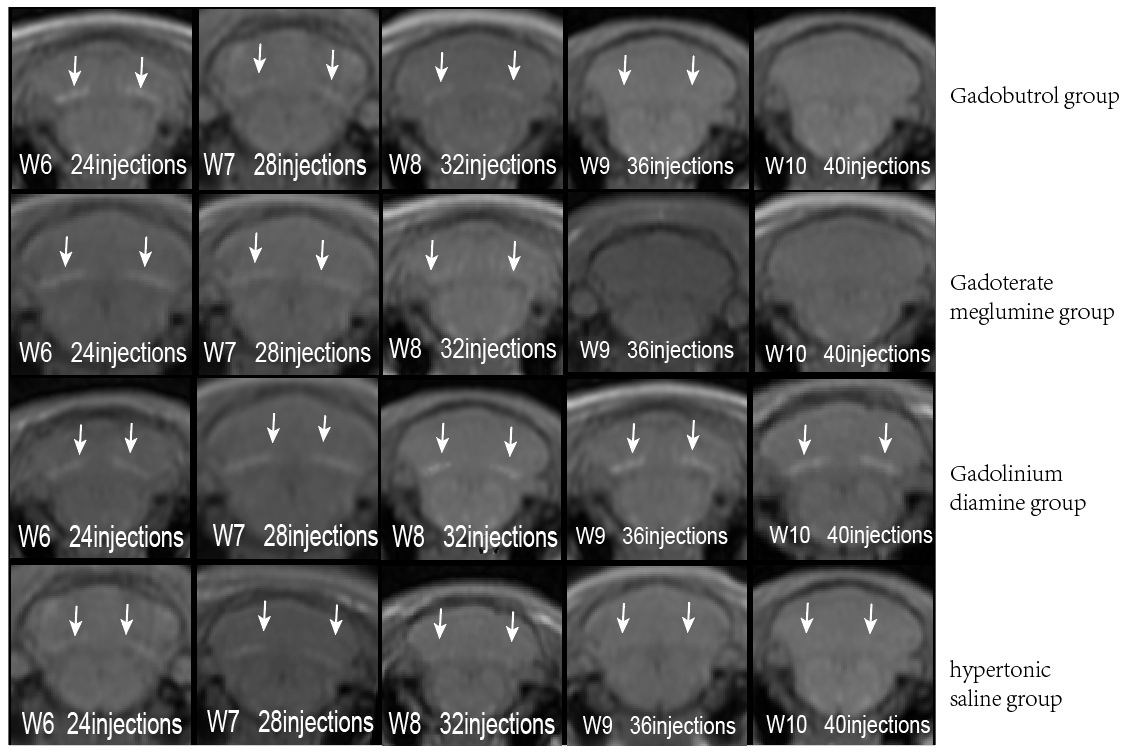
Figure 2. Brain T1WI MRI images of rats after the last 5 weeks of grouping. DCN signals in the Gadolinium diamine group were continuously and progressively increased (arrow), while no significant sustained increase was observed in the other groups.
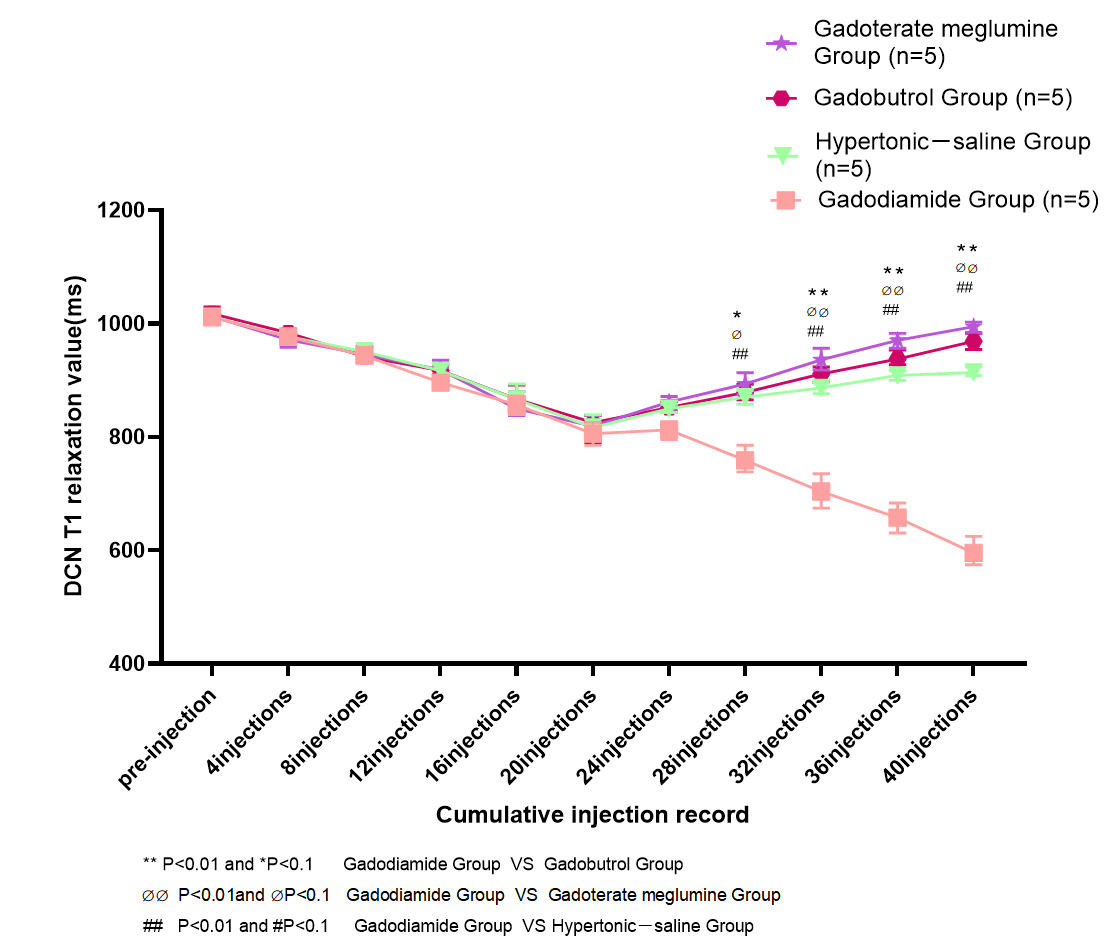
Figure 3. Changes of DCN T1 relaxation in rats between different groups with cumulative dose injection.
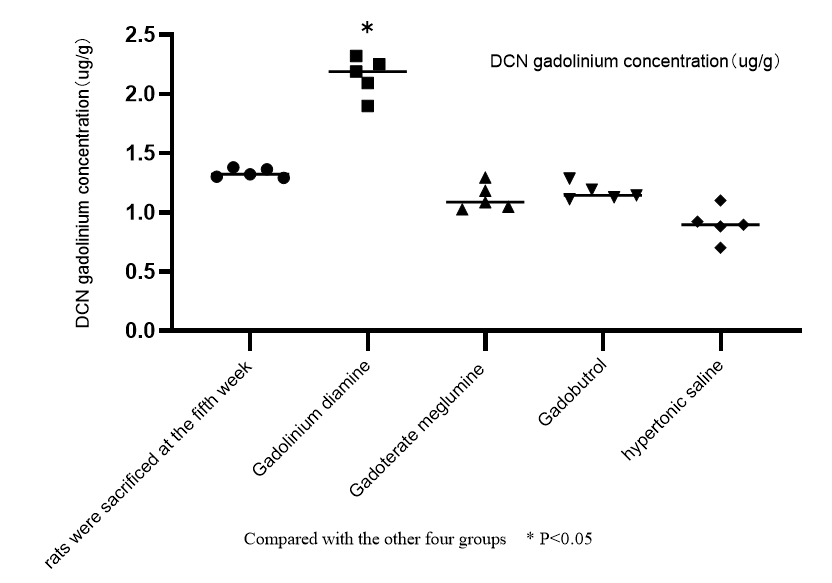
Figure 4. DCN gadolinium concentration of rats in each group,Gadolinium diamine group was significantly higher than other groups
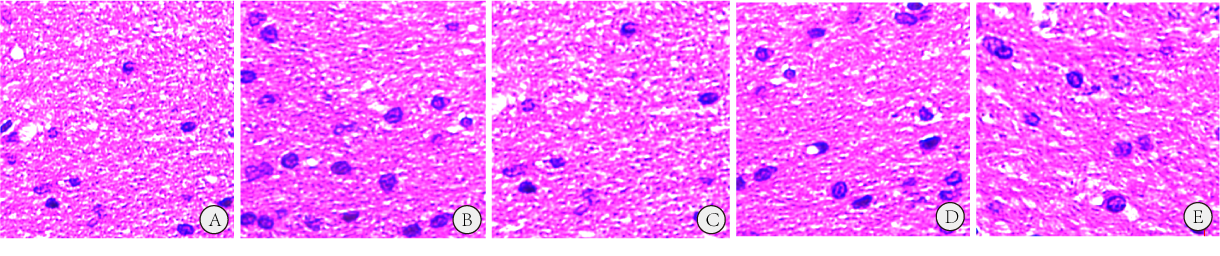
Figure 5. A-E shows HE staining sections (X200) of DCN region of rats sacrificed at the fifth week, gadolinium diamine group, gadoterate meglumine group, gadobutrol group and hypertonogenic saline group, showing no obvious abnormalities in the structure and morphology of most neurons.