4708
Quantitative magnetic resonance imaging in gadolinium deposition in rat brain1ningxia medical university, yinchuan, China, 2Ningxia Medical University General Hospital, yinchuan, China, 3GE Healthcare, Beijing, China
Synopsis
To investigate the application of quantitative magnetic resonance imaging in the quantitative measurement of gadolinium deposition in the deep cerebellar nucleus (DCN) of rats.The absolute correlation coefficients between DCN T1 value and DCN gadolinium concentration, and DCN/ cerebrar cortex T1WI signal intensity ratio and DCN gadolinium concentration were 0.925 (P<0.001) and 0.849 (P<0.001).These results suggest that quantitative magnetic resonance imaging has a good expression of T1 relaxation time in the dentate nucleus region of cerebellum, which provides a basis for quantitative magnetic resonance estimation of clinical gadolinium deposition.
Summary of Main Findings
Synthetic MRI using the magnetic resonance image compilation (MAGiC) has a good expression of T1 relaxation time in the deep cerebellar nucleus (DCN) region of cerebellum of rats, which provides a certain basis for the quantitative magnetic resonance evaluation of gadolinium deposition in clinical practice.Introduction
Gadolinium -based Contrast Agent (GBCAs) has been widely used to detect tumors and inflammation in MRI enhancement. Recent experimental studies have shown that after repeated administration of linear GBCAs, T1-weighted image (T1WI) of deep cerebellar nucleus (DCN) signal in healthy rats increased significantly, indicating gadolinium deposition in cerebellum [1-4]. The signal intensity of T1WI is qualitative by its nature and can be influenced by scan parameters and equipment hardware configurations. Recently proposed synthetic MRI using the magnetic resonance image compilation (MAGiC) with a multiecho and multidelay acquisition method can simultaneously quantify tissues’ intrinsic magnetic properties and investigate all of the measures in a practically acceptable scan time. For MAGiC, signals from each slice are acquired with different echo time and saturation delay in an interleaved way. Assuming that monoexponential relaxations happen among those echos and saturation delays, tissues’ T1, T2, and PD can be retrieved by a least square fit on the signal intensity of those images.In this study, the DCN T1 value and the T1WI signal ratio of DCN/ cerebellar cortex were measured in rat models with continuous GBCAs gadolinium diamine injection. The concentration of DCN gadolinium in cerebellar cortex was determined by inductively coupled plasma mass spectrometry (ICP-MS). Correlation analysis of gadolinium concentration was conducted both with DCN T1 value from MAGiC and T1 signal intensity ratio of DCN/ cerebellar cortex from traditional T1WI. The purpose of this study is to evaluate the accuracy of quantifying gadolinium concentration by T1 value from the MAGIC sequence, and its performance compare to traditional signal intensity approach.
Material and Methods
21 male SD rats were injected with gadolinium diamine solution through tail vein 20 times (4 times/week, total 5 weeks, dose of 0.06mmol/kg); 5 rats were randomly selected for euthanasia to extract the cerebrum DCN tissue for ICP-MS to determine the concentration of gadolinium. The remaining rats were randomly divided into two groups :(1) gadolinium diamine group, who underwent another round of 20 times injections with same injection frequency and dose of gadolinium diamine;(2) No intervention control group, with no other intervention measures except normal feeding. Brain MRI scans were performed on all rats before the first injection and weekly after injection, on a 3.0T MR scanner (Signa Architect, GE Healthcare) with a dedicated 8-channel rat coil. Imaging sequence include traditional T1WI (T1WI (FSE sequence) : TR=470ms, TE=10ms; T2WI(FSE sequence) : TR=2500ms, TE=85ms) and MAGiC sequence (TR=4000ms, TE=21.4/85.4ms).Horizontal axial scanning, each sequence collected 12 layers, layer thickness 2mm, spacing 0.2mm, matrix 128×128, FOV: 8.0×8.0mm. Immediately after the last MRI scan, the rats were sacrificed for tissue extraction and the concentration of DCN gadolinium in cerebellum was determined by ICP-MS. The T1 value of DCN and the T1WI signal ratio of DCN/ cerebellar cortex were measured on vendor provided advanced workstation (AW4.7, GE Healthcare). The difference between the T1 value of DCN and the T1WI signal ratio of DCN/ cerebellar cortex at each time point between the two groups was analyzed by ANOVA. Spearman correlation coefficient was used to evaluate the correlation between DCN T1 value and cerebellar DCN gadolinium concentration, and DCN/ cerebellar cortex T1WI signal ratio and cerebellar DCN gadolinium concentration.Results
Of the 21 included rats, 19 rats completed the experiment.1 rat (W2) died of anesthesia complications and 1 rat (W4) died of caudal vein infection.At week 3 (after cumulative 12 injections), the MRI images of rats showed significant high T1 signal in the DCN region, which was more obvious at week 4 and 5 (Figure 1). After grouping, there was no continuously increasing T1 high signal in the DCN region of the control group (Figure 2). With gadolinium diamine injection, T1 signal intensity in the DCN region increased and T1 relaxation value decreased (Figure 3). The absolute correlation coefficients between DCN T1 value and DCN gadolinium concentration, and between DCN/ cerebrar cortex T1WI signal intensity ratio and DCN gadolinium concentration were 0.925 (P<0.001) and 0.849 (P<0.001) respectively (Figure 4).Discussion and Conclusion
In this study, DCN T1 values were gradually decreased in rats receiving linear GBCAs gadolinium diamine during the first five weeks, suggesting gadolinium deposition in the brain, which was consistent with Kanda et al[5-6]; In previous studies, the DCN signal intensity of rats was decreased after GBCAs injection without intervention, but gadolinium deposition in tissues was not completely disappeared [7]. Our conclusion was consistent with this.In this study, MAGiC was used to quantify the DCN T1 value of rats. Our results showed that the correlation coefficient between DCN T1 value and DCN gadolinium concentration in rats was -0.925 (< 0.001), the correlation coefficient between DCN/ cerebellar cortex T1WI signal intensity ratio and DCN gadolinium concentration was 0.849 (P<0.001). The correlation coefficient between DCN T1 value and DCN gadolinium concentration in rats was statistically significant and the absolute value was higher, suggesting the superiority of T1 value from MAGiC in quantifying gadolinium concentration over traditional signal intensity ratio approach.
To conclude, quantitative T1 value in deep cerebellar nucleus of rat demonstrated strong correlation with gadolinium concentration induced by continuous injection of gadolinium diamine. The correlation coefficient between T1 value and gadolinium concentration is higher than that between T1 signal intensity ratio and gadolinium concentration.
Acknowledgements
No acknowledgement found.References
[1] Layne Kerry A,Raja Kishor,Dargan Paul I,Wood David M. Gadolinium Concentrations in Biological Matrices From Patients Exposed to Gadolinium-Based Contrast Agents.[J]. Investigative radiology,2021,56(7).
[2] Ozturk Kerem,Nascene David. Dentate nucleus signal intensity changes on T1-weighted MRI after repeated administrations of linear and macrocyclic gadolinium-based contrast agents: a pediatric intraindividual case-control study.[J]. Acta radiologica (Stockholm, Sweden : 1987),2021,{4}{5}:.
[3] Minaeva Olga,Hua Ning,Franz Erich S,Lupoli Nicola,Mian Asim Z,Farris Chad W,Hildebrandt Audrey M,Kiernan Patrick T,Evers Laney E,Griffin Allison D,Liu Xiuping,Chancellor Sarah E,Babcock Katharine J,Moncaster Juliet A,Jara Hernan,Alvarez Victor E,Huber Bertrand R,Guermazi Ali,Latour Lawrence L,McKee Ann C,Soto Jorge A,Anderson Stephan W,Goldstein Lee E. Nonhomogeneous Gadolinium Retention in the Cerebral Cortex after Intravenous Administration of Gadolinium-based Contrast Agent in Rats and Humans.[J]. Radiology,2020,294(2):.
[4] T1 signal intensity in the dentate nucleus after the administration of the macrocyclic gadolinium-based contrast agent gadoterate meglumine: an observational study.[J]. Radiologia,2020,{4}{5}:.
[5] KANDA T , OBA H,TOYC)DA K ,e t al. Brain gadolinium deposition after administration of gadolinium- based contrast agents[J].Radiology, 2016,34(1 ) .
[6] Bussi Simona,Coppo Alessandra,Celeste Roberto,Fanizzi Antonello,Fringuello Mingo Alberto,Ferraris Andrea,Botteron Catherine,Kirchin Miles A,Tedoldi Fabio,Maisano Federico. Macrocyclic MR contrast agents: evaluation of multiple-organ gadolinium retention in healthy rats.[J]. Insights into imaging,2020,11(1).
[7] Robert Philippe,Lehericy Stéphane,Grand Sylvie,Violas Xavier,Fretellier Nathalie,Idée Jean-Marc,Ballet Sébastien,Corot Claire. T1-Weighted Hypersignal in the Deep Cerebellar Nuclei After Repeated Administrations of Gadolinium-Based Contrast Agents in Healthy Rats: Difference Between Linear and Macrocyclic Agents.[J]. Investigative radiology,2015,50(8):
Figures
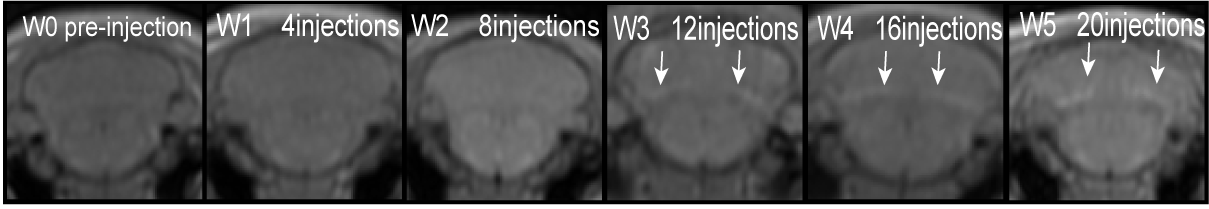
Figure 1: DCN signal increased significantly after 12 cumulative doses of GADolinium diamine (arrow) and remained significantly higher as the cumulative dose increased (arrow)
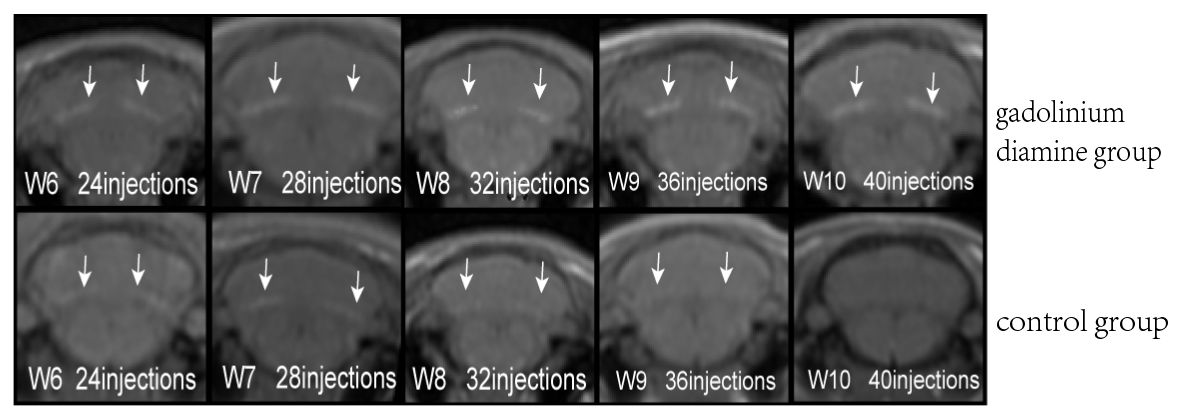
Figure 2. Brain T1WIMRI images of rats after grouping. DCN signal was continuously and progressively increased in the gadolinium diamine group (arrow), while no significant sustained increase was observed in the control group.
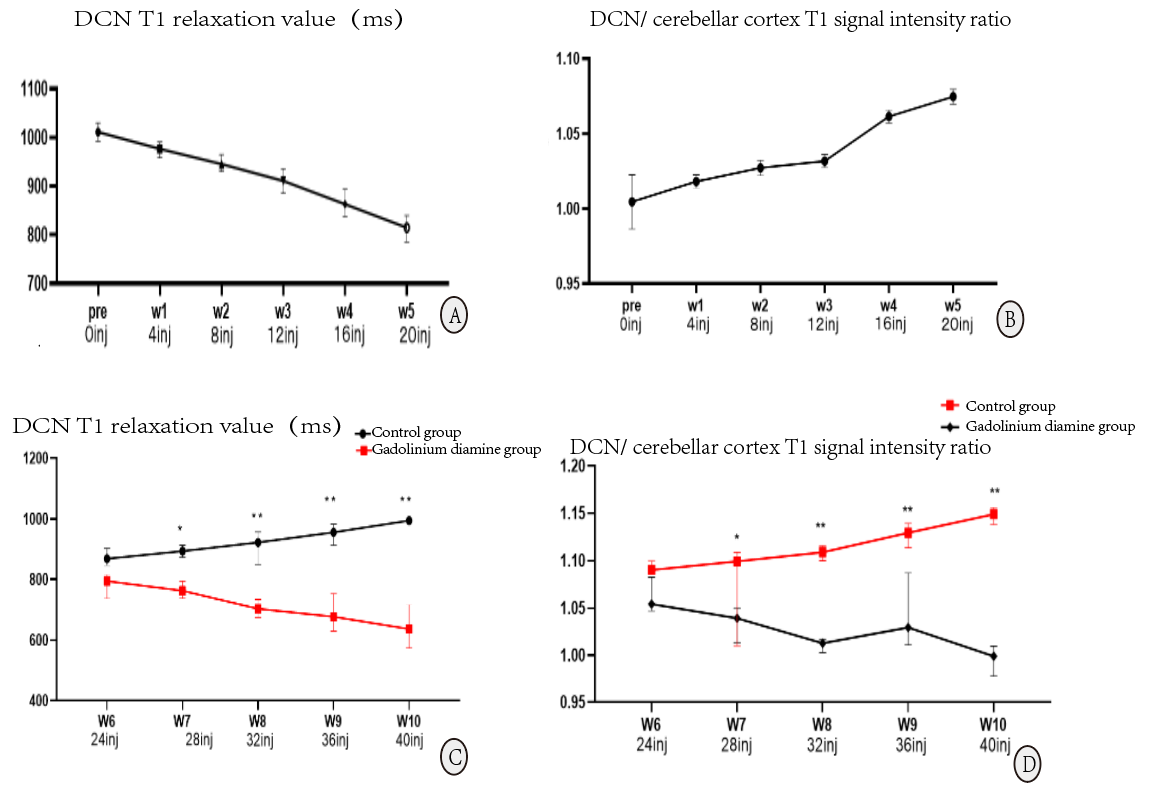
Figure 3.A-D were the changes of DCN T1 relaxation value and DCN/ cerebellar cortex T1 signal ratio with the dose of injection in the first and last 5 weeks respectively. DCN T1 relaxation decreased and DCN/ cerebellar cortex T1 signal ratio increased with continuous administration of gadolinidiamine, while no trend like that was observed in the non-intervention control group.
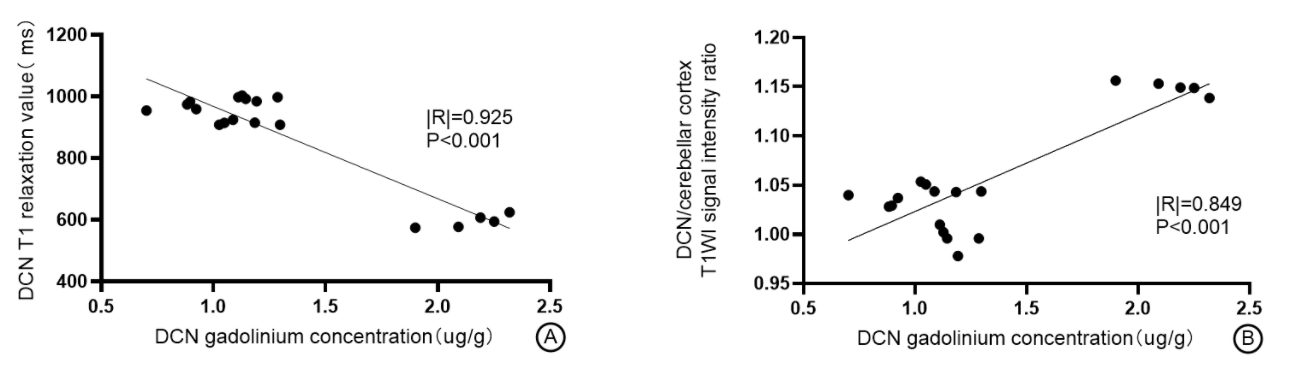
Figure 4. A-B are respectively DCN T1 relaxation value, scatter diagram of correlation analysis between DCN/ Cerebellar Cortex T1WI signal ratio and DCN Gadolinium concentration. The absolute value of the correlation between DCN T1 value and DCN gadolinium concentration was 0.925, Significantly greater than 0.849 (values in figure B)