4707
Inter-subject variability in global diffusivity metrics degrades cross-sectional statistics1NCNED, Griffith University, Southport, QLD, Australia
Synopsis
Diffusion metrics from brain Diffusion Tensor Imaging (DTI) characterise axonal structure and include fractional anisotropy (FA), axial diffusivity (AD) and radial diffusivity (RD). Cross-sectional studies of DTI metric maps apply voxel-based statistical analysis of the metric values generated by standard MRTrix and FSL algorithms and assumes that the global values for these metrics are consistent across the populations analysed. This study found that inter-subject global levels vary appreciably for the full range of diffusion metrics. Removal of the variance associated with the global levels markedly improved the statistical inference for differences in a study of ME/CFS patients and healthy controls.
Introduction
Cross-sectional DTI studies have demonstrated limited differences in diffusion metrics between ME/CFS and healthy controls (HC) 1. We use that study to investigate inter-subject variability in global levels and the influence on statistical inference of removing this variance.Methods
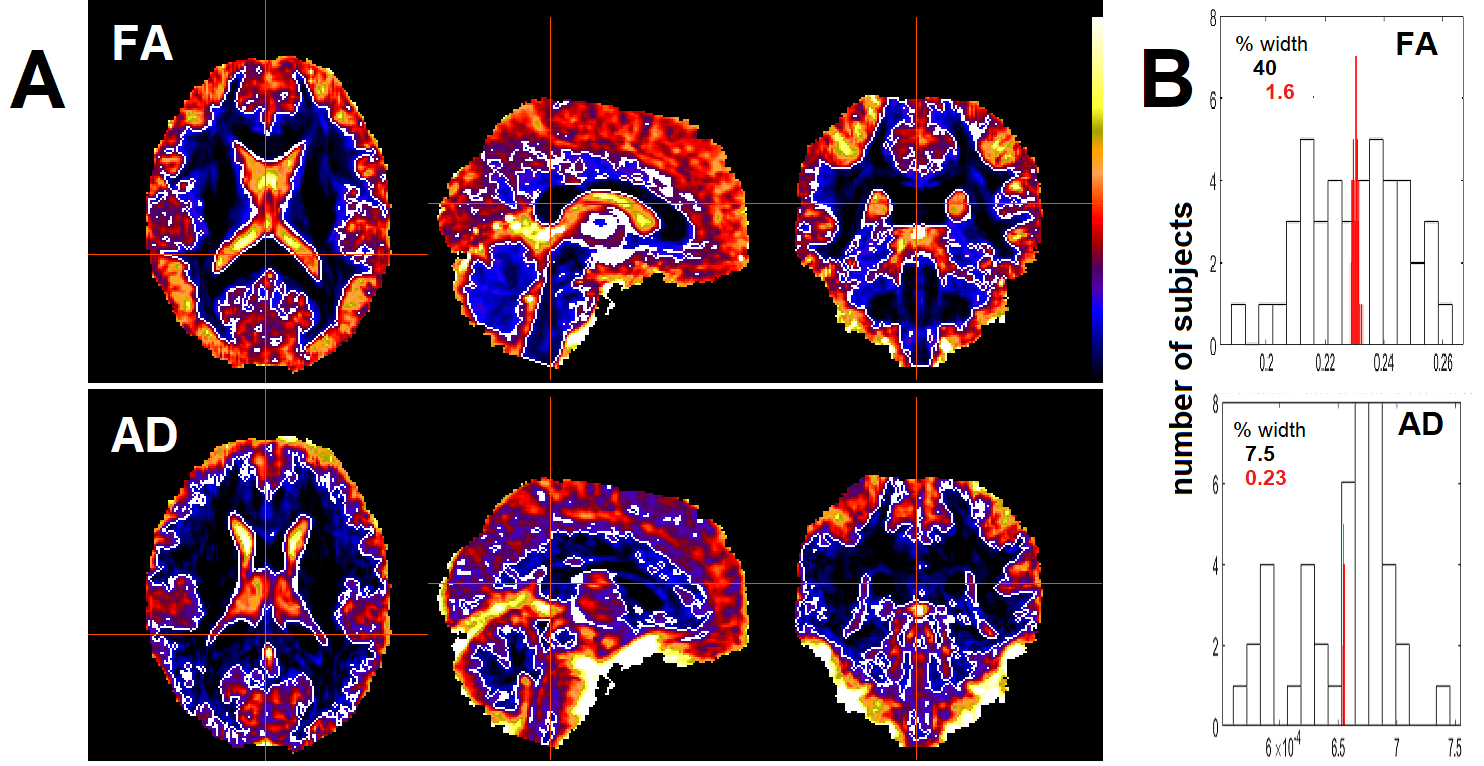
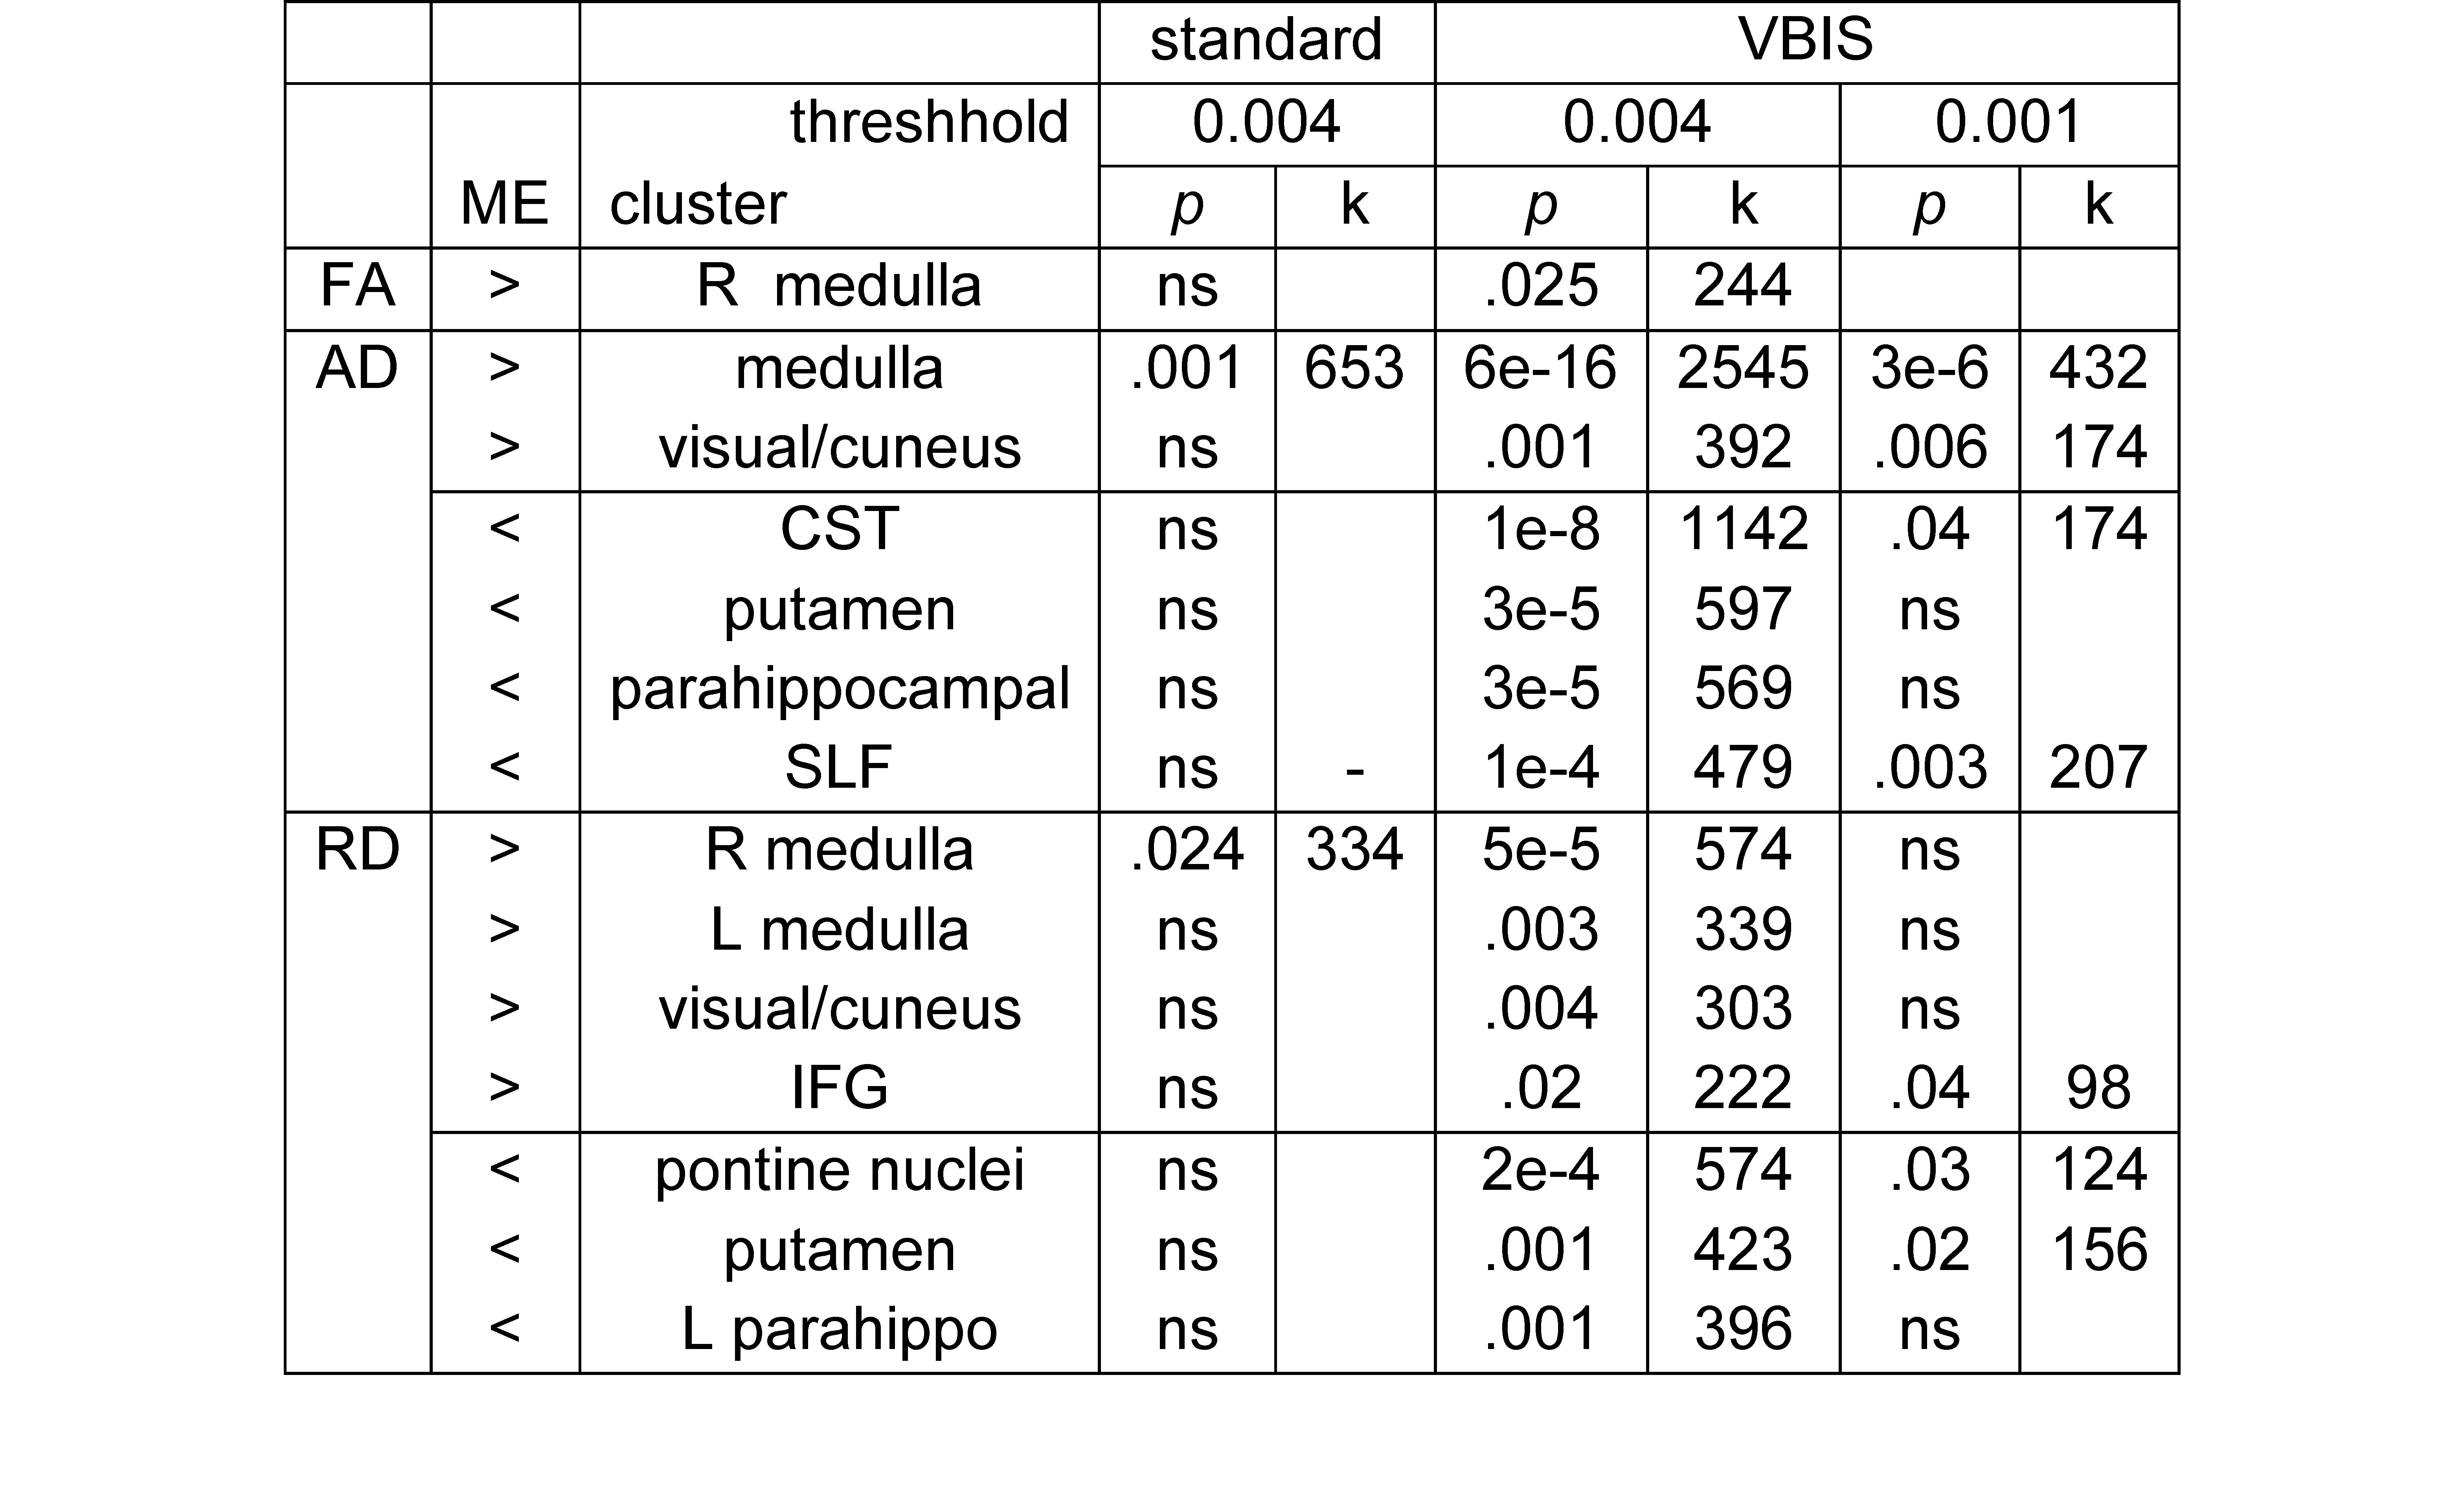
The study was approved by the local human ethics (HREC/15/QGC/63 and GU:2014/838) committee of Griffith University and the Gold Coast University Hospital where scanning was performed. Written informed consent was obtained from 18 ME/CFS patients, meeting ICC criteria, and 26 gender-matched healthy controls. Voxel-based group comparisons were performed with SPM12 (https://www.fil.ion.ucl.ac.uk/spm/software/spm12/). To report representative findings, we only consider FA, AD and RD and pool the ME/CFS and HC subjects (reported differences were small1). After the standard analysis, we applied the Voxel Based Iterative Sensitivity (VBIS) algorithm 2 to compute the population variance for each voxel and define a region-of-interest as those voxels with variance below the median. Figure 1A shows maps of the population variance for FA and AD and the white boundary indicates the median variance which defined the region-of-interest. We computed the mean in that region for all subjects and incorporated it as a global value nuisance covariate in a repeat voxel-based comparison of the two groups. Residual images were assessed to quantify the new global levels. Distribution of global values before and after exclusion of global variance was quantified by fitting the distribution to a Gaussian and computing FWHM/mean %.Results
Figure 1A shows that the voxel variance was greatest in Gray Matter and CSF for both FA and AD. The region where variance < median was mostly white matter. Similar results were found for RD and other metrics. Figure 1B shows frequency of occurrence histograms for global values in the 44 subjects and include the width of the histograms (from the fitted gaussian) as a percentage of the mean. For FA the distribution width was 40% for standard analysis but fell to 1.6% after removing variance associated with the global value. For AD the widths were 7.5% and 0.23% and for RD 8.4% and 1.0%.Discussion
We estimated global levels for 44 subjects of 3 diffusivity metrics using the VBIS approach 2. A remarkable intersubject variability - up to 40% - in global levels was detected in all diffusivity metrics, although here we only report results for three (two in Fig 1B). Controlling for these levels in a comparison of ME/CFS and HC subjects markedly improved statistical inference. We must therefore question whether the internal normalization techniques of the MRTrix and FSL algorithms are adequate. This analysis was based on the assumption that axonal diffusivity properties will be similar across individual humans.Conclusion
Standard cross-sectional voxel-based comparisons of diffusivity metrics are affected by a surprisingly large inter-subject variability in their global levels. Controlling for this variability dramatically enhances statistical inference.Acknowledgements
We thank the patients and healthy controls who donated their time and effort to participate in this study. This study was supported by the Stafford Fox Medical Research Foundation, the Judith Jane Mason Foundation (MAS2015F024), Mr. Douglas Stutt, and the Blake-Beckett Foundation. The financial support did not affect any aspect of the study.References
1. Thapaliya, K., Marshall-Gradisnik, S., Staines, D. & Barnden, L. Diffusion tensor imaging reveals neuronal microstructural changes in myalgic encephalomyelitis/chronic fatigue syndrome. Eur. J. Neurosci. 54, 6214–6228 (2021).
2. Abbott, D. F., Pell, G. S., Pardoe, H. & Jackson, G. D. Voxel-Based Iterative Sensitivity (VBIS): methods and a validation of intensity scaling for T2-weighted imaging of hippocampal sclerosis. NeuroImage 44, 812–819 (2009).
Figures