4704
Metabolic timecourse of healthy aging1Departments of Radiology, Shandong Provincial Hospital Affiliated to Shandong First Medical University, Jinan, Shandong, 250021, China, Jinan, China, 2Departments of Radiology, Shandong Provincial Hospital, Cheeloo College of Medicine, Shandong University, Jinan, Shandong, 250021, China, Jinan, China, 3The Russell H. Morgan Department of Radiology and Radiological Science, Johns Hopkins University School of Medicine, Baltimore, MD, USA, Baltimore, MD, United States, 4F.M. Kirby Research Center for Functional Brain Imaging, Kennedy Krieger Institute, Baltimore, MD, USA, Baltimore, MD, United States, 5Center for Cognitive Aging and Memory, University of Florida, Gainesville, FL, USA, Gainesville, FL, United States, 6McKnight Brain Research Foundation, University of Florida, FL, USA, Gainesville, FL, United States, 7Department of Clinical and Health Psychology, University of Florida, Gainesville, FL, USA, Gainesville, FL, United States, 8Department of Neurobiology and Behavior, University of California, Irvine,USA., Irvine, CA, United States, 9Department of Applied Physiology and Kinesiology, University of Florida, Gainesville, FL, USA, Gainesville, FL, United States, 10Philips Healthcare, Shanghai, China, Shanghai, CA, China
Synopsis
The metabolic timecourse of healthy aging is not well-established, in part due to diversity of quantification methodology. This study recruited a large structured cross-sectional cohort throughout adulthood to investigate metabolic changes as a function of age, and applied consensus-recommended quantification methods. Positive age correlations in tCho, tCr, and mI were observed for CSO and PCC, while none was found for tNAA, Glu or Glx in either region. PCC GABA decreased with age, CSO Scyllo increased, and we observed higher PCC Scyllo for female subjects. Our results establish a metabolic timecourse of healthy aging, as a normative foundation for future work.
Introduction
The concentration of endogenous metabolites can be measured by magnetic resonance spectroscopy (MRS) in vivo, but the MRS-aging literature is inconsistent, due to diverse methodological approaches, in terms of study design, acquisition, and quantification. In this study, a large structured cross-sectional cohort of male and female subjects throughout adulthood was recruited to investigate metabolic changes as a function of age, using consensus-recommended quantification methods.Methods
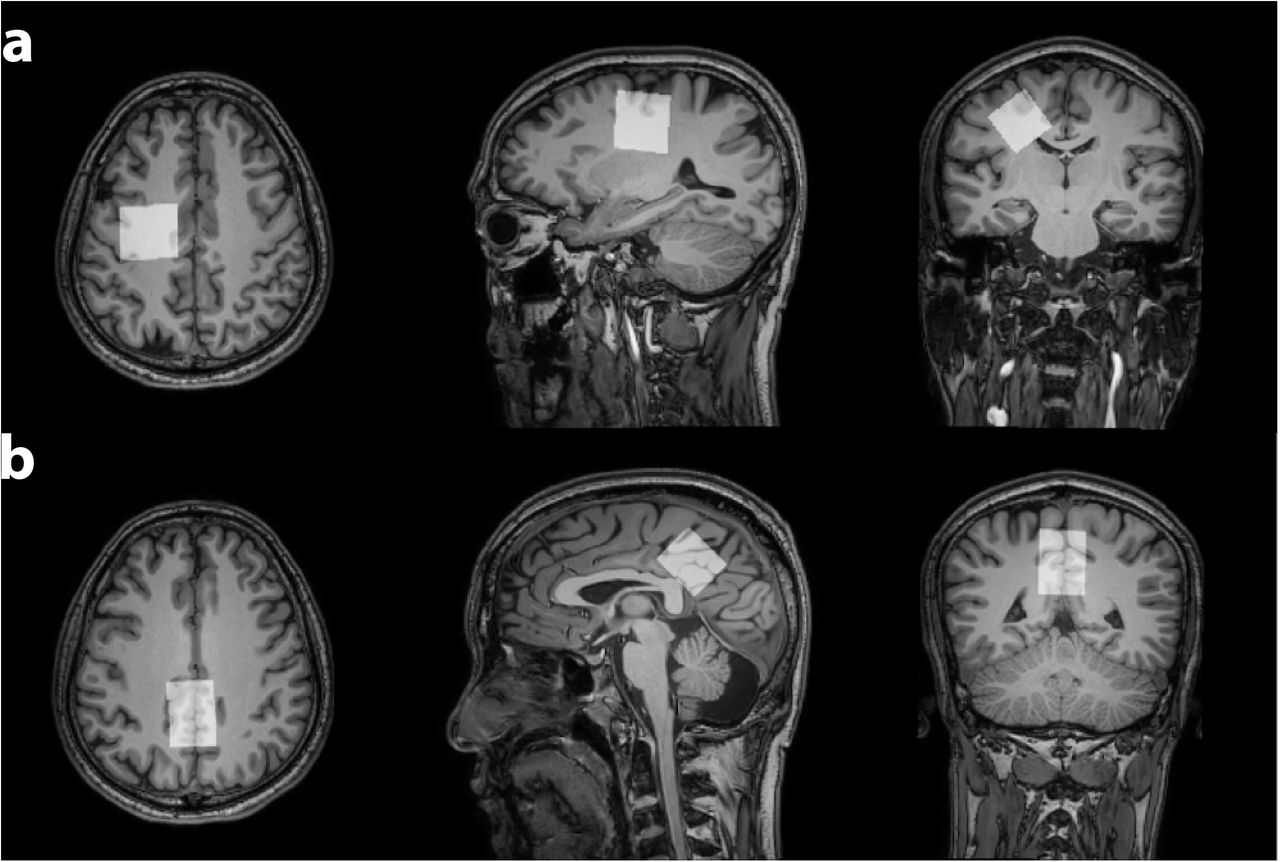
102 healthy volunteers were recruited with IRB approval including approximately equal numbers of male and female participants in each decade of age from the 20s, 30s, 40s, 50s, and 60s. Data were acquired on a 3T MRI scanner (Ingenia CX, Philips Healthcare). MRS acquisition was preceded by a T1-weighted MPRAGE (TR/TE/ 6.9/3.2 ms; FA 8°) with 1 mm3 resolution for voxel positioning and segmentation. Metabolite spectra were acquired using PRESS localization (1.3 kHz refocusing bandwidth) with: TR/TE = 2000/30 ms; 30×26×26 mm3 voxels in the centrum semiovale (CSO) and posterior cingulate cortex (PCC), as shown in Figure 1; 96 transients sampled at 2 kHz; VAPOR1 water suppression. Water-suppressed spectra were modeled using the Osprey algorithm2, employing a basis set of 18 simulated metabolite basis functions and a cohort-mean measured macromolecular (MM) spectrum3 . Water-referenced metabolite concentrations were calculated according to a previous study4, adjusting for tissue-specific water visibility and relaxation based on literature values5 for each segmented tissue fraction.All statistical analyses were performed using R (Version 4.1.1) in RStudio (Version 1.2.5019). Concentrations equal to 0 were excluded from analysis, due to failure to fit. Robust linear regressions were conducted using the MASS package, predicting the correlation between metabolite concentration and age or sex for each voxel. Wald tests for multiple coefficients were used to identify the impact of each explanatory variable. Regional differences in the age trajectory for each metabolite were investigated using Hittner, May, and Silver’s modified z-statistic due to non-independence, implemented in the cocor package.
Results
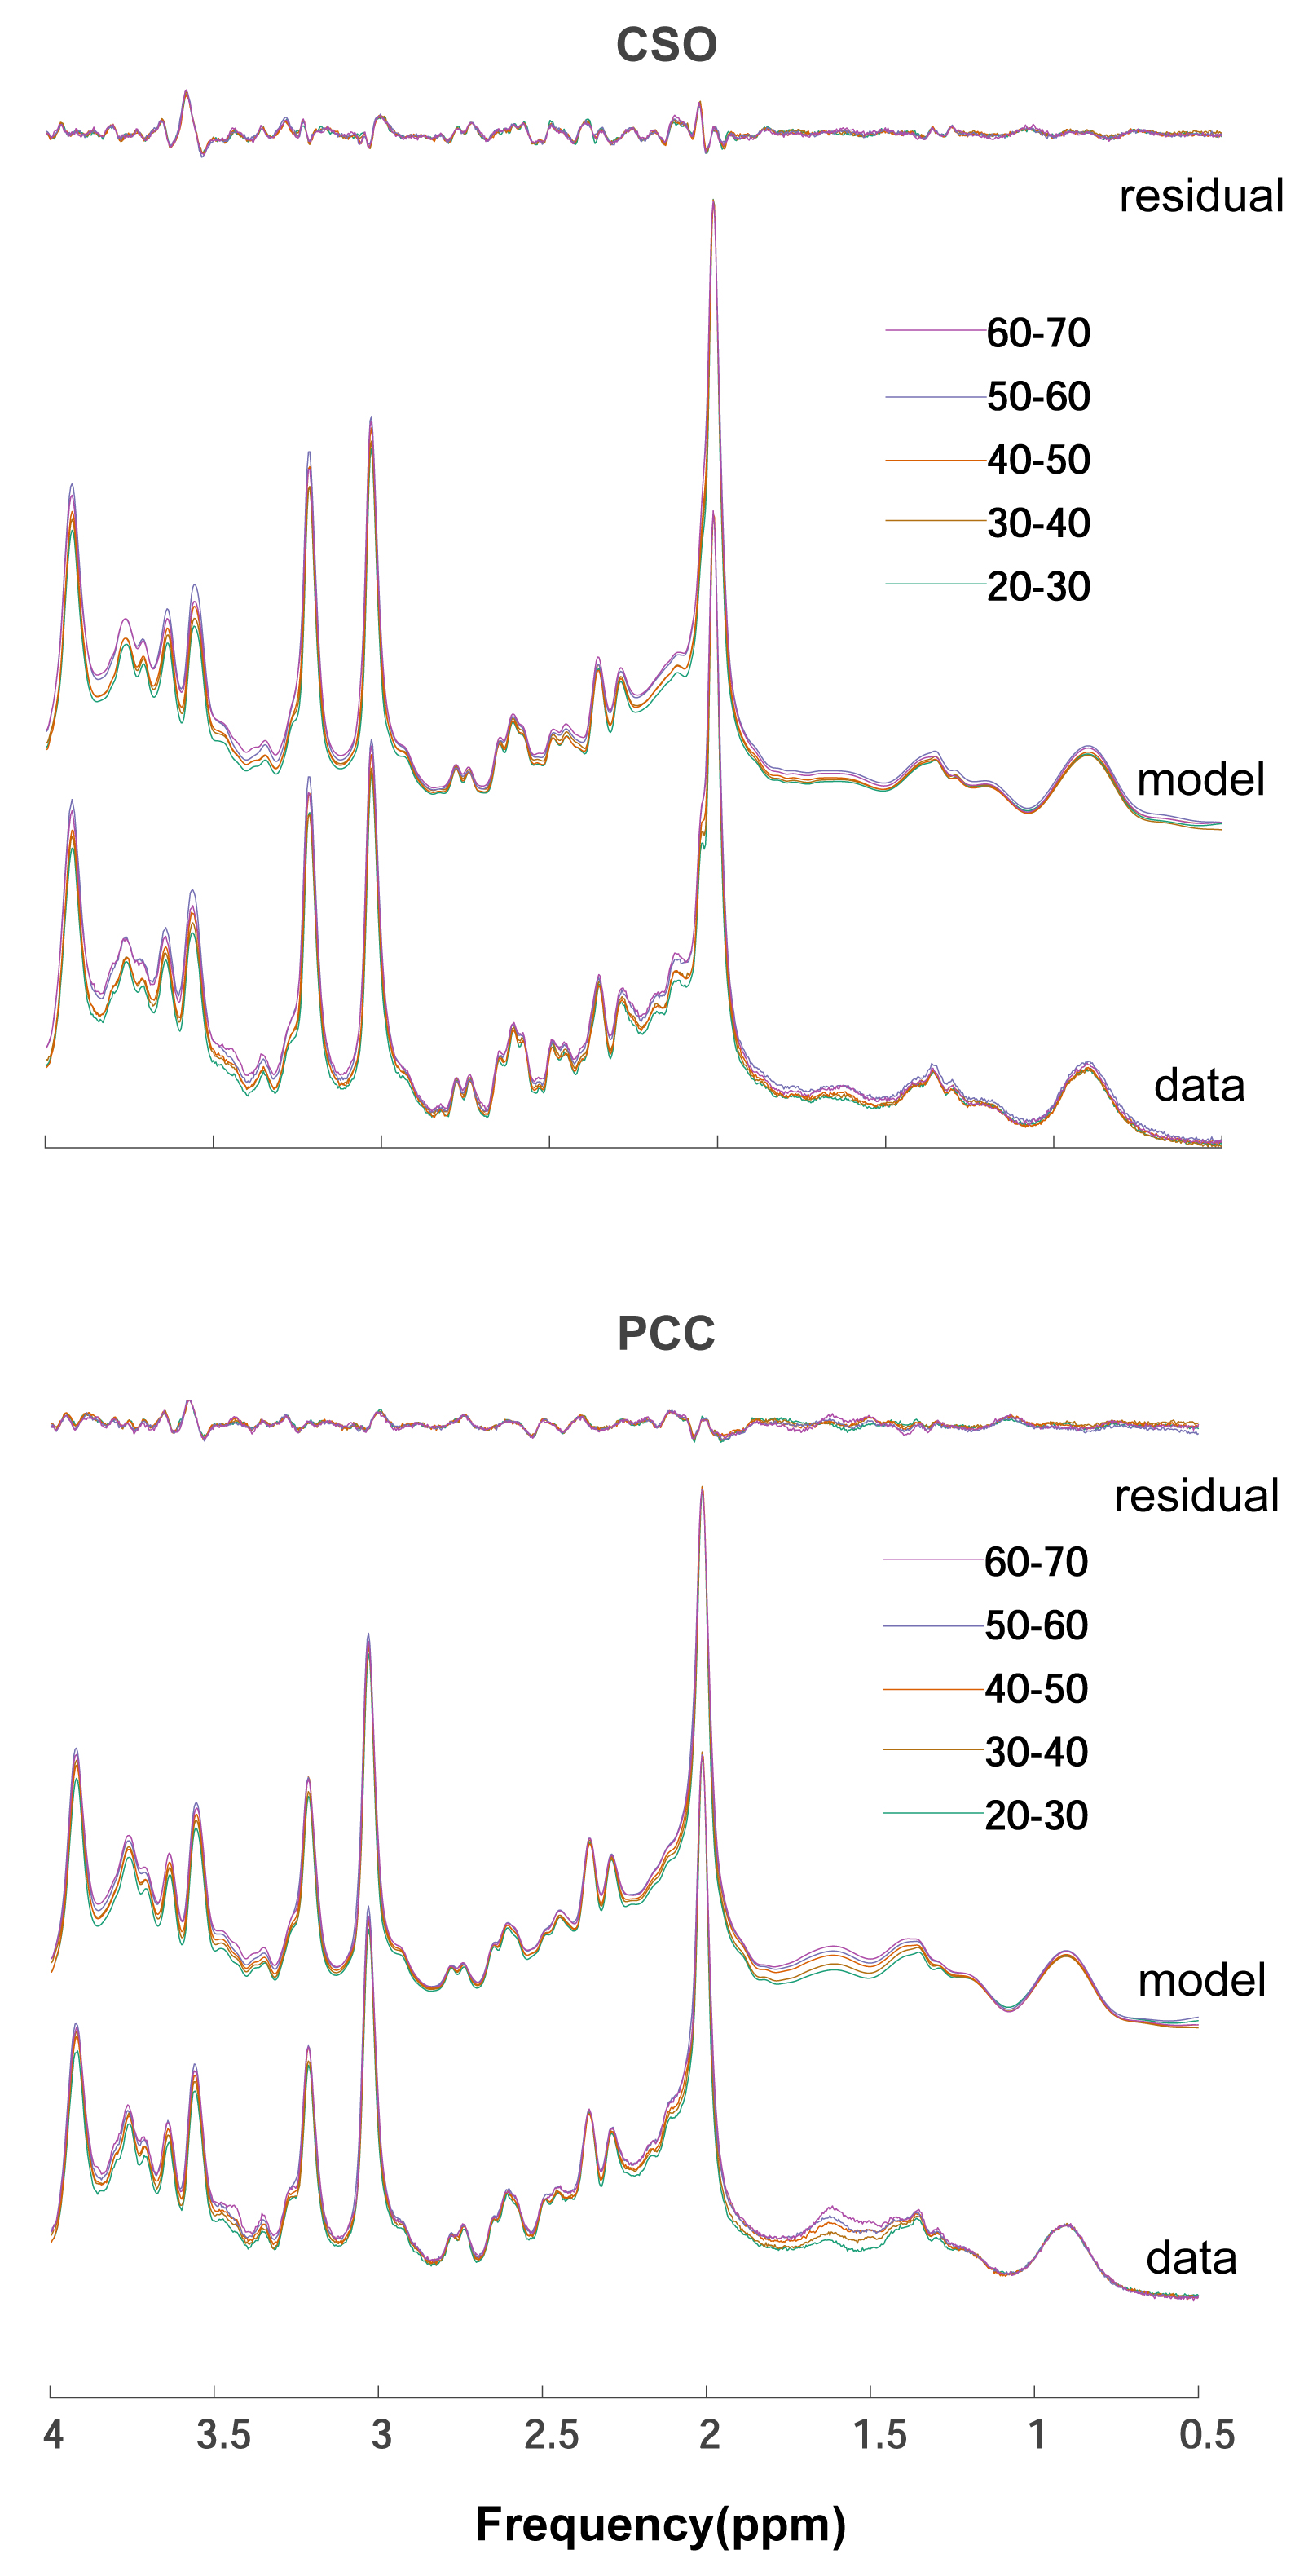
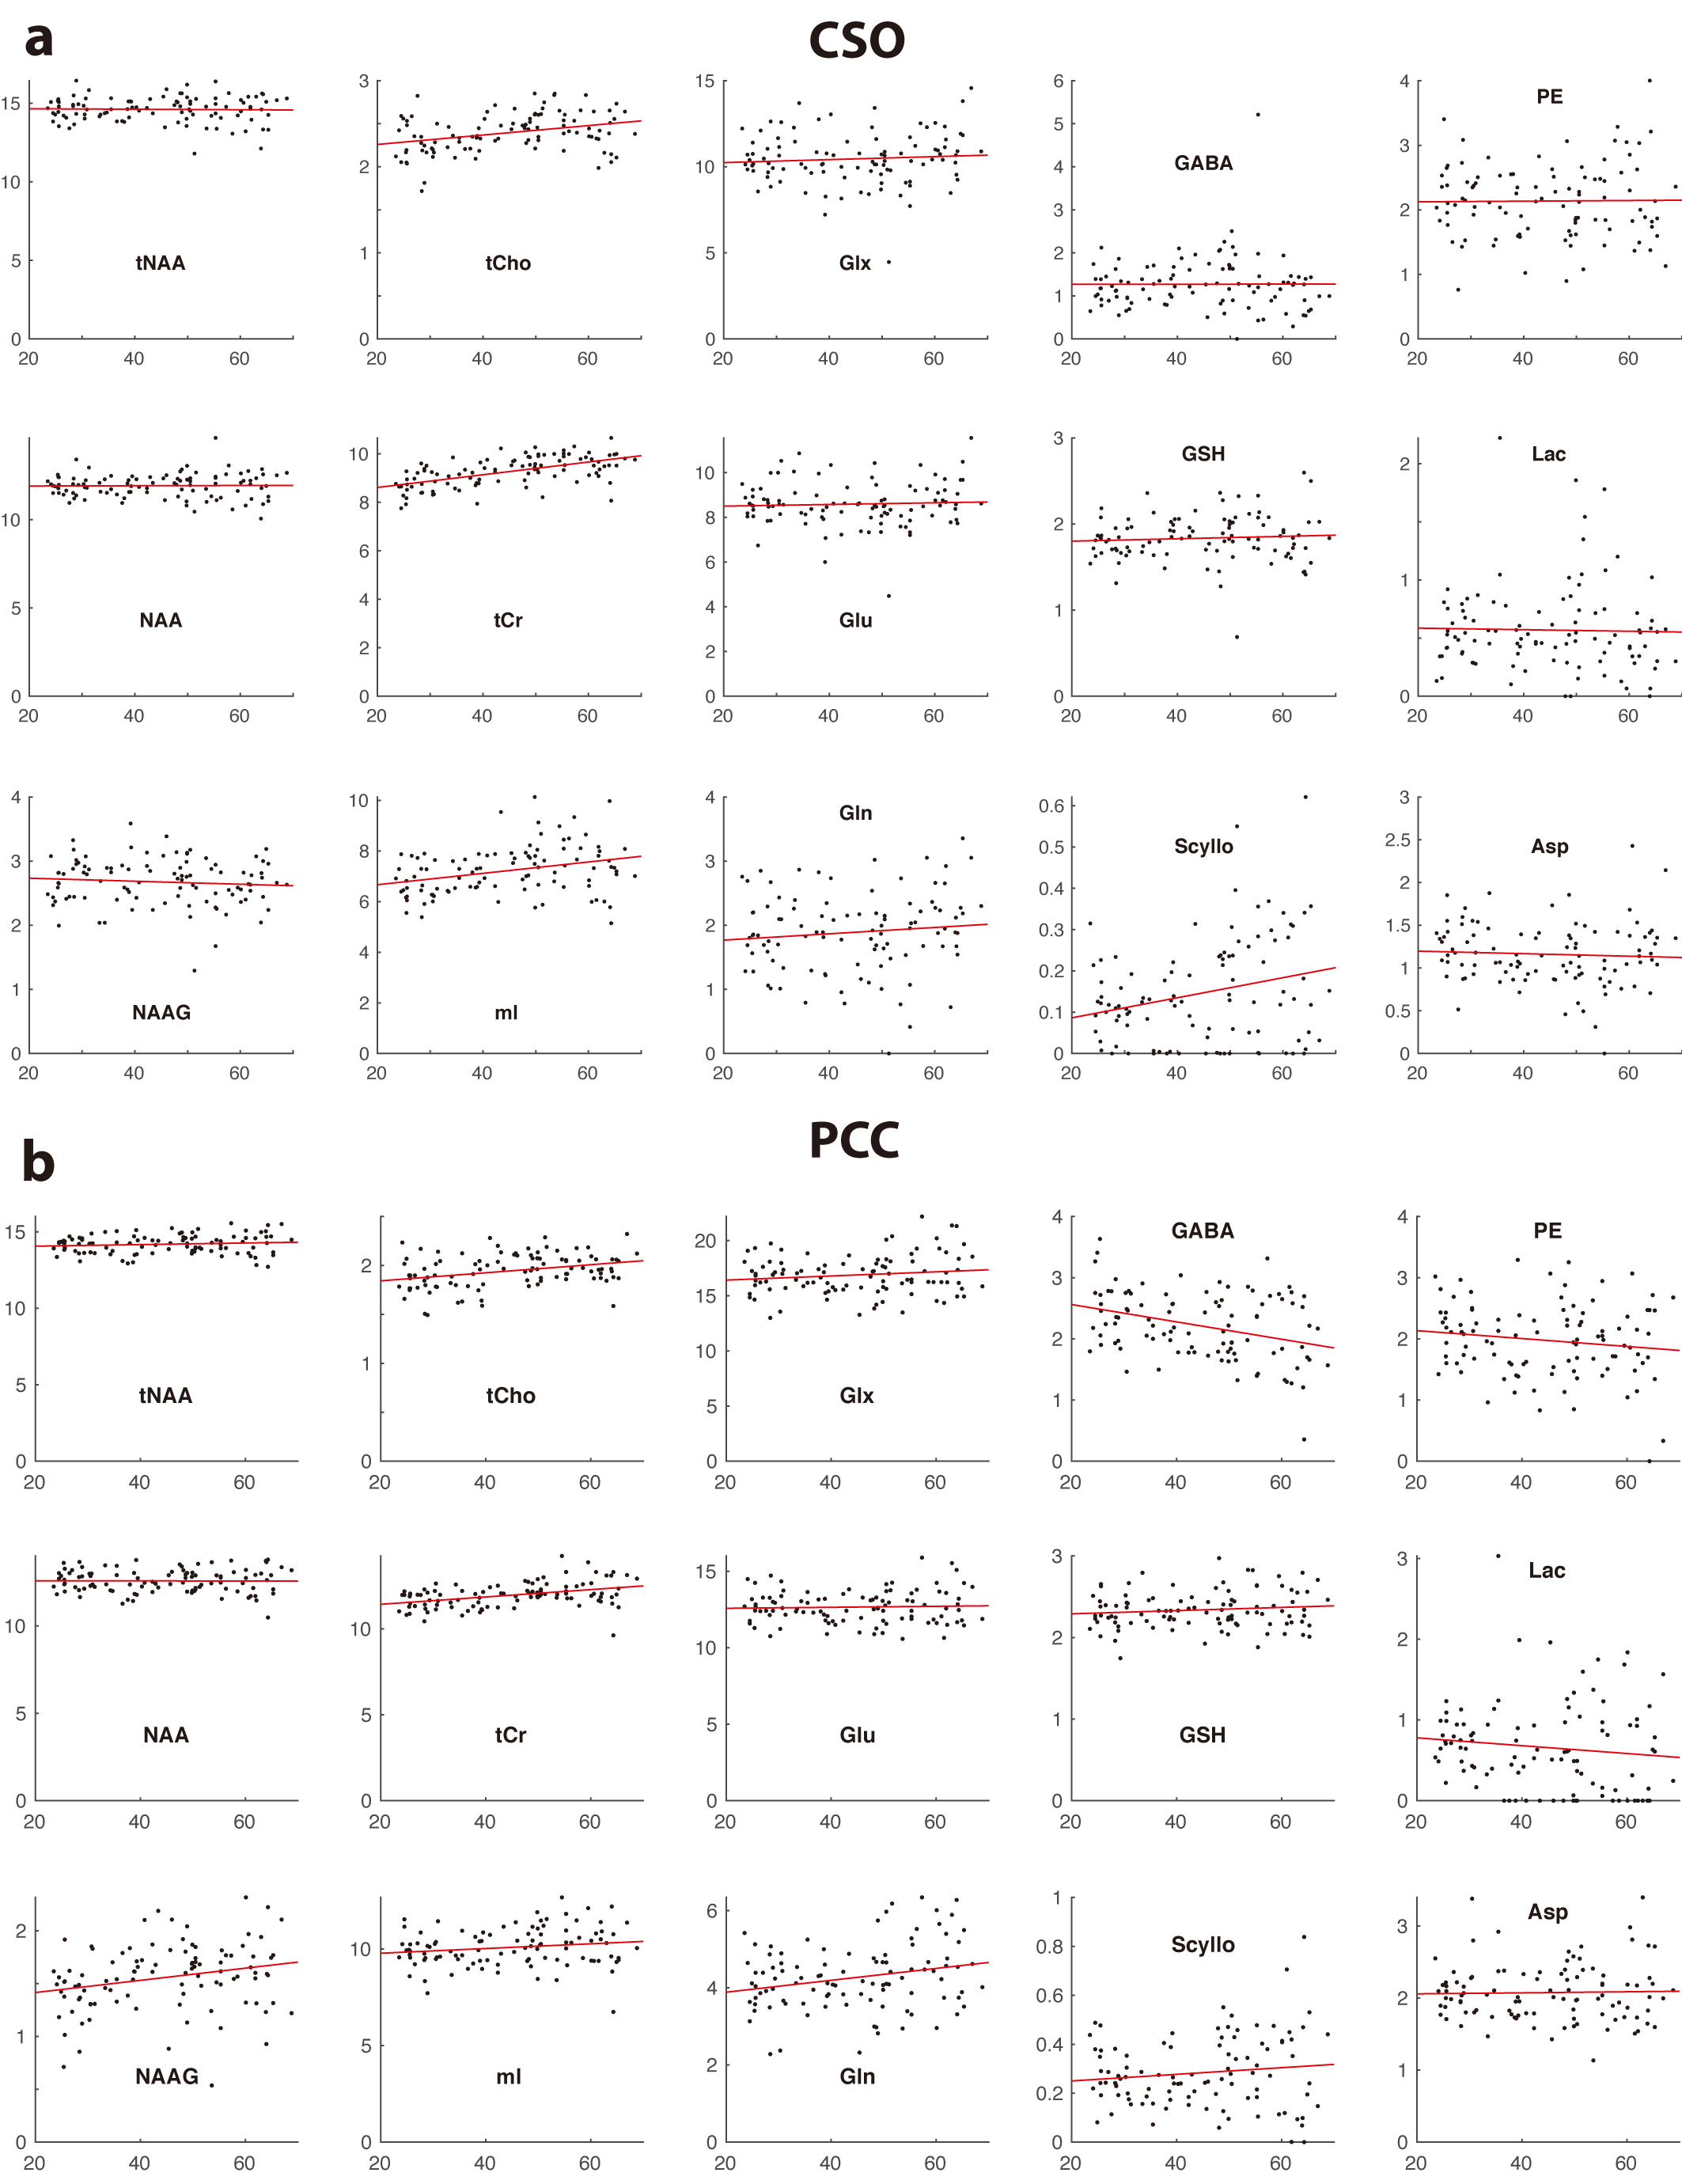
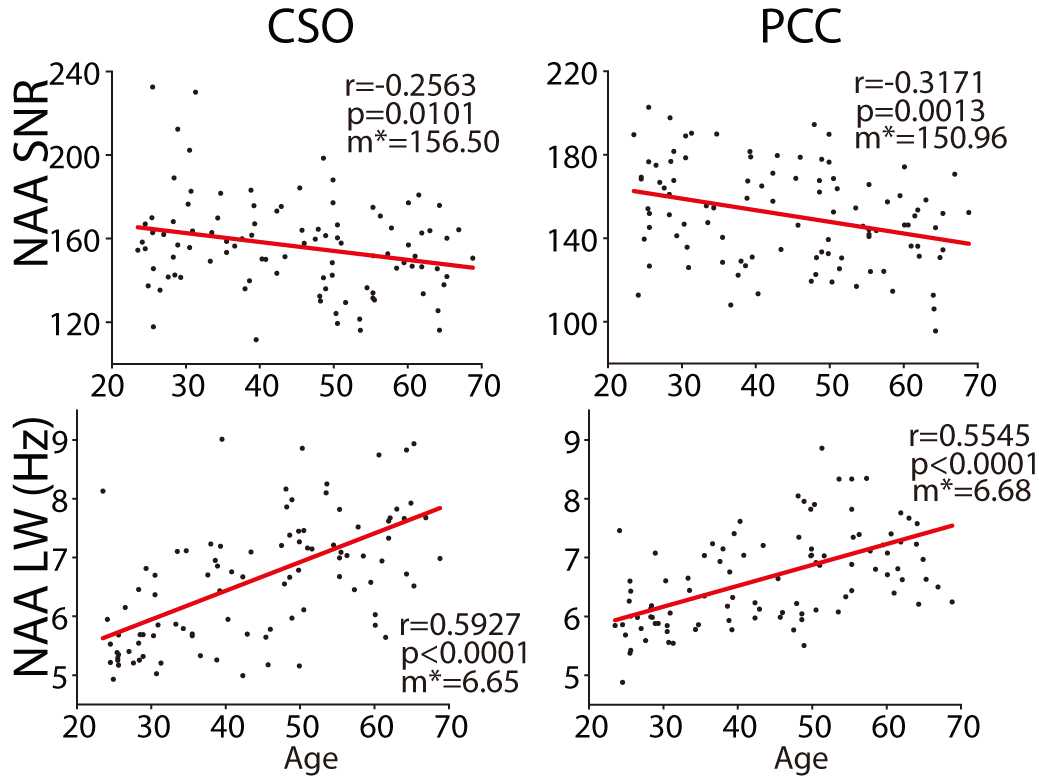
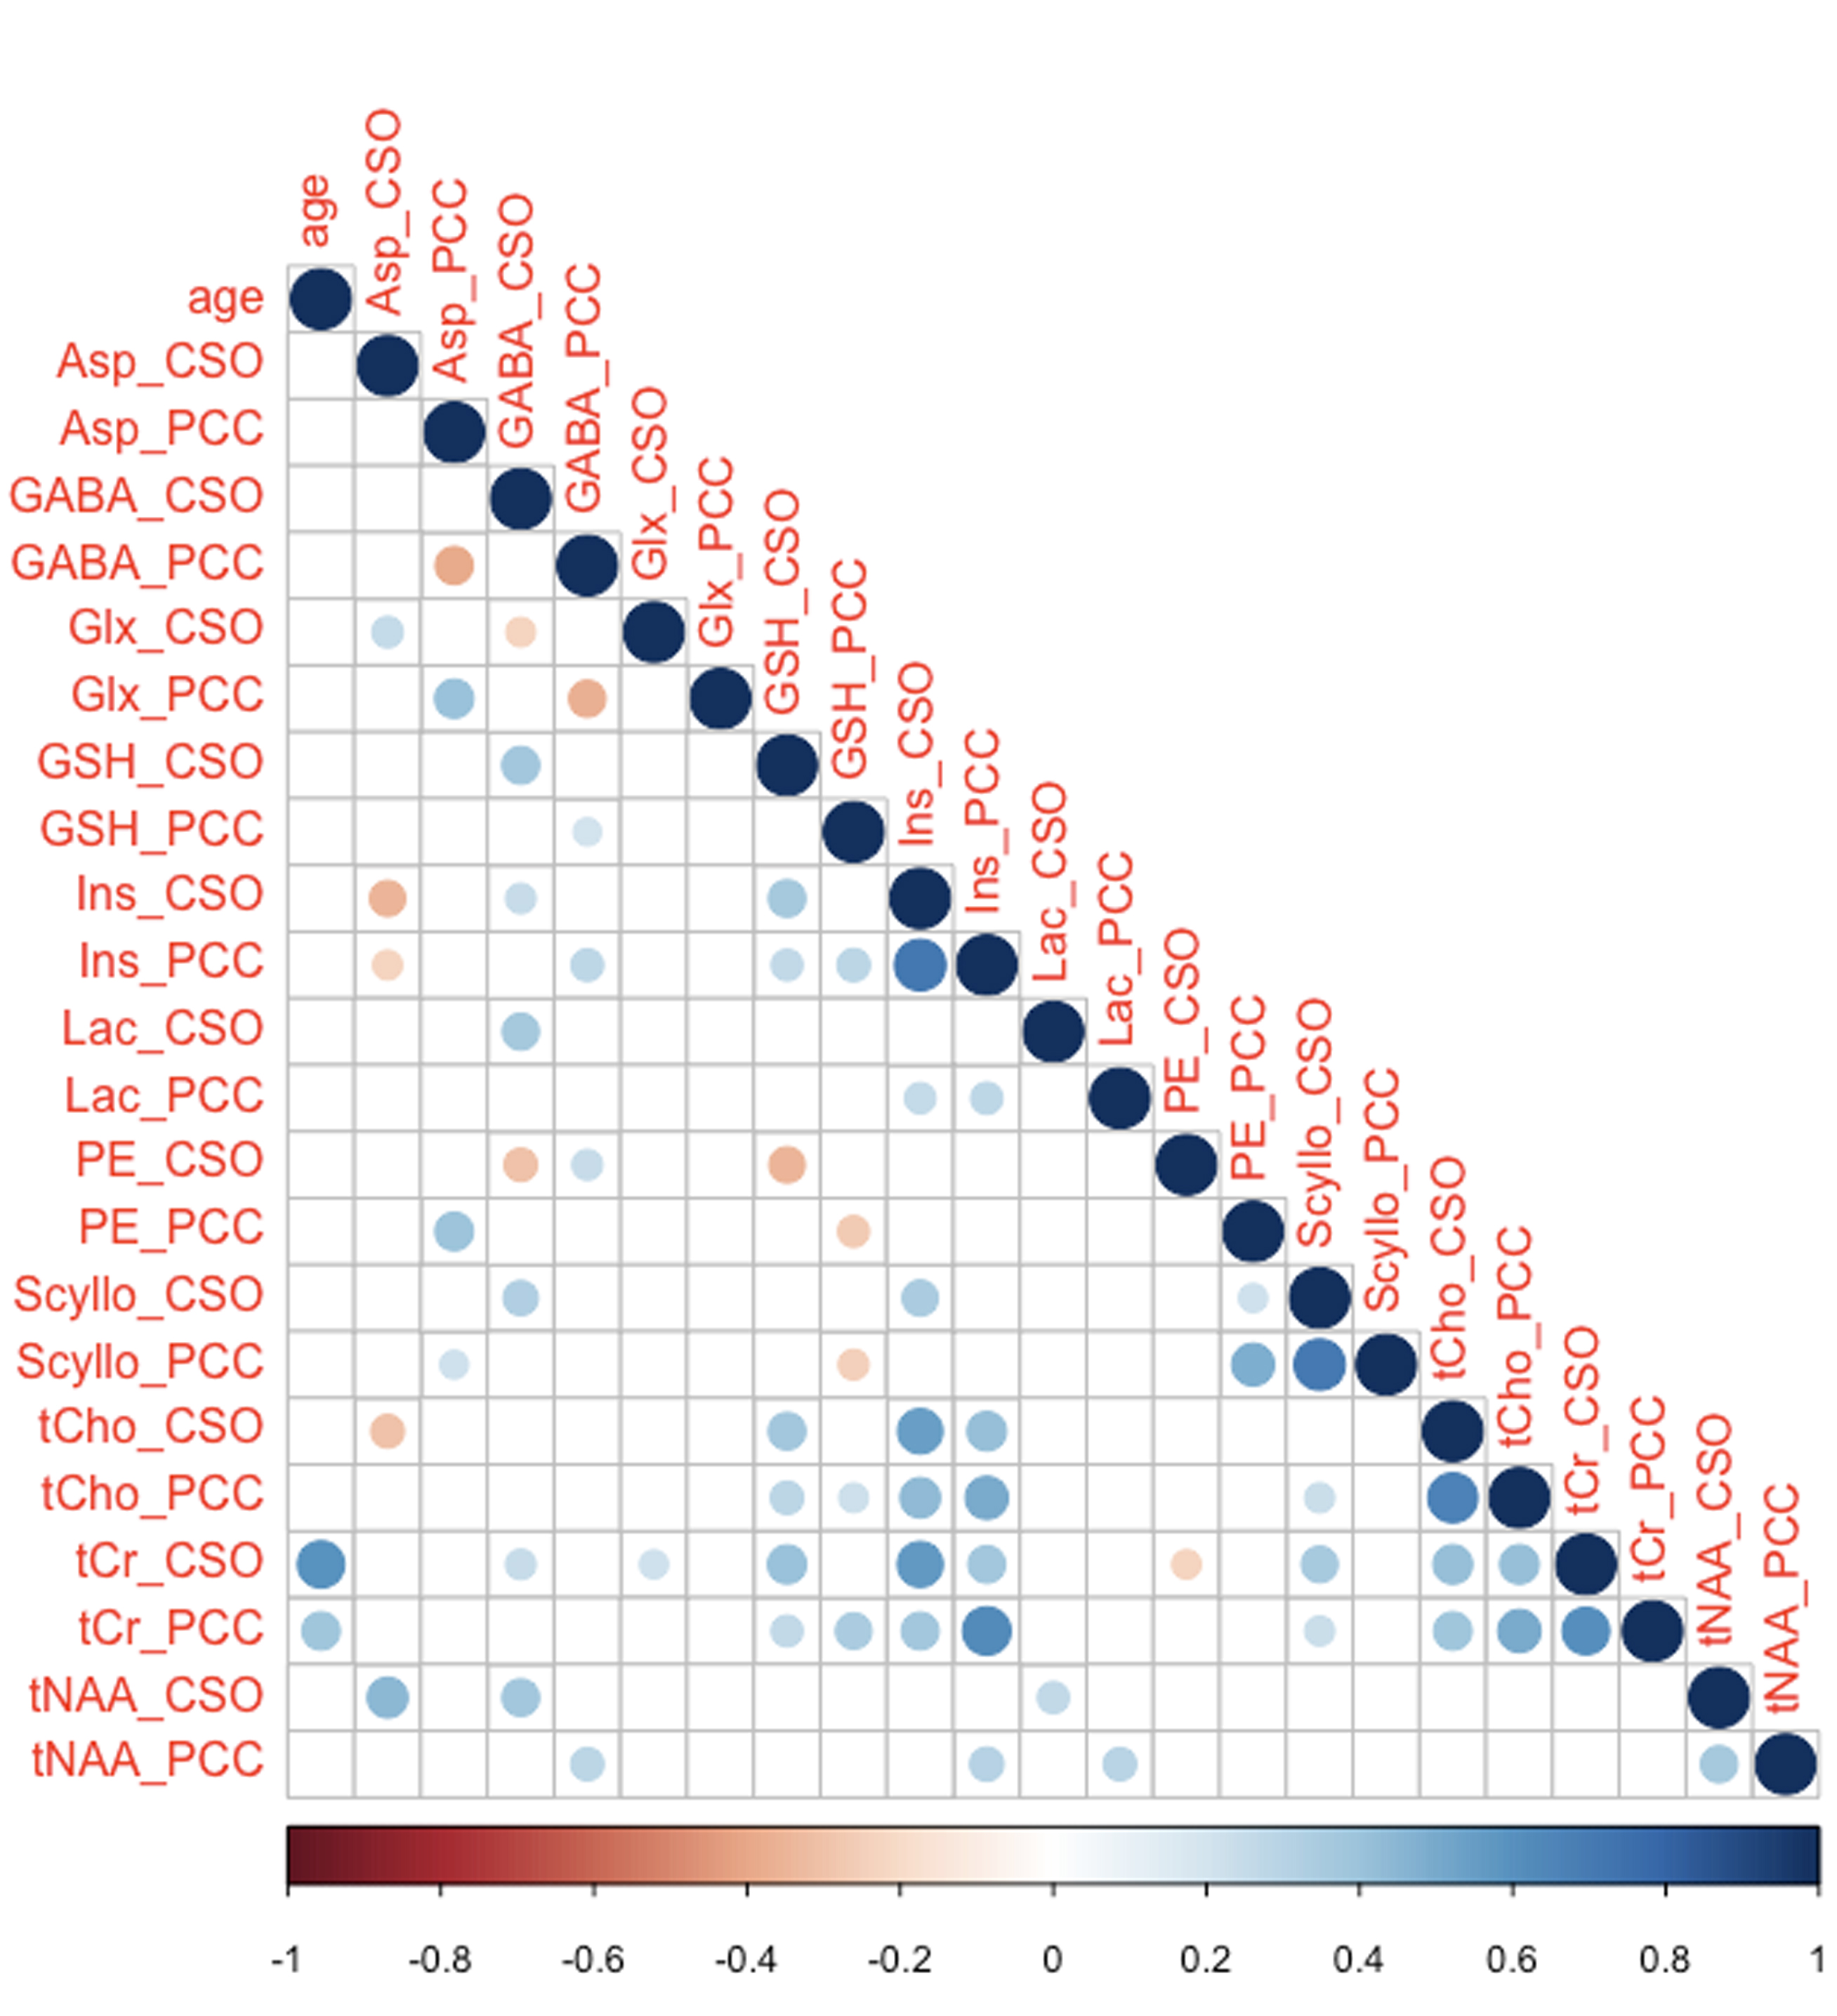
Two datasets were excluded (1 ethanol; 1 unacceptably large lipid signals). Average spectra per decade from each region are shown in Figure 2. Age-by-metabolite correlation plots for the major metabolites are shown in Figure 3. Statistically significant age-by-metabolite correlations were seen for tCr (R2=0.36; p<0.001), tCho (R2=0.11; p<0.001), Scyllo (R2=0.11; p=0.004), and mI (R2=0.10; p<0.001) in CSO, and tCr (R2=0.15; p<0.001), tCho (R2=0.11; p<0.001), and GABA (R2=0.11; p=0.003) in PCC. No significant correlations were seen between tNAA, NAA, Glx or Glu and age in either region (all p>0.25). There was a significant positive correlation between linewidth and age, as seen in Figure 4. Levels of Scyllo were significantly higher in the PCC in female subjects (p<0.001). Age correlations and inter-metabolite correlations are illustrated in Figure 5.Discussion
This study indicated that tCho and tCr increased with age in both CSO and PCC, in line with most previous MRS studies6, perhaps driven by glial proliferation, as higher Cho and Cr levels are found in glial cells7. The strong positive correlations between tCr levels and age suggest that false age-related declines in metabolite levels would be reported if Cr-referenced metabolite ratios were used. The glial metabolite mI demonstrated a positive correlation with age in CSO, and a trend toward increase with age in PCC, that did not reach statistical significance. The metabolically linked Scyllo showed a similar pattern (increase in CSO, no effect in PCC). Scyllo was also significantly higher in the PCC in female subjects, suggesting sex should be considered when investigating Scyllo alterations.It is notable that age correlations were not observed for NAA, tNAA, Glu or Glx in either region, despite the fact that this has been frequently reported in the literature6. One potential explanation for this is the age-range of our cohort (20-69 years), which would not be sensitive to changes later in life. NAA and Glu declines are most often observed in quantifying ratios to Cr, and so might be driven by the reference denominator more than changes in the numerator. One recent study8 applying relaxation and tissue correction did not show age-related NAA changes. In spite of short-TE PRESS being a controversial approach, these data demonstrated significantly higher levels of GABA GM and WM, and a reduction in GABA level with age - both results commonly seen with edited MRS9.
Inter-metabolite correlations revealed some interesting relationships. Overall, there were more positive than negative correlations. While common variance in the reference signal may drive such correlations, they do not appear to be more prevalent within-region (common reference) than between-region (independent reference). We therefore interpret this as reflecting genuine biological covariance. Several metabolites showed substantial positive correlations between PCC and CSO - tNAA, tCho, tCr, mI, and Scyllo. Negative correlations between metabolites with overlapping basis spectra are potential evidence of the limitation of linear-combination modeling at 3T. These are seen between GABA and Glx, and for GSH and PE, both exclusively within-region.
Conclusion
The results indicated positive age correlations in tCho, tCr, and mI for CSO and PCC, while no age-related changes for NAA, tNAA, Glu or Glx. Our results provide further evidence of metabolic timecourse of healthy aging, suggesting that age matching is essential for comparative studies of neuro-degenerative disease using MRS.Acknowledgements
This work has been supported by NIH grants P41EB015909, R01EB016089, R01EB023963, R21AG060245, and R00AG062230.This study was financially supported by Natural Science Foundation of Shandong (Grant No. ZR2020QH267)References
1. Tkác I, Starcuk Z, Choi IY, Gruetter R. In vivo 1H NMR spectroscopy of rat brain at 1 ms echo time. Magn Reson Med. 1999;41(4):649-656. doi:10.1002/(sici)1522-2594(199904)41:4<649::aid-mrm2>3.0.co;2-g
2. Oeltzschner G, Zöllner HJ, Hui SCN, et al. Osprey: Open-source processing, reconstruction & estimation of magnetic resonance spectroscopy data. J Neurosci Methods. 2020;343:108827. doi:10.1016/j.jneumeth.2020.108827
3. Hui SCN, Gong T, Zöllner HJ, et al. The Macromolecular MR Spectrum in Healthy Aging. bioRxiv. Published online January 1, 2021:2021.08.27.457961. doi:10.1101/2021.08.27.457961
4. Gasparovic C, Song T, Devier D, et al. Use of tissue water as a concentration reference for proton spectroscopic imaging. Magn Reson Med. 2006;55(6):1219-1226. doi:10.1002/mrm.20901
5. Wansapura JP, Holland SK, Dunn RS, Ball WS. NMR relaxation times in the human brain at 3.0 tesla. J Magn Reson Imaging. 1999;9(4):531-538. doi:10.1002/(sici)1522-2586(199904)9:4<531::aid-jmri4>3.0.co;2-l
6. Cleeland C, Pipingas A, Scholey A, White D. Neurochemical changes in the aging brain: A systematic review. Neurosci Biobehav Rev. 2019;98:306-319. doi:10.1016/j.neubiorev.2019.01.003
7. Brand A, Richter-Landsberg C, Leibfritz D. Multinuclear NMR studies on the energy metabolism of glial and neuronal cells. Dev Neurosci. 1993;15(3-5):289-298. doi:10.1159/000111347
8. A L, Cj B, Et P, Ob P, Hr S, A M. Regional Myo-Inositol, Creatine, and Choline Levels Are Higher at Older Age and Scale Negatively with Visuospatial Working Memory: A Cross-Sectional Proton MR Spectroscopy Study at 7 Tesla on Normal Cognitive Ageing. The Journal of neuroscience : the official journal of the Society for Neuroscience. 2020;40(42). doi:10.1523/JNEUROSCI.2883-19.2020
9. Gao F, Edden RAE, Li M, et al. Edited magnetic resonance spectroscopy detects an age-related decline in brain GABA levels. Neuroimage. 2013;78:75-82. doi:10.1016/j.neuroimage.2013.04.012
Figures