4678
Correlation of metabolomics of intestinal mucosal biopsies with enzyme and secretory activity of duodenal enterocytes in celiac disease1Department of NMR, All India Institute of Medical Sciences (AIIMS), New Delhi, India, 2Department of Pathology, All India Institute of Medical Sciences (AIIMS), New Delhi, India, 3Department of Gastroenterology and Human Nutrition, All India Institute of Medical Sciences (AIIMS), New Delhi, India
Synopsis
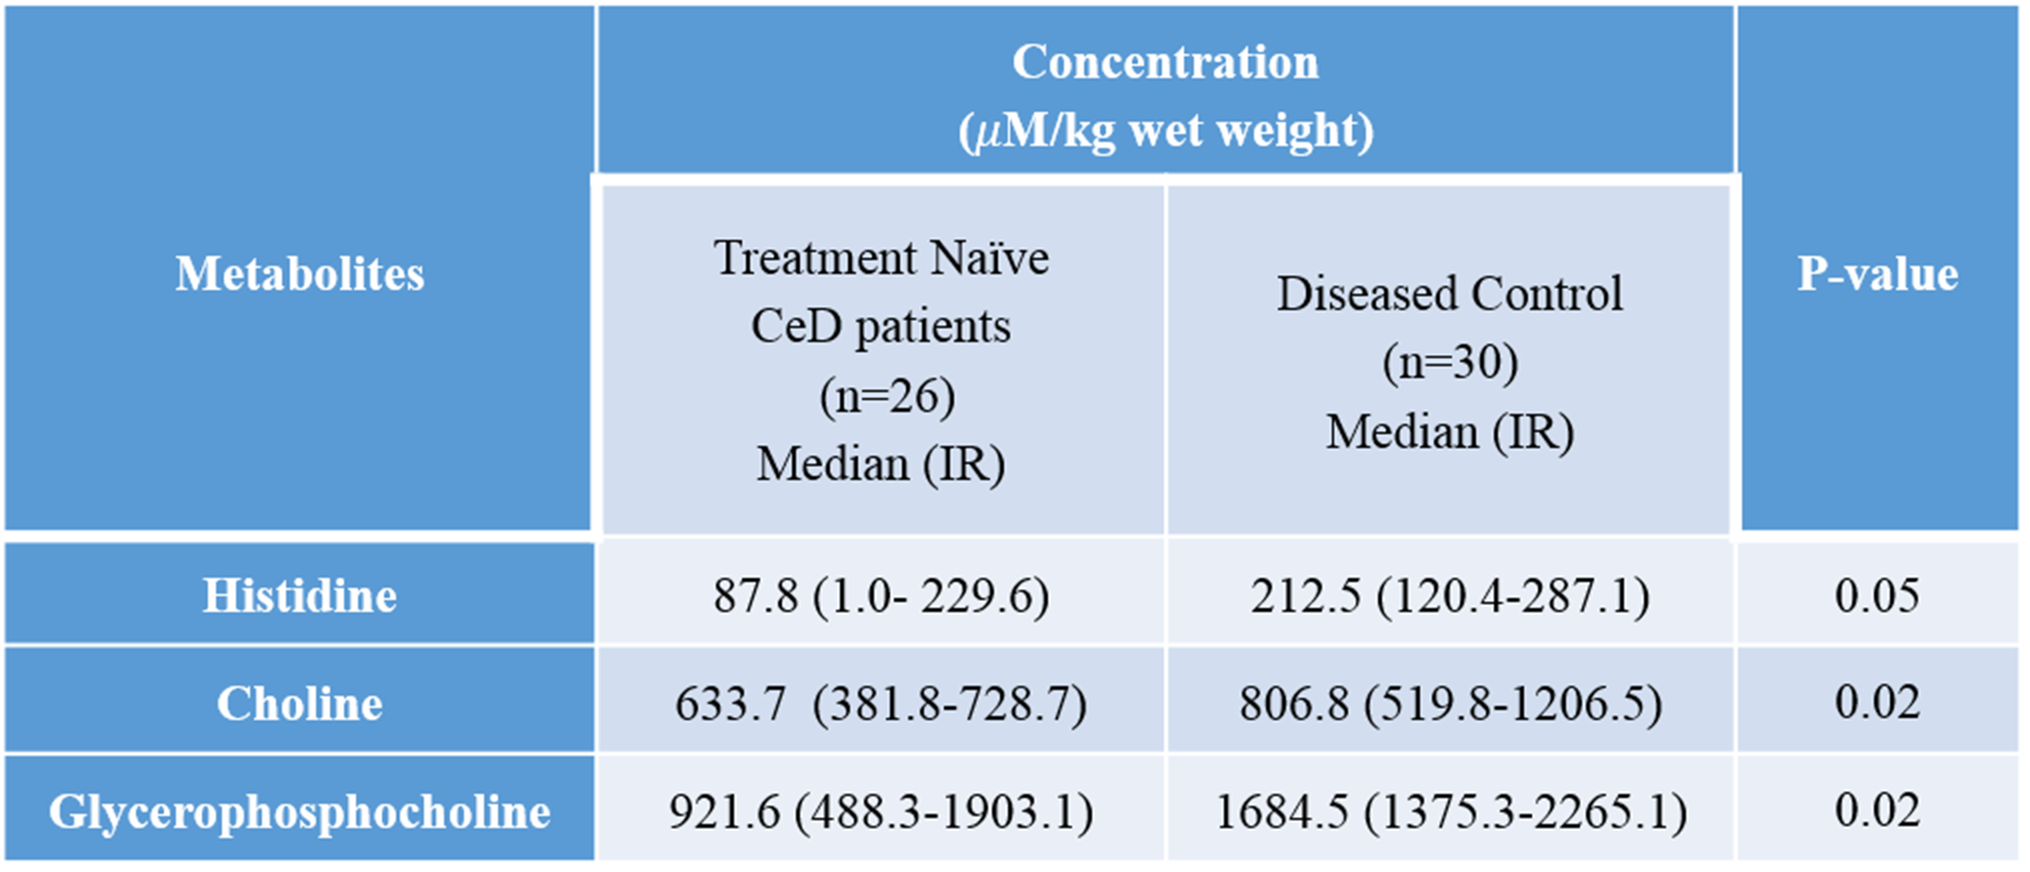
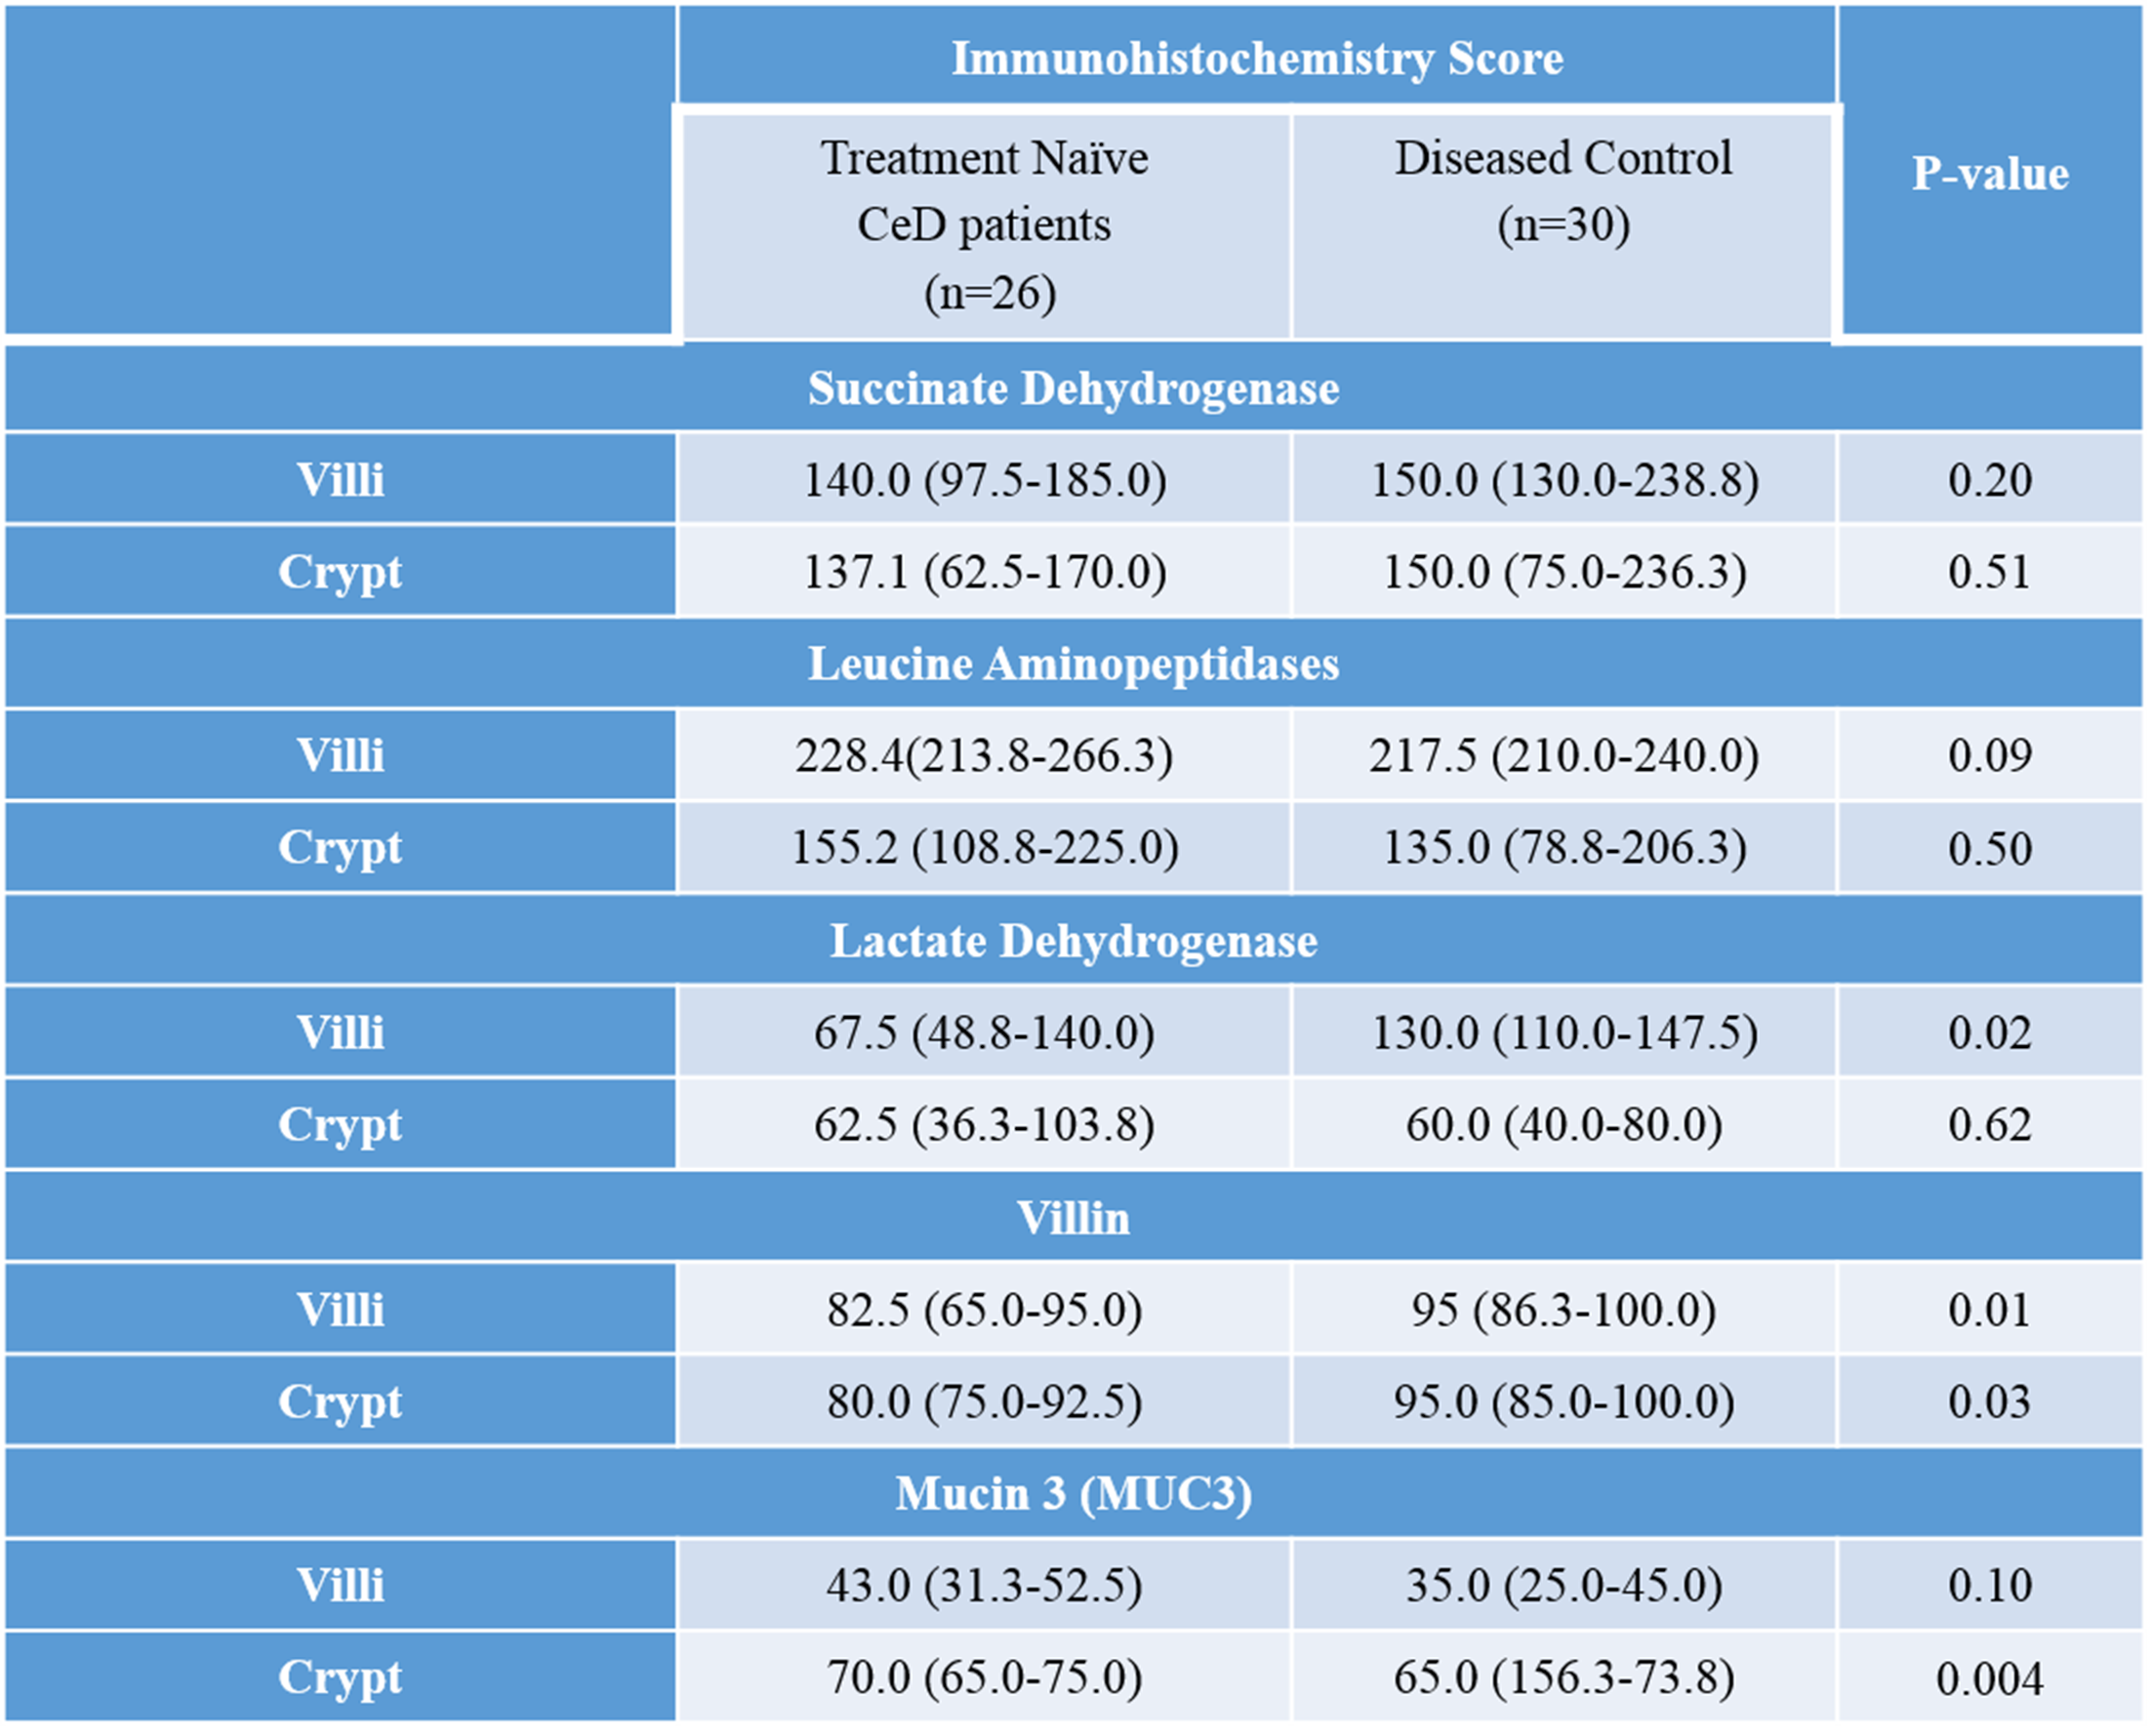
The present study revealed a correlation of metabolic activity of intestinal mucosa with enzymatic, secretory, and functional activity in patients with celiac disease (CeD). Significantly lower concentrations of choline, GPC, and histidine were observed patients along with the significantly lower expression of villin in both villi and crypt of the CeD compared to disease controls (DC) controls. Higher expression of Mucin 3 in the crypt of the CeD was seen. A significant correlation between expression of villin, mucin and metabolites GPC and histidine provided an insight into underlying biochemical and functional mechanism of mucosal damage in CeD.
Introduction
The intolerance to gluten in celiac disease (CeD) leads to atrophy of intestinal villi through an inflammatory cascade, however, it remains unclear whether gluten sensitivity contributes to the pathogenesis or whether it represents an epiphenomenon. Since, the pathology of celiac disease has been a consequence of abnormal metabolic activity, the metabolic changes in the gastrointestinal may be due to changes in the enzymatic activity and the absorptive and secretory functions of the duodenal enterocytes. Therefore, the aim of the present study is to investigate the metabolic profile of the intestinal mucosa using in vitro nuclear magnetic resonance (NMR) spectroscopy and to determine whether there is any correlation between the metabolic profile of intestinal mucosa and enzymes such as succinate dehydrogenase (SDH), lactate dehydrogenase (LDH), leucine aminopeptidase and also morphological (villin) and secretory function markers (mucin 3) determined by immunohistochemical technique.Materials and methods
Subjects: Twenty-six treatment naïve patients with CeD (mean age 29.5±12.7 yrs) were recruited from the CeD Clinic at AIIMS, New Delhi. The diagnosis of CeD was made on the basis of the presence of clinical features, a positive anti-tissue trans glutaminase antibody and villous abnormalities of modified Marsh grade >2. Thirty control subjects (mean age 31.2±8.4 yrs) with functional dyspepsia undergoing endoscopic examination for evaluation of their disease were recruited as disease controls (DC). All control subjects were negative for anti-tTG antibodies and had no villous abnormalities. Both the patients and controls underwent esophagogastroduodenoscopy and mucosal biopsies were obtained from the third part of the duodenum. Small intestinal mucosal biopsies were collected at the time of endoscopy for NMR spectroscopy and immunohistochemistry. The study was approved by the Institutional ethics committee.NMR Spectroscopy: Water soluble metabolites were extracted from the biopsies using perchloric acid extraction. The resultant lyophilized powder was dissolved in deuterium oxide and sodium trimethyl-silyl-[2, 2, 3, 3-H4] was used as chemical shift reference. One dimensional and two dimensional total correlation spectroscopy NMR experiments were performed at 700 MHz (Agilent, U.S.A.). 1D spectrum was acquired with a single 60° pulse (Ernst angle) with water suppression. The parameters used for 1D experiment were as follow: spectral width=9800 Hz, data points=32 K, number of scans=256 and relaxation delay=14s.
Immunohistochemistry: Immunohistochemical staining of SDH, leucine amino peptidase, LDH, mucin 3 (MUC3) and villin were performed in both villi and crypts and at least 5% of the epithelial cells displayed distinct immune-staining were considered positive. A quick score (QS, range 0-300) was calculated by multiplying staining intensity by the percentage of positive cells.
Data analysis: The concentration of metabolites and quick score was compared between the groups using Mann Whitney U test (GraphPad Prism 8). Spearman’s correlation tests were performed between the concentration of metabolites and immunohistochemistry score of markers (GraphPad Prism 8). A p-value < 0.05 was considered statistically significant.
Results
A total of forty-one metabolites were assigned and the concentration of 25 metabolites were determined. A significantly lower concentration of choline, glycerophosphocholine (GPC) and histidine were observed in the intestinal mucosal biopsies of CeD patients as compared to DC (Table 1, Figure 1). Further, a significantly lower expresssion of villin were observed in both villi and crypt of the CeD patients as compared to the controls (Table 2). We also observed the higher expression of Mucin 3 (MUC3) in the crypt of the CeD patients as compared to the controls (Table 2). Moreover, we found a significant positive correlation between GPC concentration and villin expression in crypt (r = 0.49, p = 0.01, Figure 2).Discussion
A significantly lower concentration of Choline and GPC was observed in the intestinal mucosa of patients with CeD. GPC levels showed a significant correlation with the levels of villin expression. Choline and GPC is essential for the regulation of cell growth and differentiation. Thus, decreased Choline and GPC level in CeD patients indicated lower proliferation of intestinal epithelial cells 1. Villin is the major component of the brush border skeleton of the intestinal epithelium and its synthesis increases during the differentiation process of the enterocyte2. Thus, lower level of villin in crypt and villi suggested impairment in the differentiation process of enterocytes leading to villous atrophy in CeD. It was also reported that the proliferative activity of crypt was not efficient for the replacement of enterocytes resulting in villous atrophy in CeD3. Our data also showed a significantly lower level of histidine in the CeD patients. Histidine acts on the transcription level and inhibits the activation of NF-κB and thereby, downregulates the production of the proinflammatory cytokines 4. Further, we also observed the higher expression of MUC3 in the crypt of the CeD patients. It is reported that the inflammatory cytokines upregulate the MUC3 gene and lead to the hypersecretion of MUC3 which have implication in the protective role of mucosal epithelial cells. Therefore, higher expression of the mucin in the crypt of the CeD patients as compared to controls is indicative of intestinal inflammation5.Conclusions
The correlation between the metabolic profile of the intestinal mucosal biopsies with the MUC3 and villin provided an insight into underlying biochemical and functional mechanism of mucosal damage and pathogenesis in patients with CeD.Acknowledgements
The authors would like to acknowledge the intramural funding (A222) from AIIMS, New Delhi.References
1) Sharma U, Upadhyay D, Mewar S, Mishra A, Das P, Gupta SD, Dwivedi SN, Makharia GK, Jagannathan NR. Metabolic abnormalities of gastrointestinal mucosa in celiac disease: An in vitro proton nuclear magnetic resonance spectroscopy study. J Gastroenterol Hepatol. 2015;30(10):1492-8.
2) Athman R, Louvard D, Robine S. The epithelial cell cytoskeleton and intracellular trafficking. III. How is villin involved in the actin cytoskeleton dynamics in intestinal cells? Am J Physiol Gastrointest Liver Physiol. 2002;283(3):G496-502.
3) Shalimar DM, Das P, Sreenivas V, Gupta SD, Panda SK, Makharia GK. Mechanism of villous atrophy in celiac disease: role of apoptosis and epithelial regeneration. Arch Pathol Lab Med. 2013;137(9):1262-9.
4) Hasegawa S, Ichiyama T, Sonaka I, Ohsaki A, Okada S, Wakiguchi H, Kudo K, Kittaka S, Hara M, Furukawa S. Cysteine, histidine and glycine exhibit anti-inflammatory effects in human coronary arterial endothelial cells. Clin Exp Immunol. 2012;167(2):269-74.
5) Shekels LL, Ho SB. Characterization of the mouse Muc3 membrane bound intestinal mucin 5' coding and promoter regions: regulation by inflammatory cytokines. Biochim Biophys Acta. 2003 19;1627(2-3):90-100.
Figures