4670
The protective effect of silymarin on TAA-induced liver injury model as assessed by MRI for a long-term follow-up study1Department of Convergence Medicine, Asan Medical Center, University of Ulsan College of Medicine, Seoul, Korea, Republic of, 2Convergence Medicine Research Center, Asan Institute for Life Sciences, Asan Medical Center, Seoul, Korea, Republic of, 3Medical Research Institute, Gangneung Asan Hospital, Gangneung-si, Gangwon-do, Korea, Republic of
Synopsis
Our study aims to monitor the protective effects of silymarin with multi-parametric MRI follow-ups and pathological markers in a TAA-induced liver injury rat model. Moreover, correlations between the MR values and serological markers were analyzed to interpret MR values as indicators of liver functions.
INTRODUCTION
Despite the recent successes of various new drugs for liver diseases, development of new drugs for liver diseases is still important because the morbidity of chronic liver diseases (CLDs) is growing worldwide.1,2 Silymarin has an anti-fibrotic effect through the inhibition of the myofibroblasts activities. It prevents the transformation of HSCs into a myofibroblast-like phenotype and blocks the generation of extracellular matrix (ECM), which induces hepatic fibrosis.3,4 However, no studies have evaluated the effects of silymarin on liver function with follow-up MRIs. In present study, we investigated the protective effects of silymarin in a TAA-induced animal model longitudinally with MRI. Additionally, we analyzed the correlations between pathological markers and multi-parametric MRI data, and assessed the interpretability of traditional markers and MRI values regarding disease severity.MATERIALS & METHODS
Six-week-old male Sprague-Dawley rats were used and randomly divided into two groups: the control group (n=9), TAA-injected (n=13; TAA) and TAA-injected and silymarin-treated groups (n=11; TAA-SY). To induce hepatic fibrosis, 200-mg/kg TAA was intraperitoneally injected thrice a week for 8 weeks. After 4 weeks, an intraperitoneal injection of 100-mg/kg silymarin was administered three times a week for 4 weeks. Blood samples were collected from the tail vein every 2 weeks. Serum levels of AST, ALT, TBIL, and ALB were measured. The liver tissue samples were stained with H&E, MT, and iron stains. MRI was performed every 2 weeks using a 9.4-T magnet. MRI parameters were as follows: (1) T1-weighted dynamic contrast-enhanced (DCE)-MRI with TR/TE=70/2.47 ms, flip angle=35°, averages=1, matrix size=96×96, field-of-view (FOV)=50×50 mm2, total scan time=44 min 48 s, and the number of images=400. Further, 25-μmol/kg Gd-EOB-DTPA was intravenously injected after 120 s. The relative enhancement rate (RER) was calculated using the equation RER(t)=[{SI(t)−SI(0)}/SI(0)]×100 (%).5 Herein, SI(t) is the signal intensity of the liver at time t, and SI(0) is the average of SI before Gd-EOB-DTPA injection. The area under the curve to maximum time (AUCtmax) was calculated by the integration of areas from 0 to 6 min. (2) T2* map with TR/TE=800/2.56 ms, echo=6, flip angle=30°, averages=4, matrix size 128×128, FOV=50×50 mm2. Statistical analysis was performed using SPSS 21.0. A one-way ANOVA and independent t-tests was performed to compare the mean between different values, and p<0.05 was considered statistically significant (*p<0.05, **p<0.01, ***p<0.001).RESULTS AND DISCUSSION
In the TAA group, AST, ALT, and TBIL were gradually increased. In the TAA-SY group, AST, ALT, and TBIL were also seemed to be increased until the fourth week, yet their levels went down with the initiation of the treatment of silymarin (Fig.1A). The NAS scores for lobular inflammation (0.00±0.00 vs. 2.29±0.83 vs. 1.55±0.69) and the Brunt scores for fibrosis degrees (0.22±0.44 vs. 3.29±0.73 vs. 2.36±1.03) were measured; additionally, the differences in the three groups were analyzed. In both scores, the TAA group showed the highest scores compared to the other two groups (Fig.1B). We acquired T1-weighted images with MRI (Fig.2A). In comparison analyses of RER, the TAA group showed lower RER than the control group from the 2nd weeks while the TAA-SY group showed recovery from the 6th week (Fig.2B). The AUCtmax levels of the TAA group showed a significant decrease from the 4th week and the onward weeks compared to the control. In the TAA-SY group, a significant decrease of the AUCtmax levels compared to the control group was observed at the 4th week. As the levels of AUCtmax recovered from the 6th week, significant differences between the TAA and TAA-SY groups were observed; however, the levels of AUCtmax did not recover to the levels of the control group at the 8th week (Fig.2C). In the correlation analyses, we observed negative correlations between AUCtmax and each of AST, ALT, and TBIL (Fig.2D). We also analyzed T2* mapping MR images for a multi-parametric analysis (Fig.3A). Similar patterns were observed in the T2* values compared with T1-weighted images. Between the TAA group and TAA-SY group, no significant differences were observed in the T2* values; however, the T2* values of the TAA-SY group became higher from the 6th week and eventually, it became significantly higher at the 8th week (Fig.3B). Negative correlations between the T2* and each of AST, ALT, and TBIL were observed and showed that the correlations were significant (Fig.3C). We further analyzed the iron accumulation in the liver to elucidate the correlative relations between the amounts of iron and T2* shortening. We observed the iron overload near the portal triad of fibrosis in the liver of both TAA and TAA-SY groups (Fig.4A). We observed significant iron accumulation in both the TAA-treated groups compared to the control group, however, the iron amounts of the TAA-SY group were significantly lower than the TAA group (Fig.4B). The Pearson correlation between the T2* values and iron accumulated areas (%) in the control, TAA group, and the TAA-SY group at 8 weeks was investigated and the hepatic iron amounts showed strong negative correlations with the T2* values (Fig.4C).CONCLUSION
Our results suggest that silymarin treatment has hepatoprotective effects on TAA-induced liver injury and showed the usefulness of multi-parametric MRI as an efficacy evaluation tool for the liver drug development in a preclinical phase.Acknowledgements
This study was supported by grants of Basic Science Research Program through the National Research Foundation of Korea funded by the Ministry of Education [2018R1A2B2007694].References
1. Paik JM, Golabi P, Younossi Y, Mishra A, Younossi ZM. Changes in the Global Burden of Chronic Liver Diseases From 2012 to 2017: The Growing Impact of NAFLD. Hepatology 2020;72(5):1605-1616.
2. Roeb E. Non-alcoholic fatty liver diseases: current challenges and future directions. Ann Transl Med 2021;9(8).
3. Gillessen A, Schmidt HHJ. Silymarin as Supportive Treatment in Liver Diseases: A Narrative Review. Adv Ther 2020;37(4):1279-1301.
4. Tighe SP, Akhtar D, Iqbal U, Ahmed A. Chronic Liver Disease and Silymarin: A Biochemical and Clinical Review. J Clin Transl Hepato 2020;8(4):454-458.
5. Yamada T, Obata A, Kashiwagi Y, et al. Gd-EOB-DTPA-enhanced-MR imaging in the inflammation stage of nonalcoholic steatohepatitis (NASH) in mice. Magn Reson Imaging 2016;34(6):724-729.
Figures
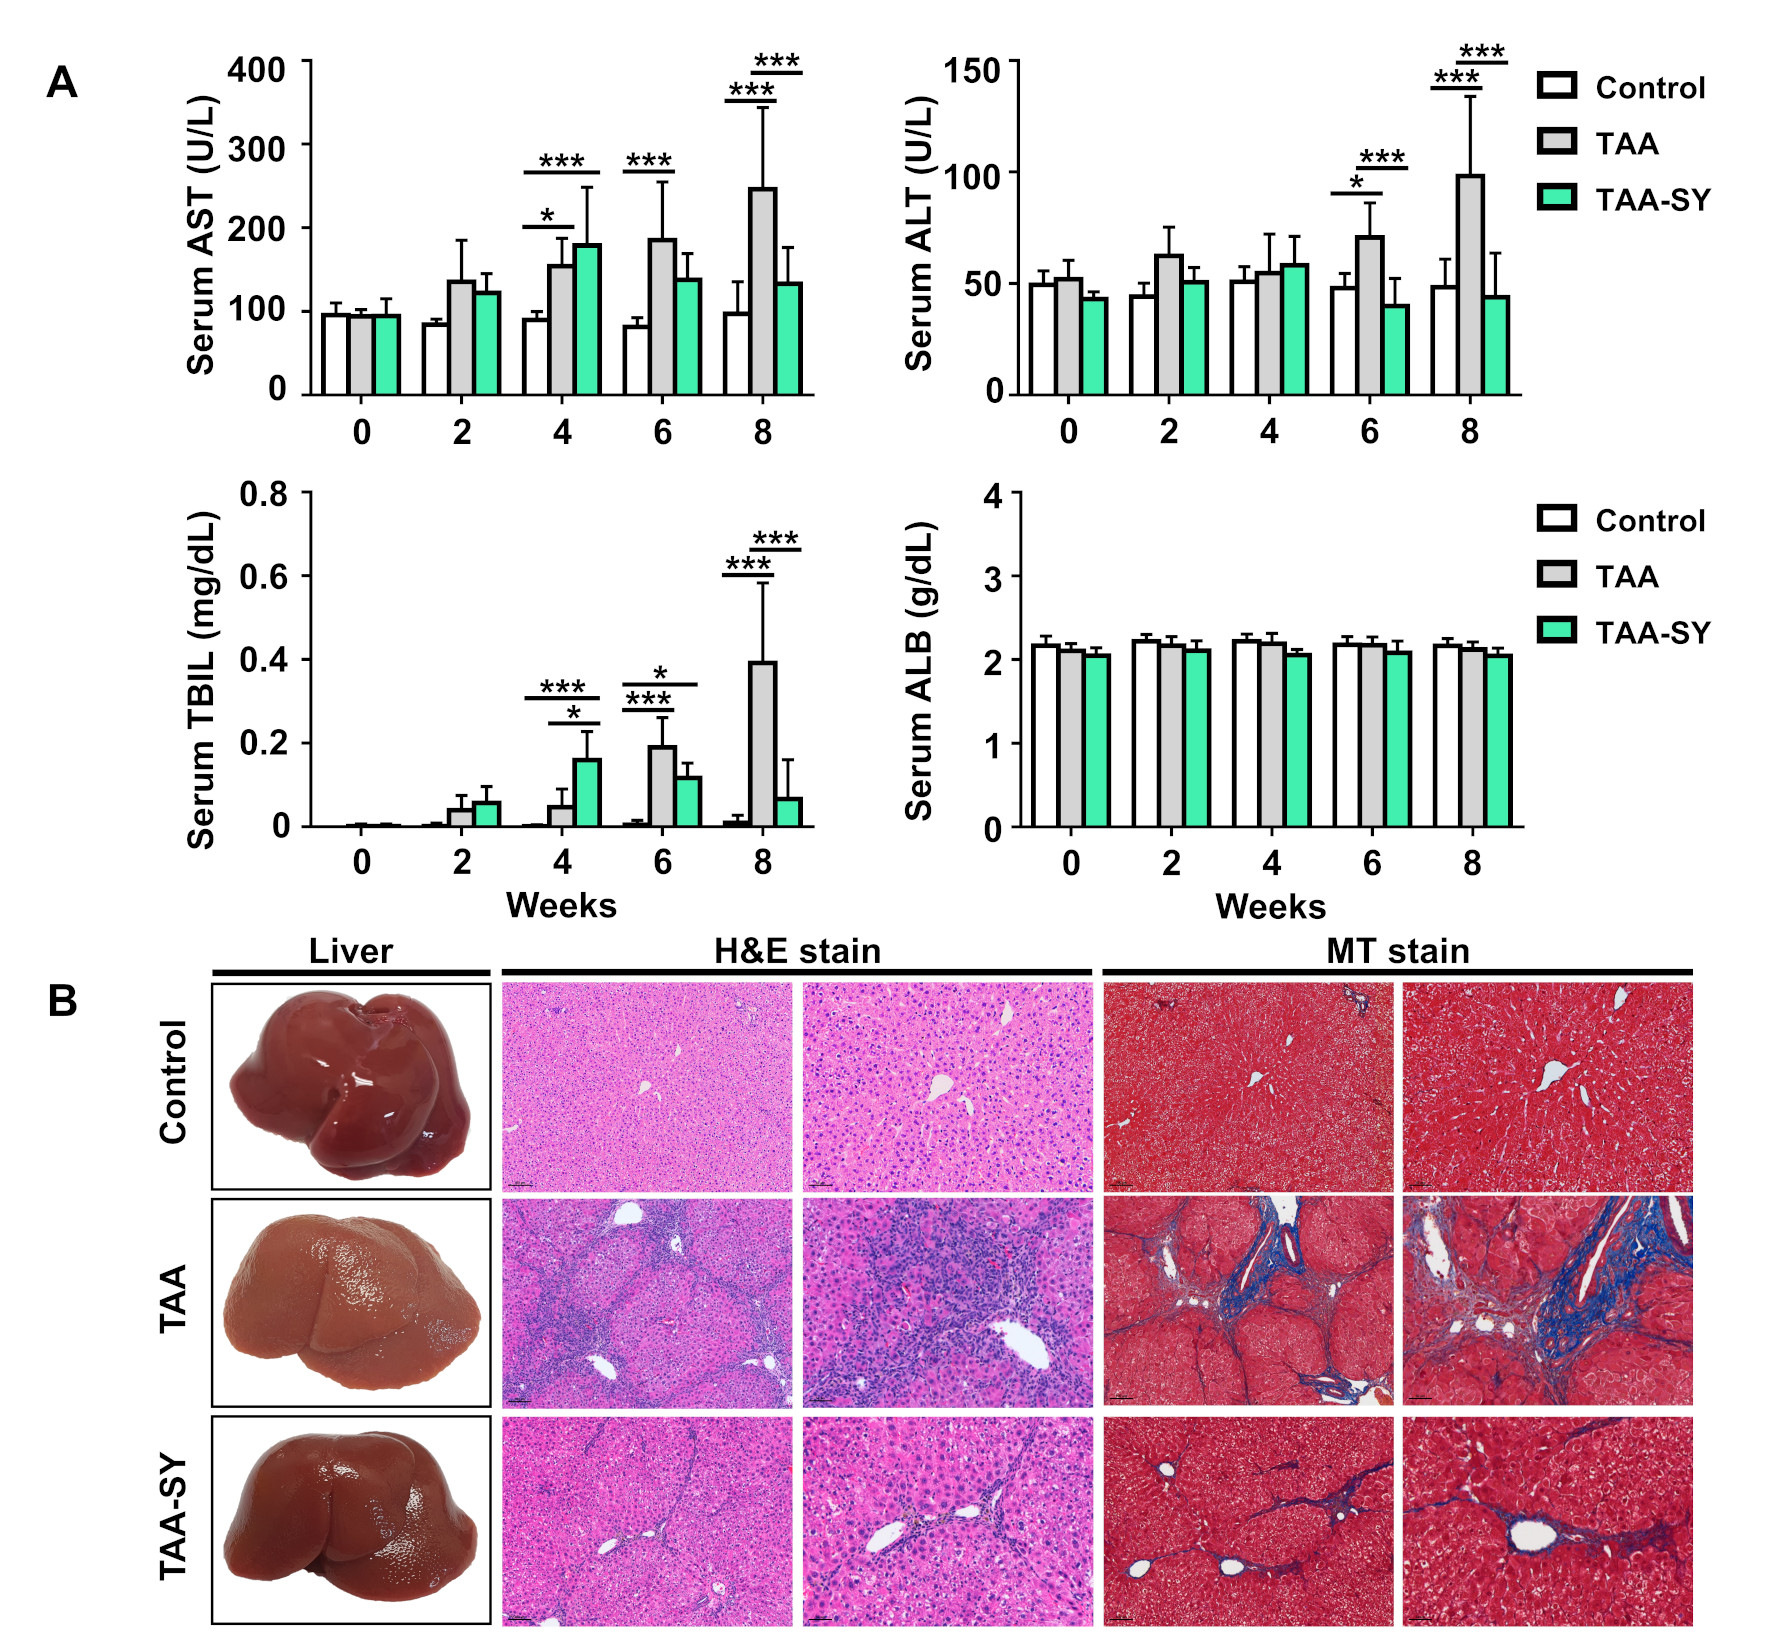
(A) Compared to the control group, the TAA group showed increased serum levels of AST, ALT, and TBIL, however, the TAA-SY group was recovered at 6 and 8 weeks and serum levels of ALB showed no difference. (B) The liver specimen was showed difference in color and fibrotic nodules among the three groups. To evaluate the inflammation and fibrosis area, hematoxylin and eosin and MT staining were performed.
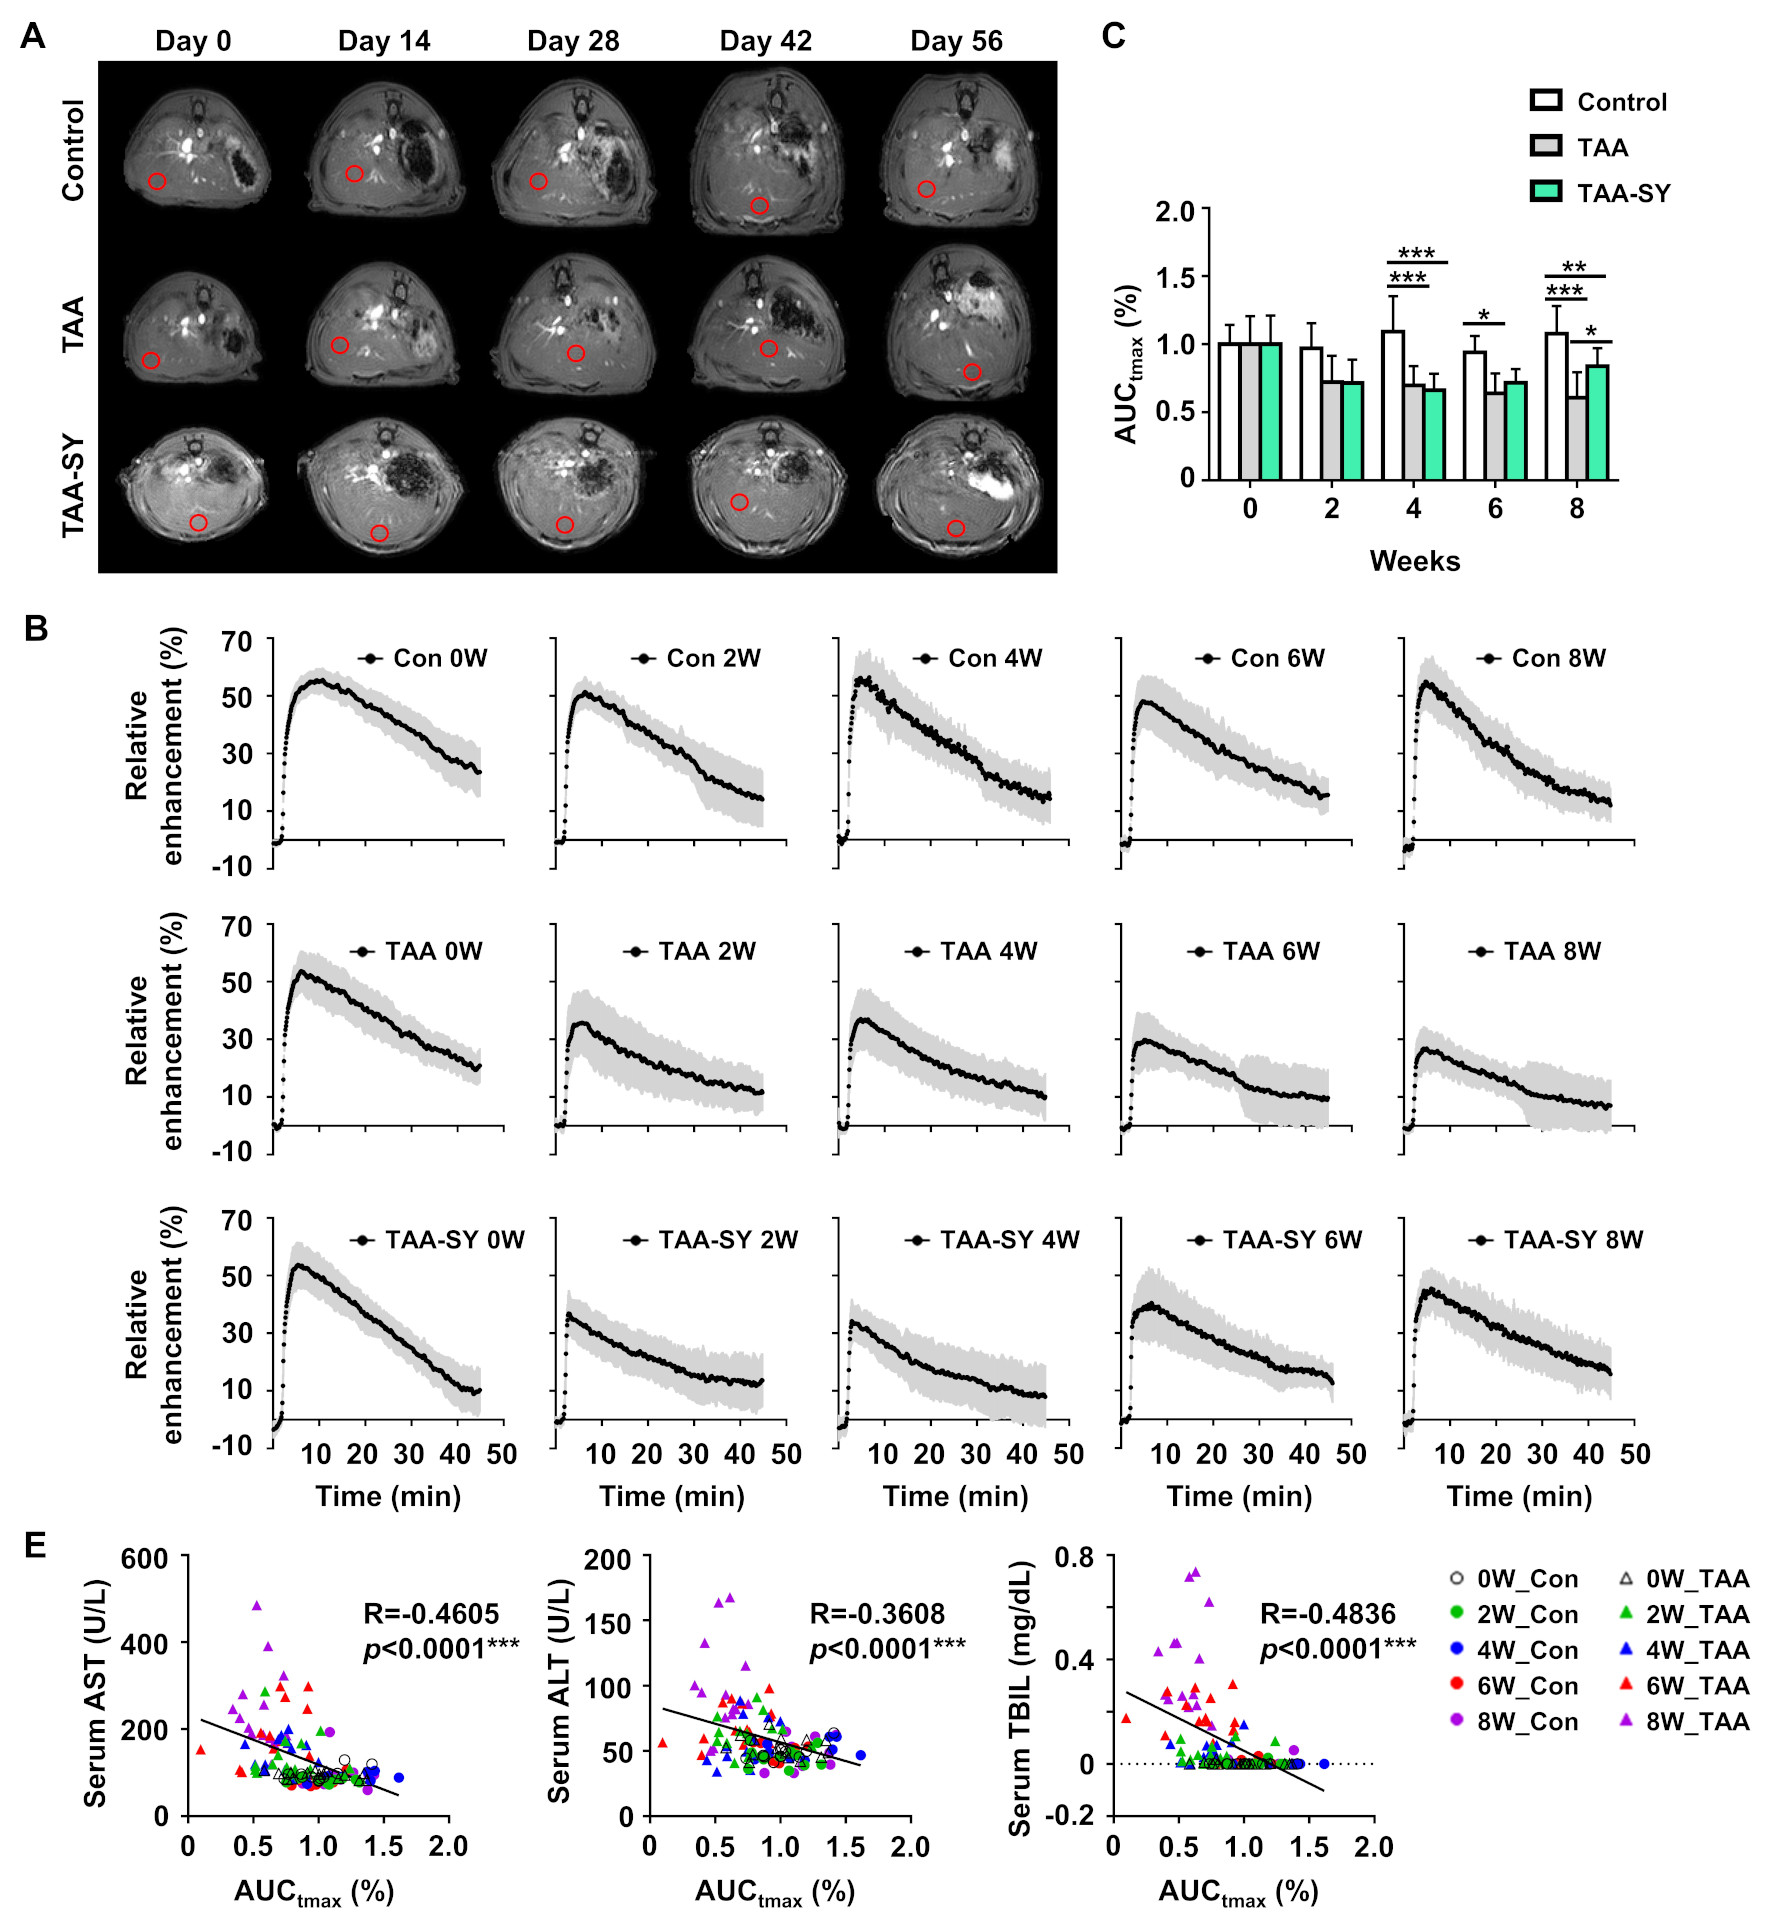
(A) Axial MRI of the liver with a region of intensity (ROI;red box) was obtained longitudinally for the control, TAA, and TAA-SY groups on days 0, 14, 28, 42, and 56. (B) The RER was analyzed by T1-weighted DCE images. (C) The AUCtmax was decreased in the TAA group and that TAA-SY group was increased at 8 weeks. (D) R and p-value between the control and TAA group during a TAA-induced period. The AUCtmax correlated with the expression of several hepatic enzymes.
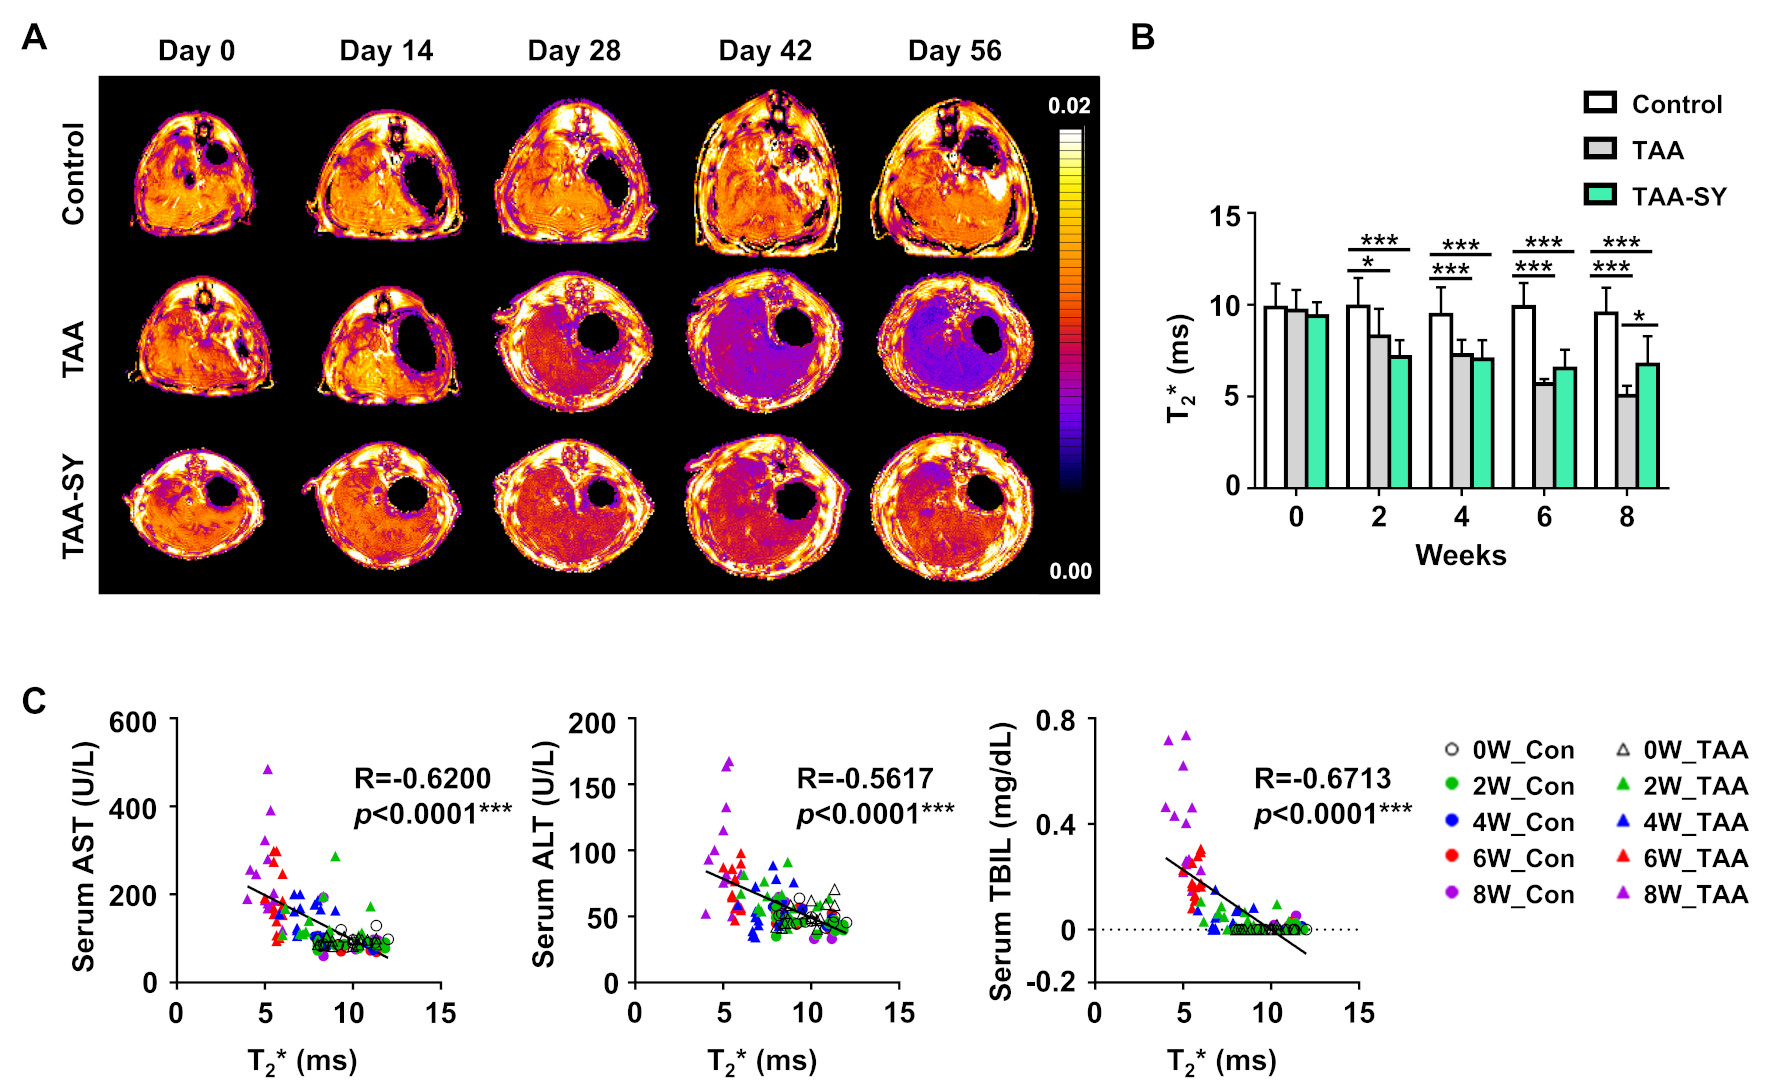
Figure 3. The T2* map following TAA and silymarin injection.
(A) Axial MRI was obtained for all groups. (B) The T2* was reduced in the TAA group compared to the control. Additionally, the TAA-SY group was increased at 6 and 8 weeks compared to the TAA group. (C) The T2* correlated with the expression of several hepatic enzymes.
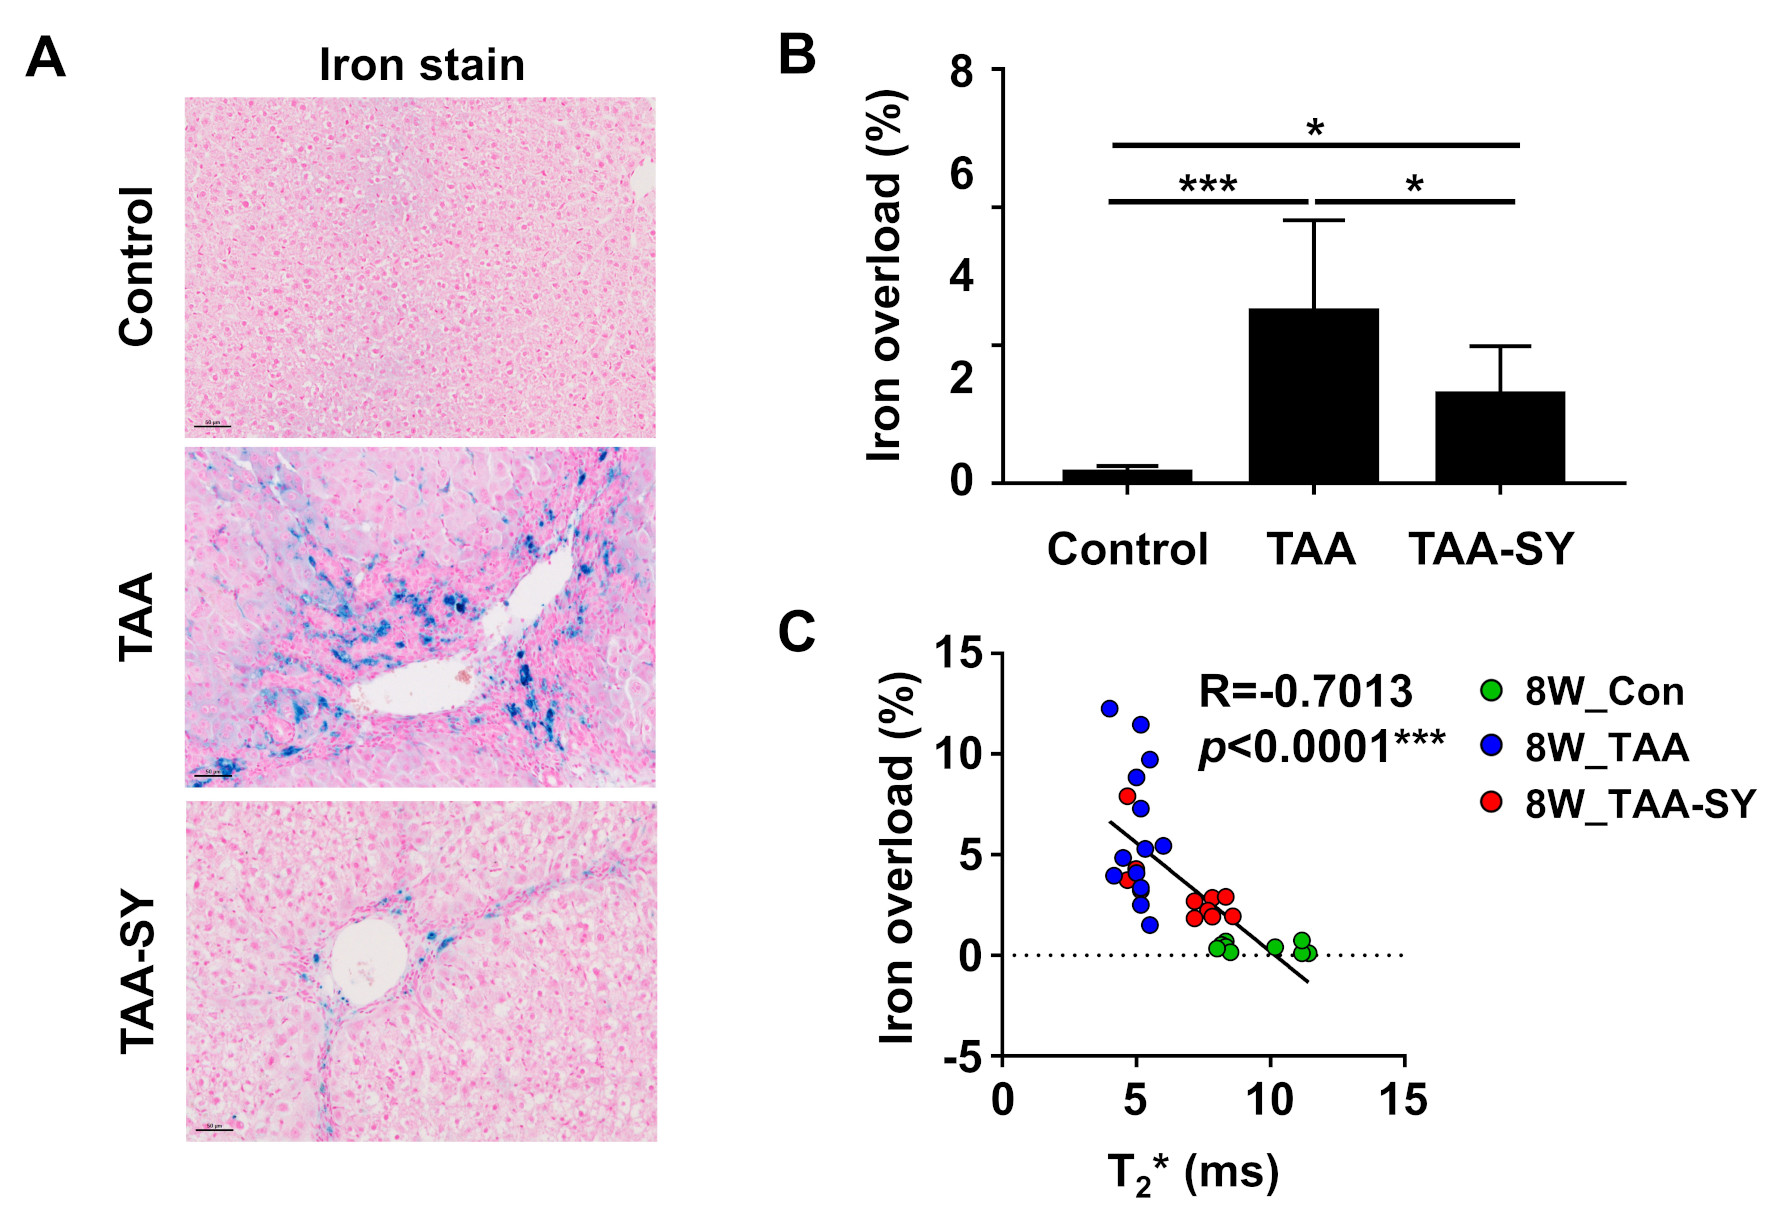
Figure 4. Changes in the iron overload in the TAA-SY group.
(A) To evaluate the iron accumulation, iron staining was performed. (B) The iron area significantly decreased in the TAA-SY group compared to the TAA group. (C) A negative correlation was revealed between the T2* values and iron overload (%).