4666
Predict MGMT promoter methylation and P53 gene status of glioma based on ADC Histogram Analysis1Henan Provincial People's Hospital, Zhengzhou, China, 2MR Collaboration,Siemens Healthineers Ltd., Beijing, China
Synopsis
Conventional MRI is limited in reflecting tumor genetic status. This study used the parameters derived from histogram analysis of apparent diffusion coefficient(ADC) maps in glioma lesion to predict the MGMT and P53 gene status. We found the ADC histogram derived parameters are significantly higher in MGHT-methylated and P53 wild group. ROC analysis revealed these parameters have high sensitivity to differentiate the MGHT-methylated/-unmethylated or P53 wild/ mutant gliomas. These findings suggest ADC histogram could be a good candidate for predicting MGMT promoter methylation and P53 gene status in gliomas.
Introduction
The 2016 World Health Organization Classification of Tumors of the Central Nervous System added genotyping to the pathological classification of gliomas[1]. Thus, the gene status plays an increasingly important role in the clinical diagnosis and treatment of glioma patients. The methylation status of the 06-methylguanine-DNAmethyhransferase (MGMT) promoter is an important marker of whether the chemotherapeutic agent temozolomide can work well, methylated glioma patients are more sensitive to chemotherapy, and have longer overall survival and progression-free survival after chemotherapy than unmethylated patients[2]. P53 is an important factor that inhibits tumor cell proliferation and is closely related to the degree of malignancy of gliomas. Therefore, detecting the MGMT and P53 status of gliomas preoperatively can provide important confidence in guiding treatment. Microscopic genetic changes may manifest as macroscopic morphological changes in the brain tumors that can be detected using magnetic resonance imaging (MRI), which can serve as noninvasive biomarkers for determining methylation of MGMT. However, conventional MRI is limited in reflecting tumor genetic status[3]. Diffusion weighted imaging that measured the motion of hydrogen nuclei in biological tissues on a microscopical scale, has been widely used to reflect histopathological properties of malignant tumors in vivo. Three-dimensional histogram analysis can extract more quantitative parameters from MRI images and has potential to detect more features of the whole tumor lesion[4]. Thus, the purpose of this study was to investigate the utility of ADC histogram parameters in predicting MGMT promoter methylation and P53 gene status in gliomas.Methods
Sixty-six patients (29 males, mean age 50.7 years) with clinically confirmed glioma were enrolled in this study. All patients underwent preoperative MRI on a 3T MR scanner (Siemens Prisma, Erlangen, Germany) using 20-channel head-neck coil. Diffusion MRI was performed with the following parameters: TR =4000ms, TE=130ms, matrix = 256x256, slices = 18, slice thickness = 6mm, FOV = 240x240 mm, b value = 1000 s/mm2, total acquisition time = 66s. The obatained apparent diffusion coefficient (ADC) image was imported into Firevoxel ( Firevoxel 289E;Center for Advanced Imaging Innovation and Research,New York University School of Medicine,NewYork,NY) for independent whole lesion histogram analysis. The Regions of interest were manually drawn slice by slice on the ADC map. Histogram analyses were automatically performed in the delineated ROI for each patient, and the following parameters were generated: total tumor volume (Volume), ADC minimum value (ADCmin), ADC maximum value (ADCmax), ADC mean value (ADCmean), ADC 25th percentile (ADC25th), ADC 50th percentile (ADC50th), ADC 75th percentile (ADC75th), bias, kurtosis and entropy. For each patient, MGMT promoter methylation and the status of the P53 gene were assessed by pyrosequencing and immunohistochemical staining after surgery, respectively. Based on the genotyping results, patients were divided into MGHT-methylated/-unmethylated groups or P53 wild-type group/ mutant group. Differences in the histogram derived parameters between groups were analyzed using the independent samples t-test or Mann-Whitney U test. Receiver operating characteristic (ROC) analysis was performed on single or pairwise combination of parameters to assess the diagnostic efficacy of the obtained statistically significant histogram parameters.Results
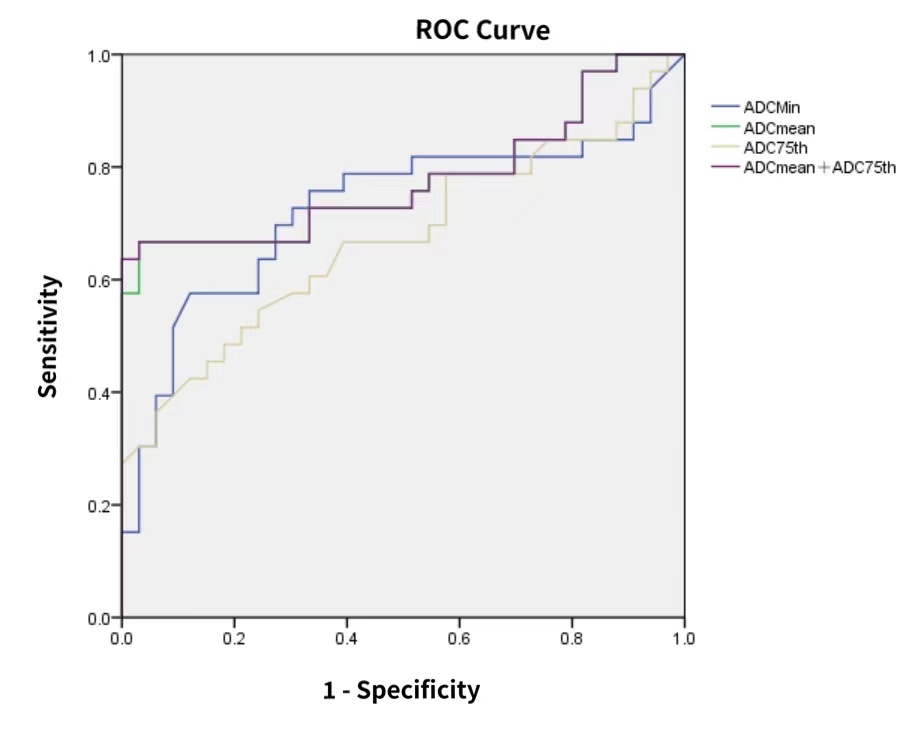
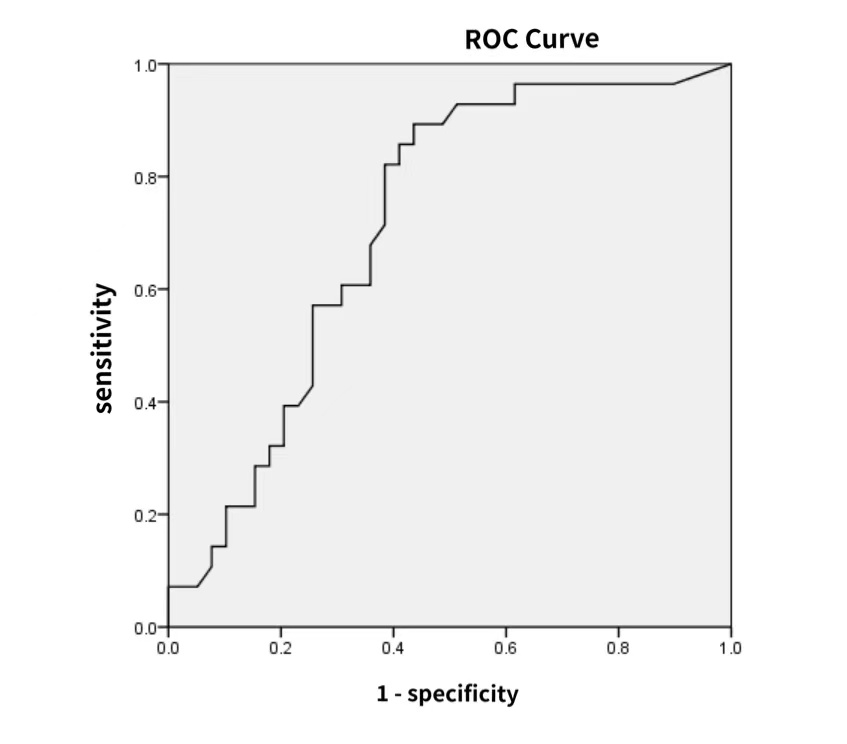
Figure 1 showed the MRI images from one 43-year-old female patient with glioblastoma and the histogram analysis procedure. Of the 66 patients, 33 patients had MGMT-methylated tumors and 33 patients had MGMT-unmethylated tumors. The ADCmin, ADCmean and ADC75h value in MGMT-unmethylated group were significantly lower than those in MGMT-methylated group (P = 0.048, 0.011, 0.013, respectively). ROC analysis for MGMT showed that ADCmean had the highest area under curve(AUC) of 0.778. The ROC analysis on pairwise combination of significant different parameters found that ADCmean combined with ADC75h had the highest AUC of 0.780 (Figure 2). Of the 66 glioma patients, 28 patients were P53 wild-type and 38 patients were P53 mutant type. ADCmin was significantly greater in the P53 wild-type group than in the P53 mutant group (P = 0.015). The diagnostic efficacy of ADCmin for judging P53 gene status was analyzed by ROC with an AUC of 0.715(Figure 3).Discussion and conclusion
This study found MGHT-methylated have significantly higher ADC-histogram derived parameters including ADCmin, ADCmean and ADC75h value than MGMT-unmethylated group glioma groups. Further ROC analysis indicated that ADCmean combined with ADC75h may effectively differentiate MGMT methylated and MGMT-unmethylated gliomas. Cell density is negatively correlated with ADC values, which can indirectly reflect the degree of tumor malignancy, manifesting as the greater the ADC value, the lower the degree of tumor malignancy. MGMT-methylated tumor cells had impaired proliferation[5], reduced tumor cellularity, and P53 inhibited tumor cell proliferation, which was consistent with the findings of higher values of ADC parameters in MGMT-methylation group and P53 wild-type group in this study. Thus, the parameters extracted from ADC histograms have potentials in predicting MGMT promoter methylation as well as P53 gene status in gliomas, and the combination of parameters can improve the predictive efficacy.Acknowledgements
This work was supported by the National Natural Science Foundation of China (81720108021).References
[1] Louis D N, Perry A, Reifenberger G, et al. The 2016 World Health Organization Classification of Tumors of the Central Nervous System: a summary[J]. Acta Neuropathologica, 2016, 131(6): 803-820. doi: 10.1007/s00401-016-1545-1. [2] Hegi M E, Liu L, Herman J G, et al. Correlation of O6-methylguanine methyltransferase (MGMT) promoter methylation with clinical outcomes in glioblastoma and clinical strategies to modulate MGMT activity[J]. Journal of Clinical Oncology, 2008, 26(25): 4189-4199. doi: 10.1200/JCO.2007.11.5964. [3]Rundle-Thiele D, Day B, Stringer B, et al.Using the apparent diffusion coefficient to identifying MGMT promoter methylation status early in glioblastoma: importance of analytical method. J Med Radiat Sci. 2015 Jun;62(2):92-8. doi: 10.1002/jmrs.103. Epub 2015 Apr 16. [4]Bäzner H, Gihr GA, Kalman M, et al. The value of whole lesion ADC histogram profiling to differentiate between morphologically indistinguishable ring enhancing lesions-comparison of glioblastomas and brain abscesses. Oncotarget. 2018 Apr 6;9(26):18148-18159. doi: 10.18632/oncotarget.24454. [5]Chen X, Zhang M, Gan H, et al. A novel enhancer regulates MGMT expression and promotes temozolomide resistance in glioblastoma. Nat Commun. 2018 Jul 27;9(1):2949. doi: 10.1038/s41467-018-05373-4.Figures
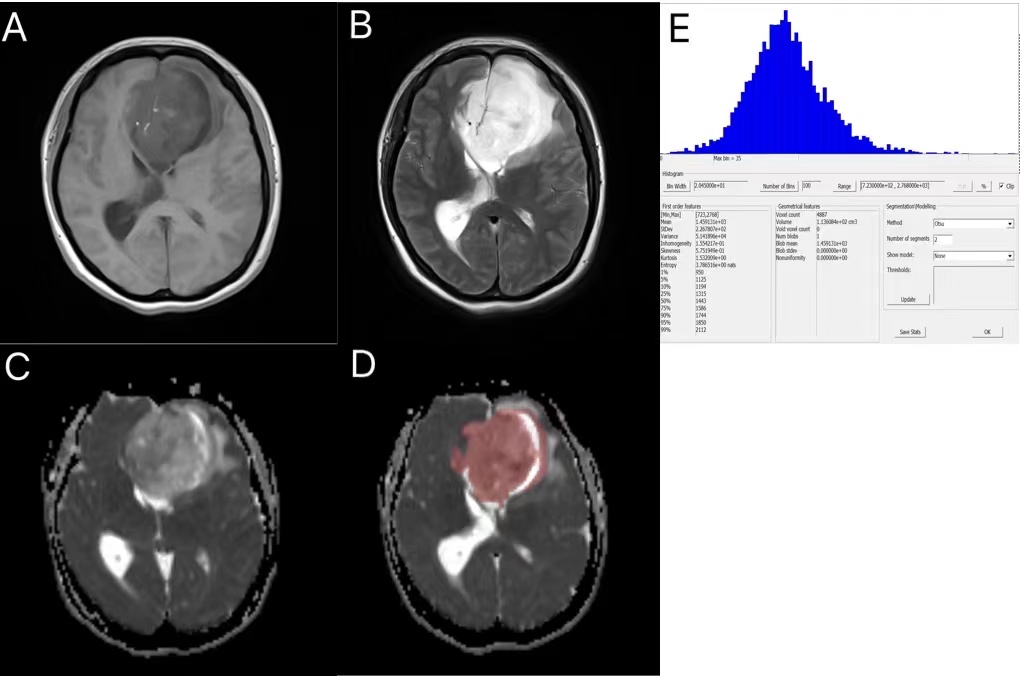
Figure 1. 43-year-old female patient with glioblastoma. A:The tumor showed a hypointense on the T1 image. B:The tumor showed a hyperintense on the T2 image. C:The tumor showed a mix signal on the ADC image.D:ROI was delineated on the ADC map by using Firevoxel software. E:Whole-lesion histogram.