4664
Evaluation of T1 and R2* Mapping in Diagnosis of Chronic Kidney Disease1the First Affiliated Hospital of Dalian Medical University, Dalian, China, 2Philips Healthcare, Beijing, China
Synopsis
Chronic kidney disease (CKD), which has shown increased incidence gradually, is prevalent worldwide and occurs in conjunction with cardiovascular disease and diabetes. Purpose of this study is to evaluate the value of quantitative T1 and R2* mapping in diagnosis of CKD. Results showed that renal cortex R2* and T1 values can be used to distinguish mild CKD from healthy volunteers, and the combination of them can improve the diagnostic efficiency. Cortex R2*, cortex T1, and medulla T1 values can be used to distinguish mild from severe CKD, and the diagnostic efficiency was also significantly improved by using their combination.
Summary of Main Findings
Renal cortex R2* combined with cortex T1 values has a high diagnostic efficiency to distinguish mild CKD from healthy volunteers; and renal cortex R2* combined with cortex and medulla T1 values can improve the diagnostic efficiency between mild and severe CKD.INTRODUCTION
Chronic kidney disease (CKD), that brings a huge burden to families and the society, is characterized of high incidence, poor treatment outcomes, and high treatment costs. 1 Early detection of CKD is of great significance for positive clinical outcomes. The R2* (1/T2*) value is associated with the oxygenation level and/or iron accumulation in tissues.2 Besides, T1 mapping, which has been evaluated in diagnosis of various heart diseases3, can reflect edema, fibrosis, and invasive changes in tissues. Previous studies had shown that the degree of renal fibrosis in the CKD model is positively correlated with the T1 value.4 Renal hypoxia and fibrosis are the main reasons for the progression of CKD, and their combined effects might further aggravate the kidney damage.1 The purpose of this study was to explore the performance of R2* and T1 mapping in diagnosis of CKD.METHED
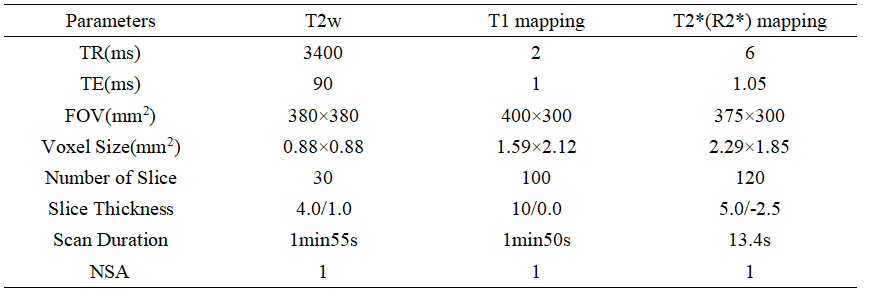
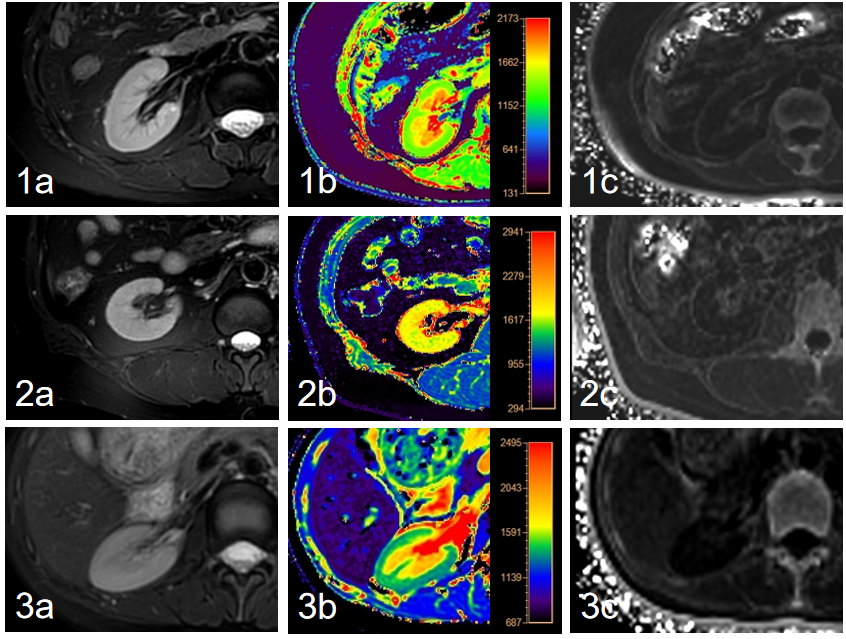
27 CKD patients and 20 healthy volunteers (7 males, mean age: 33.40±11.06 years, range: 24-60 years) were included in this study. CKD patients were divided into mild (phase 1-2: 16 patients; 9 males, mean age: 53.06±17.26 years, range: 23-77 years) and severe CKD (phase 3-5:16 patients; 9 males, mean age: 47.91±16.31 years, range: 29-78 years) groups according to their estimated glomerular filtration rate. All participants underwent T1 and T2* (R2*) mapping scans of kidney on a 3.0 T MR scanner (Ingenia CX, Philips Healthcare, Best, the Netherlands). T2-weighted (T2w) images were scanned as reference. Detailed scan parameters were listed in Table 1. With fusion of T1 and R2* mapping images respectively with T2w images on the platform of Intelli space Portal (Philips Healthcare), the regions of interest (ROIs) were manually drawn on the renal cortex and medulla of three slices (including the slice covering the largest dimension of kidney and its adjacent upper and lower slices) on the right kidney, with an area about 5-7 mm2, avoiding the renal collection system. Statistical analyses on the measured mean T1 and R2* values were carried out with SPSS 26.0 software (IBM). Mann-Whitney U test was used to compare the difference of renal cortex and medulla R2* values among three groups. Diagnostic performances of T1 mapping, R2* mapping, and their combination for CKD diagnoses were evaluated by receiver operating characteristic (ROC) analyses.RESULTS
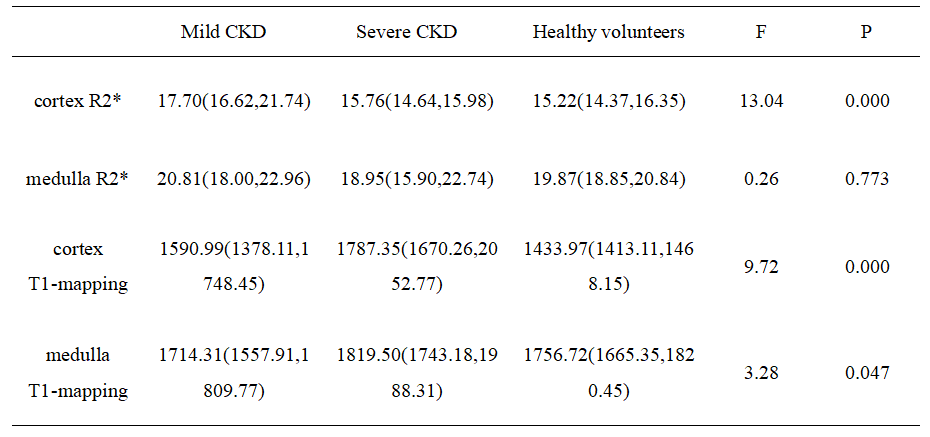
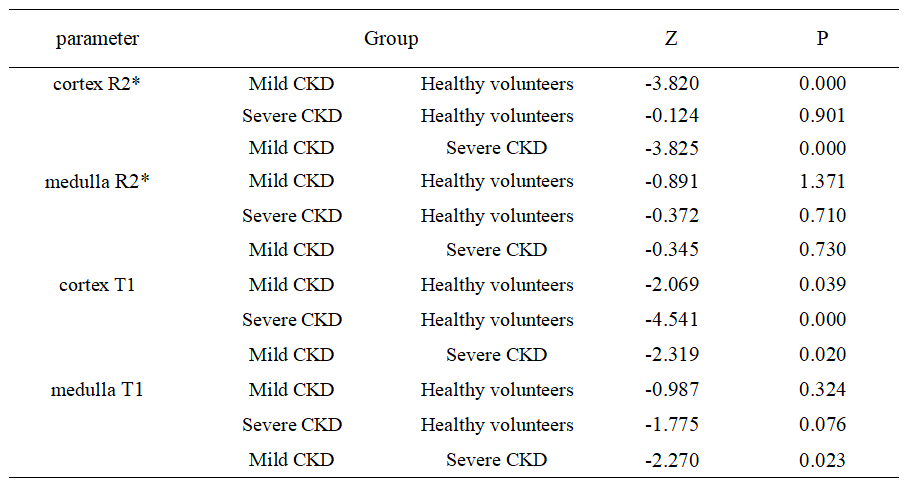
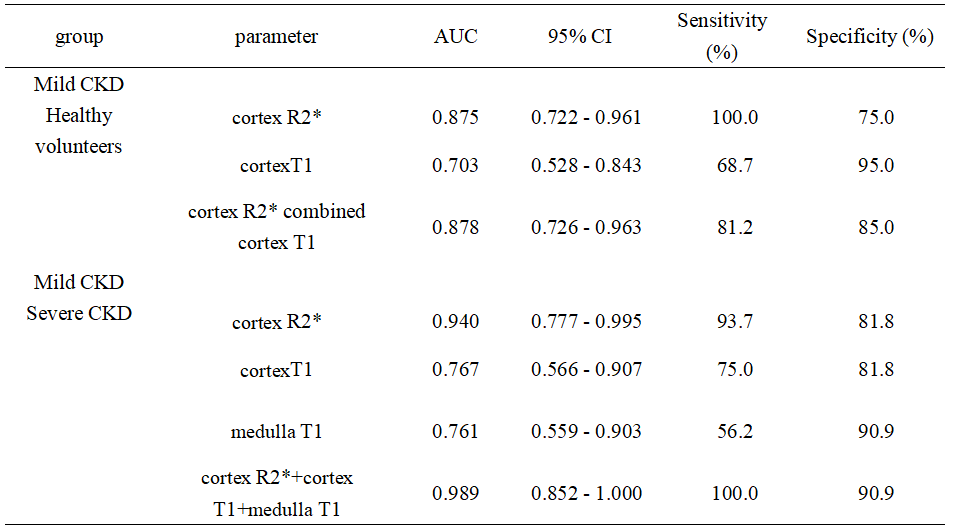
Renal cortex T1 and R2* values of mCKD group was significantly higher than those of the control group (Table 2). Cortex R2* values was significantly higher, and cortex and medulla T1 values was significantly lower in the mCKD group than sCKD group (Table 2). The AUC values for the ROC analyses of cortex T1 and R2* values for differentiation between heathy control and mCKD patient groups was 0.703 and 0.875, respectively, and the AUC value was improved to be 0.878 by the combination of two values with a sensitivity of 81.2% and specificity of 85.0% (Table 3). The AUC values of cortex R2*, cortex and medulla T1 values for differentiation between sCKD and mCKD groups was 0.940,0.767 and 0.761, respectively. The combination of them improved the diagnostic efficiency and showed an AUC value of 0.989 with a sensitivity of 100.0% and specificity of 90.9% (Table 3).DISCUSSION AND CONCLUSION
The renal cortex R2* values in the mCKD group were significantly higher than those in the healthy control and the sCKD group, which might be due to the positive correlation between the level of renal damage and the degree of hypoxia. The cortex T1 values were significant different between each two of the sCKD, mCKD, and healthy control groups, with the highest values in the sCKD group. The medulla T1 values in the mCKD group were significantly lower than those in the sCKD group. These might be due to the fact that the degree of renal damage was positively correlated with the degree of renal fibrosis and edema. Medulla R2* showed no significant difference among groups, which might indicate that the compensatory degree for hypoxia in medulla was superior to that in cortex. The combination of T1 and R2* mapping can simultaneously reflect kidney edema, fibrosis degree and oxygen content, and its diagnostic efficiency is superior to that of each single one of them, thus contributing to the early diagnosis of CKD.Acknowledgements
No acknowledgement found.References
1. Ma XM, He JW, Chang FX, et al. Research progress of functional magnetic resonance imagingin chronic kidney disease. Chin J Magn Reson Imaging, 2020, 11(10): 950-953.
2. Srivastava A, Cai X, Lee J, et al. Kidney Functional Magnetic Resonance Imaging and Change in eGFR in Individuals with CKD. Clin J Am Soc Nephrol. 2020;15(6):776-783.
3. Luo F, Liao Y, Cui K, Tao Y. Noninvasive evaluation of renal oxygenation in children with chronic kidney disease using blood-oxygen-level-dependent magnetic resonance imaging. Pediatr Radiol. 2020;50(6):848-854.
4. Zhou Di, Zhao Shihua, Lu Minjie. Progress of myocardial T1-mapping: imaging technology and clinical application. Radical Practice, 2020, 35(07):933-938.
Figures