4663
Radiomics Analysis of Multi-sequence MR Imaging for Staging Liver Fibrosis and Hepatitis Activity of Chronic Hepatitis B1Affiliated Nantong Hospital 3 of Nantong University, Nantong, Jiangsu, China, 2Affiliated Hospital of Nantong University, Nantong,Jiangsu, China, 3Philips Healthcare, Shanghai, China
Synopsis
Synopsis: The purpose of this study was to explore the evaluation value of liver fibrosis staging and hepatitis activity of chronic hepatitis B based on multi-sequence MRI radiomics model. Unenhanced T2WI, T1WI and Gd-EOB-DTPA enhanced T1WI, including AP, PP, TP and HBP, were acquired. And a multi-sequence MRI radiomics model were built. We used receiver operating characteristic (ROC) curves for the diagnostic performance of each sequence and the combination of these six sequences in the training set and validated with the validation set. The models combined with six sequences performed the best.
INTRODUCTION
Liver fibrosis is a key step of the development of chronic liver disease into cirrhosis and liver cancer, and it is the result of abnormal deposition of extra cellular matrix (ECM). Radiomics is a method to extract quantitative features from specific regions of interest (ROI) in medical images. The purpose of this study was to explore the evaluation value of liver fibrosis staging and hepatitis activity of chronic hepatitis B based on multi-sequence MRI radiomics model.PURPOSE
To explore the evaluation value of liver fibrosis staging and hepatitis activity of chronic hepatitis B based on multi-sequence MRI radiomics model.METHODS
A total of 136 patients with chronic hepatitis B who underwent 3.0T MR examination from August 2016 to June 2020 and confirmed the Scheuer-Ludwig staging of liver fibrosis were included, including the S1 (n = 26), S2 (n = 23), S3 (n = 35), S4 (n = 52) groups, and the G0 (n = 10), G1 (n = 54), G2 (n = 37), G3 (n = 35) groups. Unenhanced T2 weighted images (T2WI), unenhanced T1 weighted image (T1WI) and Gd-EOB-DTPA enhanced T1WI (including arterial phase (AP), portal phase (PP), transitional phase (TP), hepatobiliary phase (HBP)) of the entire liver, were acquired on a 3.0T MRI scanner. The radiomics characteristics of each image and the combination of these six images were extracted. The patients were divided into training set and validation set according to the ratio of 7:3. The LASSO algorithm was used to select important variables from the radiomics features(Figure 1,2). Multiple logistic regression was used to construct radiomics based on each sequence. The models of hepatic fibrosis(S≥3)and hepatitis activity(G≥2)were established respectively and receiver operating characteristic (ROC) curves were performed for the diagnostic performance of each sequence and the combination of these six sequences in the training set and validated with the validation set.RESULTS
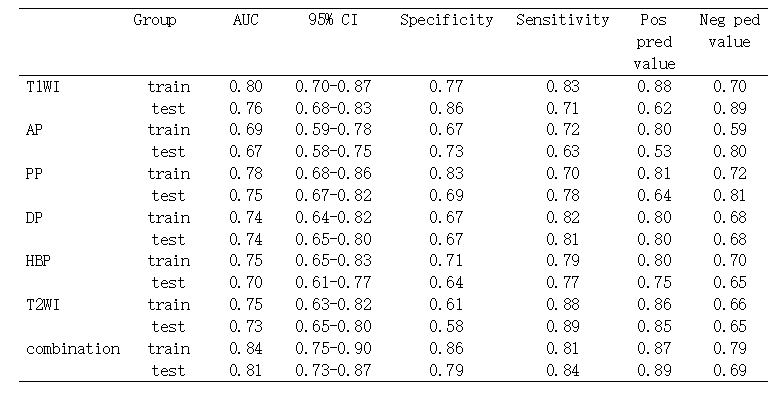
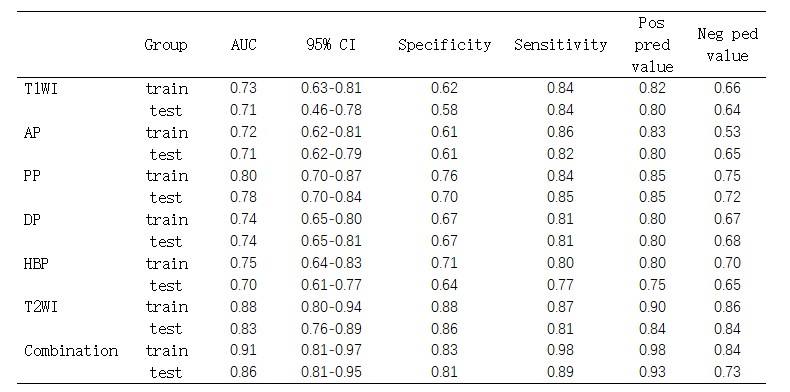
For the diagnosis of liver fibrosis(S≥3),the area under the curve (AUC) of each sequence of T2WI, T1WI Unenhanced scan, AP, PP, TP, HBP and the combination of these 6 sequences in the training set (validation set) were 0.80 (0.76), 0.69 (0.67), 0.78 (0.75), 0.74 (0.74), 0.75 (0.70), 0.75 (0.73), 0.84 (0.81), respectively(Table 1). For the diagnosis of hepatitis activity(G≥2),the AUC of each sequence of T2WI, T1WI Unenhanced scan, AP, PP, TP, HBP and the combination of these 6 sequences in the training set (validation set) were 0.88 (0.83),0.73 (0.71), 0.72 (0.71), 0.80 (0.78), 0.74 (0.74), 0.75 (0.70), 0.91 (0.86), respectively(Table 2). The optimal models for diagnosing liver fibrosis(S≥3)and hepatitis activity(G≥2)in the training set and validation set were the models combined with these six sequences.DISCUSSION
Multimodal MR imaging including magnetic resonance elastography and diffusion weighted imaging was valuable in the diagnosis of liver fibrosis, but it had not been widely used in clinic. Radiomics is a method to extract quantitative features from specific regions of interest (ROI) in medical images. It had been used in the prediction, classification and staging of various diseases1-3. In recent years, the research of radiomics in liver fibrosis had gradually increased 4-7. Some studies had verified the potential value of radiomics based on MRI sequence in the staging of liver fibrosis. Zhao et al4. found that unenhanced MRI based on out of phase T1W, in phase T1W, and T2W images could be used to classify early liver fibrosis. Park et al6. and others7found that the radiomics model based on gadoxetic acid enhanced MRI in hepatobiliary phase could be used for accurate staging of liver fibrosis. However, these research was only limited to liver fibrosis, and there were few studies on the hepatitis activity of chronic hepatitis B. The purpose of this study was to explore the evaluation value of liver fibrosis staging and hepatitis activity of chronic hepatitis B based on multi-sequence MRI radiomics model. Our study showed that the area under the curve (AUC) of each sequence of T2WI, T1WI unenhanced scan, AP, PP, TP, HBP and the combination of these 6 sequences in the training set (validation set) for diagnosing liver fibrosis(S≥3)were 0.80 (0.76), 0.69 (0.67), 0.78 (0.75), 0.74 (0.74), 0.75 (0.70), 0.75 (0.73), 0.84 (0.81), respectively, and the AUC of each sequence and the combination of these 6 sequences in the training set (validation set) for the diagnosis of hepatitis activity(G≥2)were 0.88 (0.83),0.73 (0.71), 0.72 (0.71), 0.80 (0.78), 0.74 (0.74), 0.75 (0.70), 0.91 (0.86), respectively. The optimal models for diagnosing liver fibrosis(S≥3)and hepatitis activity(G≥2)in the training set and validation set were the models combined with these six sequences.CONCLUSIONS
Radiomics analysis of multi-sequence MR imaging was valuable in staging liver fibrosis and hepatitis activity of chronic hepatitis B.Acknowledgements
No acknowledgement found.References
[1] Zhang Y, Ko CC, Chen JH, et al. Radiomics approach for prediction of recurrence in non-functioning pituitary macroadenomas[J]. Front Oncol, 2020, 10:590083.
[2] Fusco R, Piccirillo A, Sansone M, et al. Radiomics and artificial intelligence analysis with textural metrics extracted by contrast-enhanced mammography in the breast lesions classification[J]. Diagnostics (Basel), 2021, 11(5):815.
[3] Solari E L , Gafita A , Schachoff S , et al. The added value of PSMA PET/MR radiomics for prostate cancer staging[J]. Eur J Nucl Med Mol Imaging, 2021. doi: 10.1007/s00259-021-05430-z. Epub ahead of print. PMID: 34255130.
[4] Zhao R, Gong XJ, Ge YQ, et al. Use of texture analysis on noncontrast MRI in classification of early stage of liver fibrosis[J]. Can J Gastroenterol Hepatol, 2021, 2021:6677821.
[5] Zheng R, Shi C, Wang C, et al. Imaging-Based staging of hepatic fibrosis in patients with hepatitis B: a dynamic radiomics model based on Gd-EOB-DTPA-Enhanced MRI[J]. Biomolecules, 2021, 11(2): 307.
[6] Park HJ, Lee SS, Park B, et al. Radiomics analysis of Gadoxetic Acid-enhanced MRI for staging liver fibrosis[J]. Radiology, 2019 , 290(2): 380-387.
[7]Marti-Aguado D, Rodríguez-Ortega A, Alberich-Bayarri A, et al. Magnetic resonance imaging analysis of liver fibrosis and inflammation: overwhelming gray zones restrict clinical use[J]. Abdom Radiol (NY), 2020, 45(11): 3557-3568.
Figures
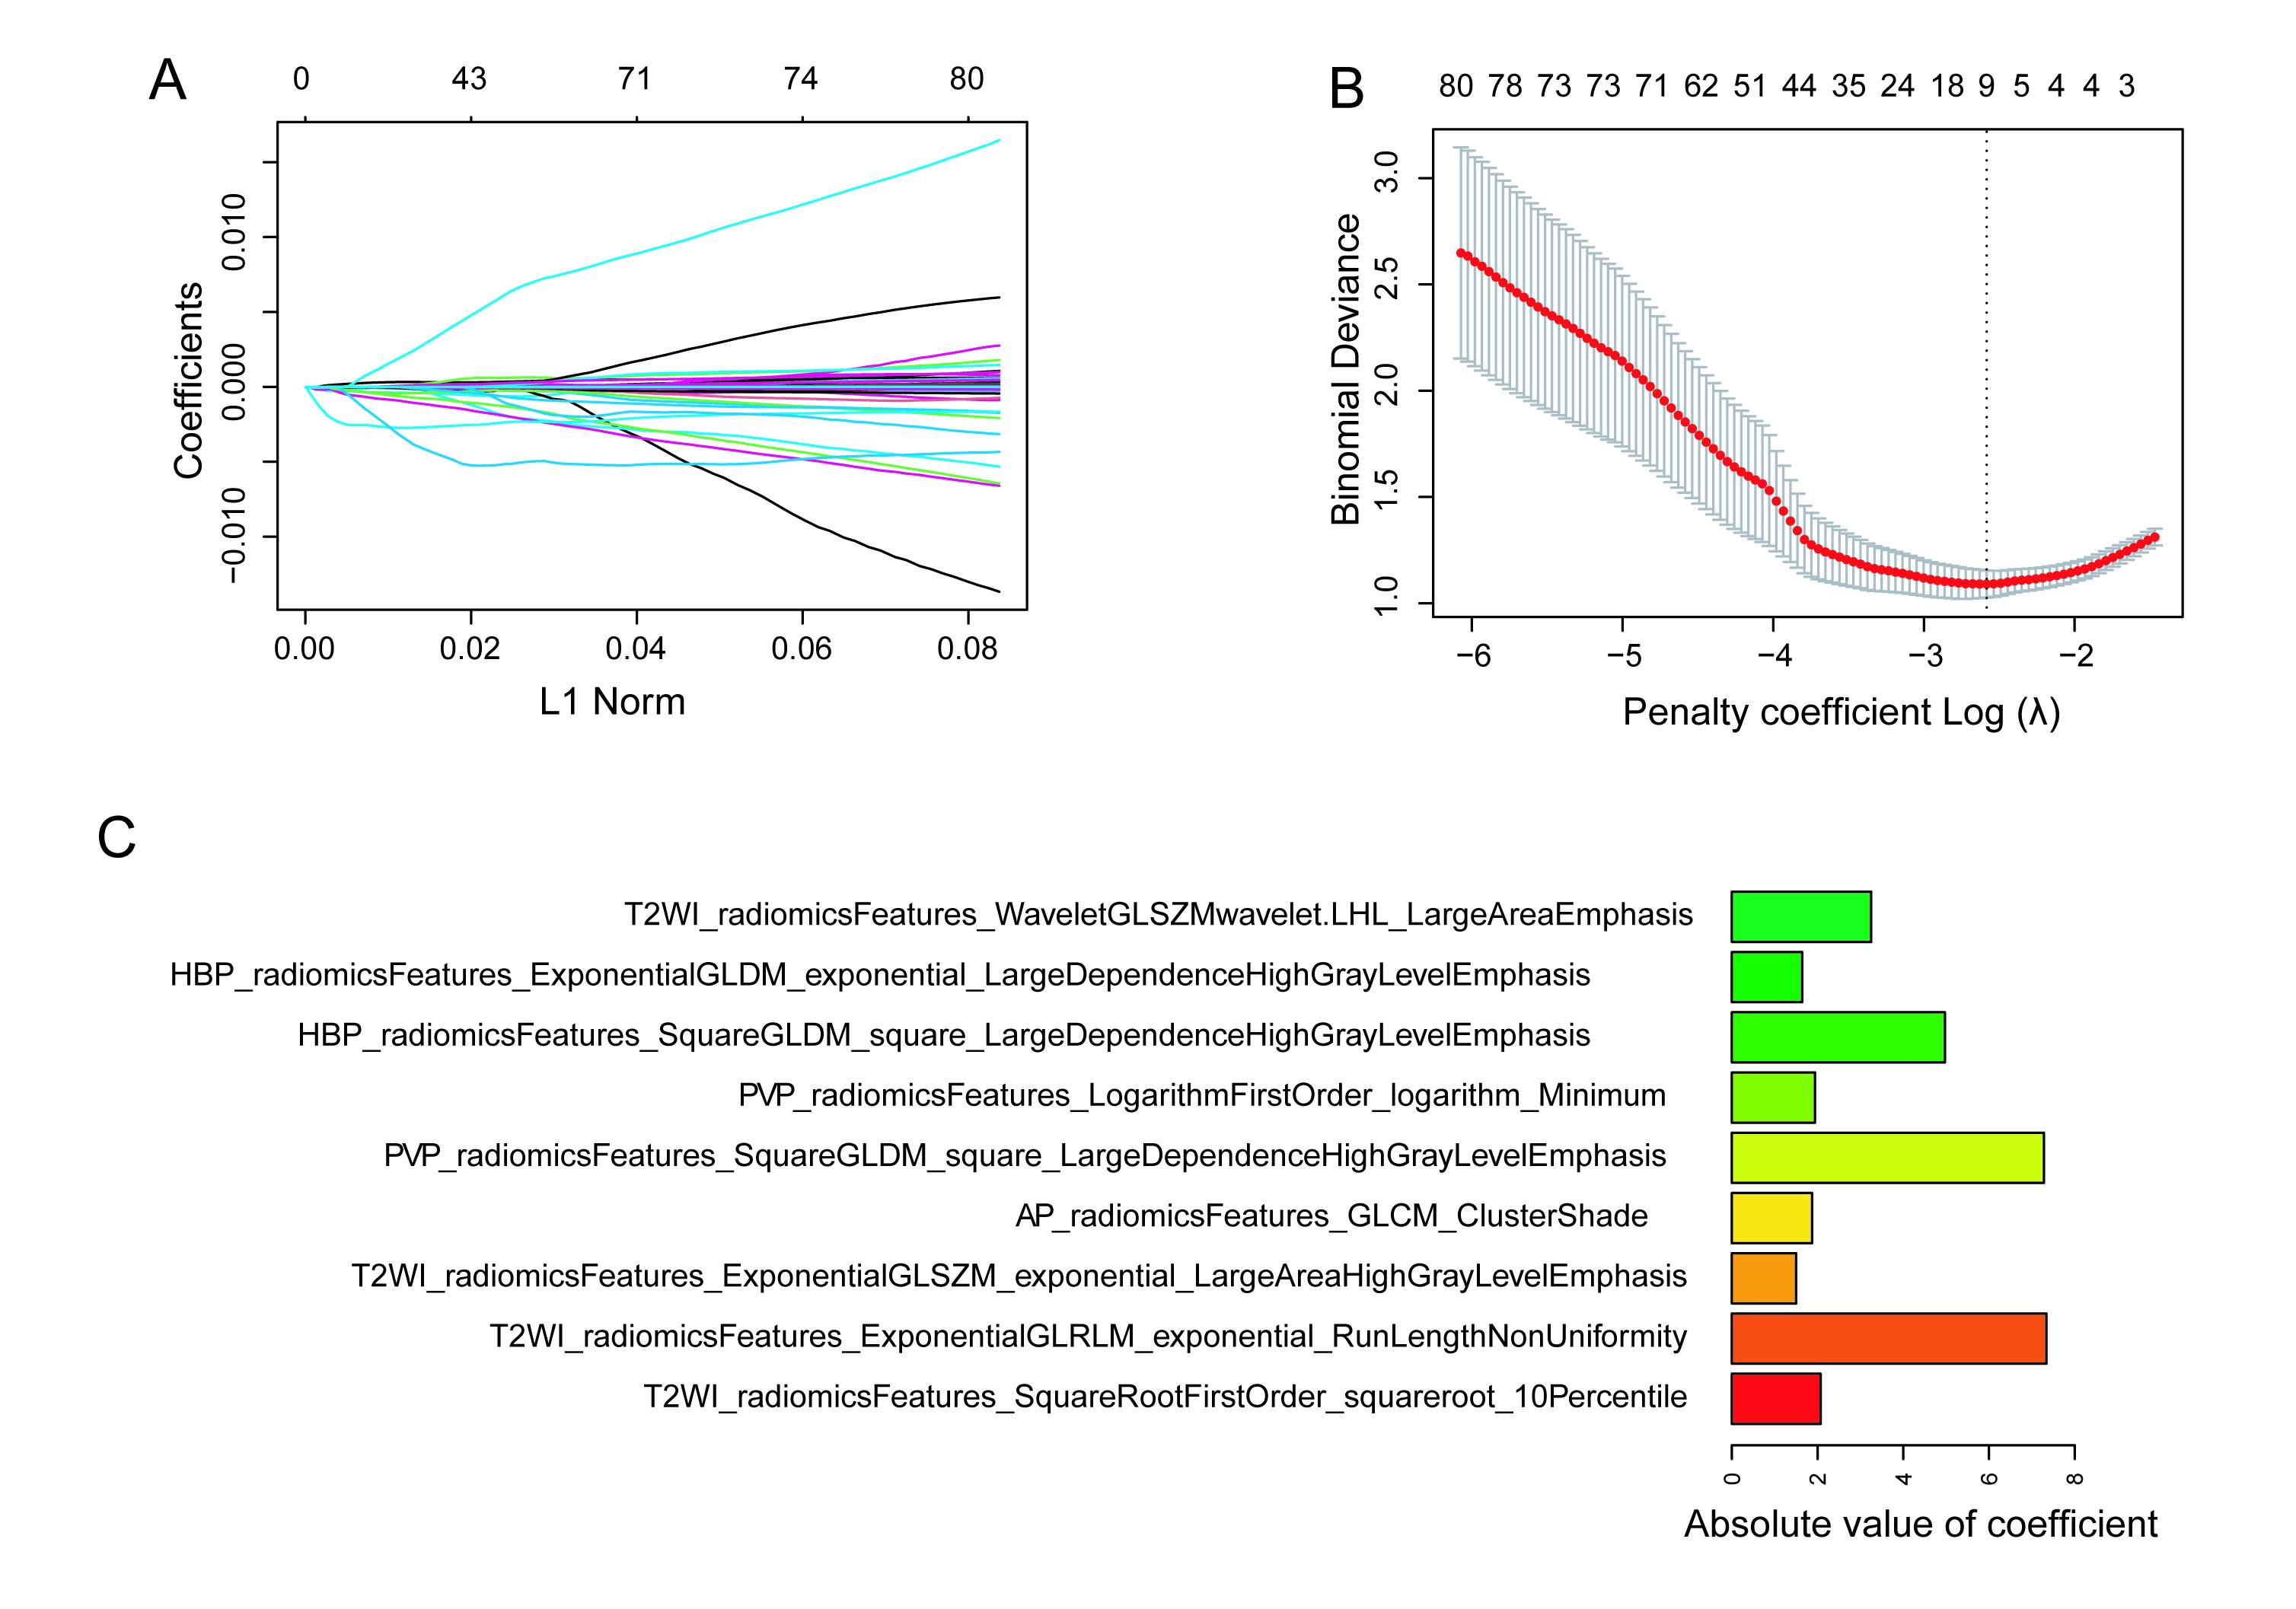
Figure 1 For the diagnosis of liver fibrosis, A: the variation of the coefficient of the variable with the penalty coefficient (λ); B: Choose the best penalty coefficient by using 10-fold cross verification. By adjusting the value of λ, 9 variables were selected to construct the combination model (dotted line in figure) when the binomial deviation was the smallest (minimum standard). C: The final variables were selected.