4660
Detection of Early Cirrhosis by Means of Curvature Analysis of Liver Surface Nodularity in MRI1the First Affiliated Hospital of Dalian Medical University, Dalian, China, 2Capital Normal University, Beijing, China, 3Dalian University of Technology, Dalian, China
Synopsis
The normal liver is affected by various pathogenic factors, resulting in liver fibrosis, progressive disease, false lobule formation and cirrhosis. Liver cirrhosis will be accompanied by morphological changes of liver. Literature studies have shown that liver surface nodularity can be used to evaluate the progress of liver cirrhosis and predict the stage of liver cirrhosis. The method of curvature analysis of liver surface nodules adopted by our team is feasible and can be used to evaluate early cirrhosis.
The normal liver is affected by various pathogenic factors, resulting in liver fibrosis, progressive disease, false lobule formation and cirrhosis. Liver cirrhosis will be accompanied by morphological changes of liver. Literature studies have shown that liver surface nodularity can be used to evaluate the progress of liver cirrhosis and predict the stage of liver cirrhosis. The method of curvature analysis of liver surface nodules adopted by our team is feasible and can be used to evaluate early cirrhosis.
Introduction
Liver cirrhosis is a difficult clinical challenge. Early diagnosis of liver cirrhosis is very important for the treatment and prognosis of patients[1,2]. Liver biopsy is an invasive test with risks of procedure-related morbidity and mortality[3]. The purpose of this study is to analyze the curvature information of liver surface nodules in patients with liver cirrhosis based on magnetic resonance images, and then to detect early liver cirrhosis.
Methods
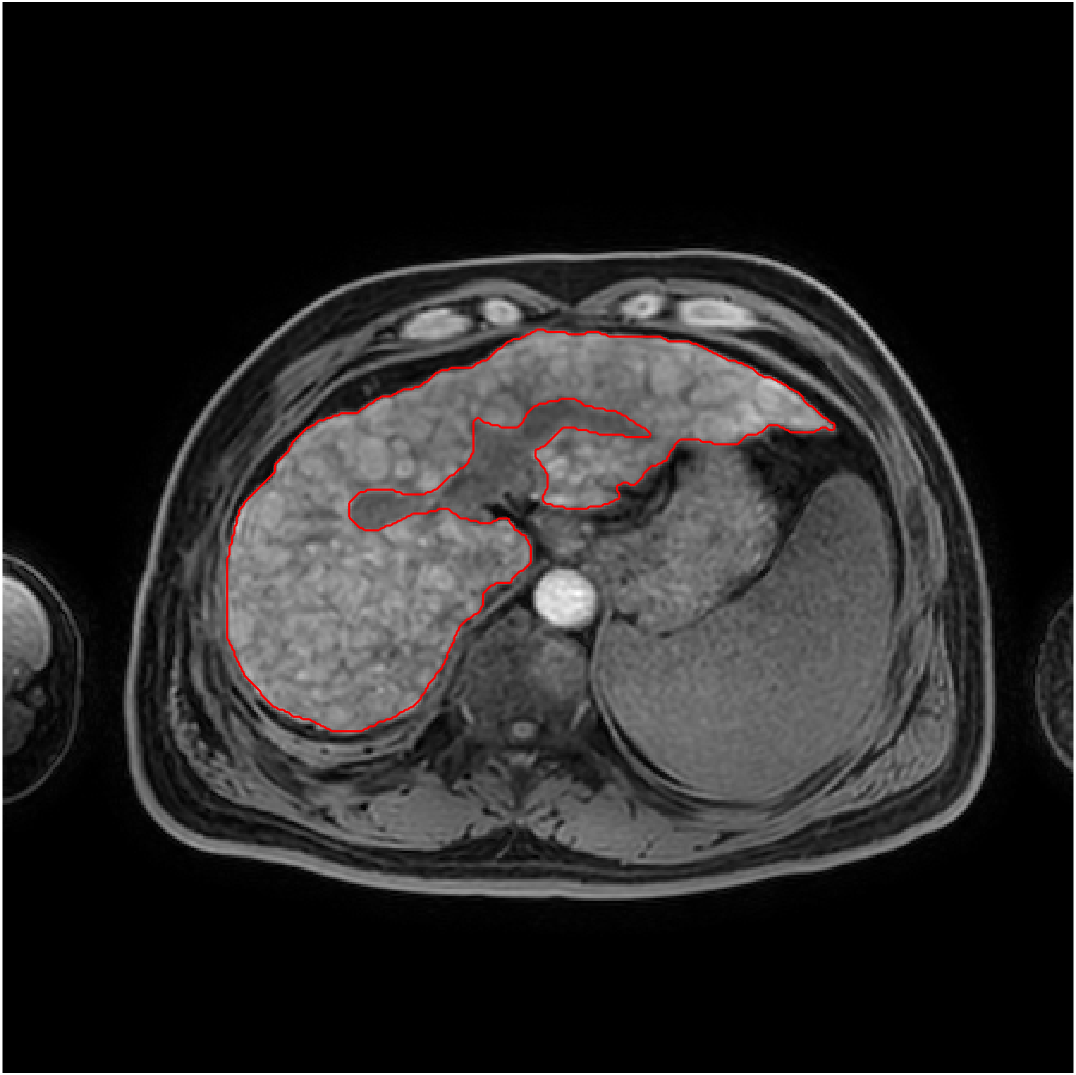
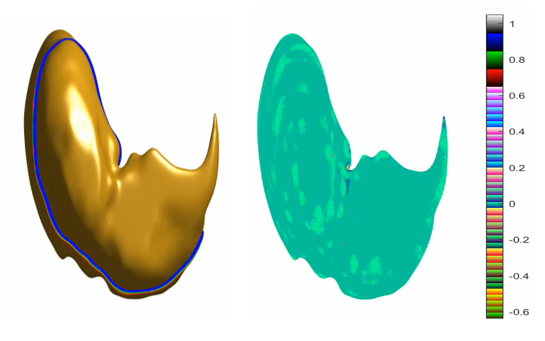
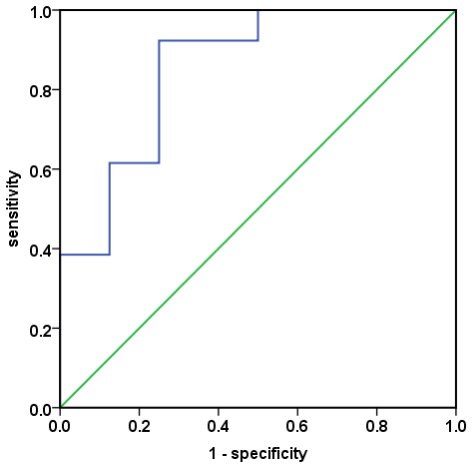
This retrospective study included 21 patients with clinically diagnosed liver cirrhosis were retrospectively selected for this study. Liver function-related tests were recorded for patients. Exclusion criteria were: a. incomplete clinical laboratory test data or a more than 5-day difference between dates of clinical tests and MRI scans; b. patients after liver surgery; c. intrahepatic occupancy lesions. Finally, there were 8 cases of early cirrhosis and 13 cases of middle and late cirrhosis. Imaging was performed on a 3.0T MR scanner. The MR protocols included a 3D-mDIXON sequence of liver. The radiologist uses ITK software to manually sketch the whole liver layer and export it in nii file format (Figure1). Follow-up processing with matlab software. We first extract the boundary of the labeled liver , then construct a Signed Distance Function (SDF) with , and finally calculate the gauss curvature of isosurface . All processes above can be calculated in time complexity, where is the number of voxels. The sum of the absolute value of gauss curvature on liver boundary can be served as a measure of liver cirrhosis. It has been proved that gauss curvature is invariant under rotation or even isometric transformation (Figure2). The curvature value of different groups were measured by Mann Whitney U test on spss 22.0 (IBM) platform. Area under curve (AUC) was obtained by drawing receiver operating characteristic (ROC) curve (Fig 3) to analyze the diagnostic efficiency. The sensitivity and specificity of the optimal threshold were calculated.
Results
The curvature value of liver surface increases with the severity of liver cirrhosis. The curvature value of early cirrhosis was less than that of middle and late cirrhosis (P<0.05). The AUC of curvature value was 0.856. The sensitivity and specificity was 92.3%, 75% (Figure 3).
Conclusion and Discussion
The method of obtaining the surface curvature value of liver is reliable, which can preliminarily evaluate early cirrhosis. The change of liver surface curvature is related to the progress of liver cirrhosis.
Acknowledgements
No.References
1. Catania Roberta,Furlan Alessandro,Smith Andrew D et al. Diagnostic value of MRI-derived liver surface nodularity score for the non-invasive quantification of hepatic fibrosis in non-alcoholic fatty liver disease.[J] .Eur Radiol, 2021, 31: 256-263.
2. Souhami Alexandra,Sartoris Riccardo,Rautou Pierre-Emmanuel et al. Similar performance of liver stiffness measurement and liver surface nodularity for the detection of portal hypertension in patients with hepatocellular carcinoma.[J] .JHEP Rep, 2020, 2: 100147.
3. Smith Andrew D,Branch Cody R,Zand Kevin et al. Liver Surface Nodularity Quantification from Routine CT Images as a Biomarker for Detection and Evaluation of Cirrhosis.[J] .Radiology, 2016, 280: 771-81.
Figures