4658
Noninvasive Assessment of Chronic Hepatitis B with Different Courses or Liver Cirrhosis Patients Receiving Interferon Therapy Using T1ρ Mapping1Southeast University, Nanjing, China
Synopsis
The staging of chronic hepatitis B mainly relies on invasive pathological biopsy, interferon treatment can reduce the risk of deterioration. 93 patients were divided into three groups: mild, moderate, severe or liver cirrhosis according to histopathology and received T1ρ magnetic resonance liver scan before and after interferon treatment. With the aggravation of chronic hepatitis B, T1ρ relaxation time gradually increased, but it decreased significantly after treatment, which is linearly correlated with the level of ALT and AST. T1ρ magnetic resonance can non-invasively assess the severity of the chronic hepatitis B and monitor the improvement of fibrosis after receiving treatment dynamically.
INTRODUCTION
More than 240 million individuals worldwide are infected with chronic hepatitis B virus (HBV), 15% to 40% may progress to cirrhosis and hepatic cellular cancer1-2. Treatment with interferon can postpone even reverse the process of liver fibrosis to significant reduce the risk of cirrhosis and hepatocellular carcinoma3. Determining the histologic severity of chronic hepatitis mainly relies on the invasive biopsy followed by the pathological evaluation4. However, biopsy can be only performed in a few small sampling areas with information limited in those selected regions due to the heterogeneity of the liver. It is also not practical to have the biopsy repeatedly on chronic hepatitis patients due to coagulation dysfunction5-6. There is a high correlation between liver T1ρ relaxation times of magnetic resonance (MR) imaging and liver fibrosis stages7-8, it may become a potential tool for non-invasive dynamic quantitative assessment of liver changes and therapeutic effects of clinical patients with different stages of chronic hepatitis B or cirrhosis.METHODS
A total of 93 patients who hospitalized in the Gastroenterology Department were prospectively collected from December 2014 to December 2018 because of the chronic hepatitis in the study. A percutaneous right lobe liver biopsy was performed in all enrolled patients. All participants were divided into three groups based on diagnostic criteria of liver histopathology: mild chronic hepatitis (Mild, G1-2S0-2, n=44), moderate chronic hepatitis (Moderate, G3S1-3, n=26), severe chronic hepatitis or cirrhosis (Severes or Cirrhosis, G4S2-4, n=23). All enrolled patients received interferon therapy for one year. The liver images of everyone in the group was examined by 3.0T whole-body MR scanner (MAGNETOM Verio; Siemens Medical Solutions) before receiving treatment. The scanning sequence included T2-weighed images and T1ρ with the range covers the right posterior of the liver under the gallbladder. Three circular central region of interest (ROI) of 3 cm diameter were placed to measure the T1ρ relaxation time, avoiding large blood vessels and visible artifacts. The T1ρ maps were computed on a pixel-by-pixel basis using a monoexponential decay model created with MatLab (MathWorks, Natick, MA). Among them, 26 patients had a MR scan again after receiving one year treatment.RESULTS
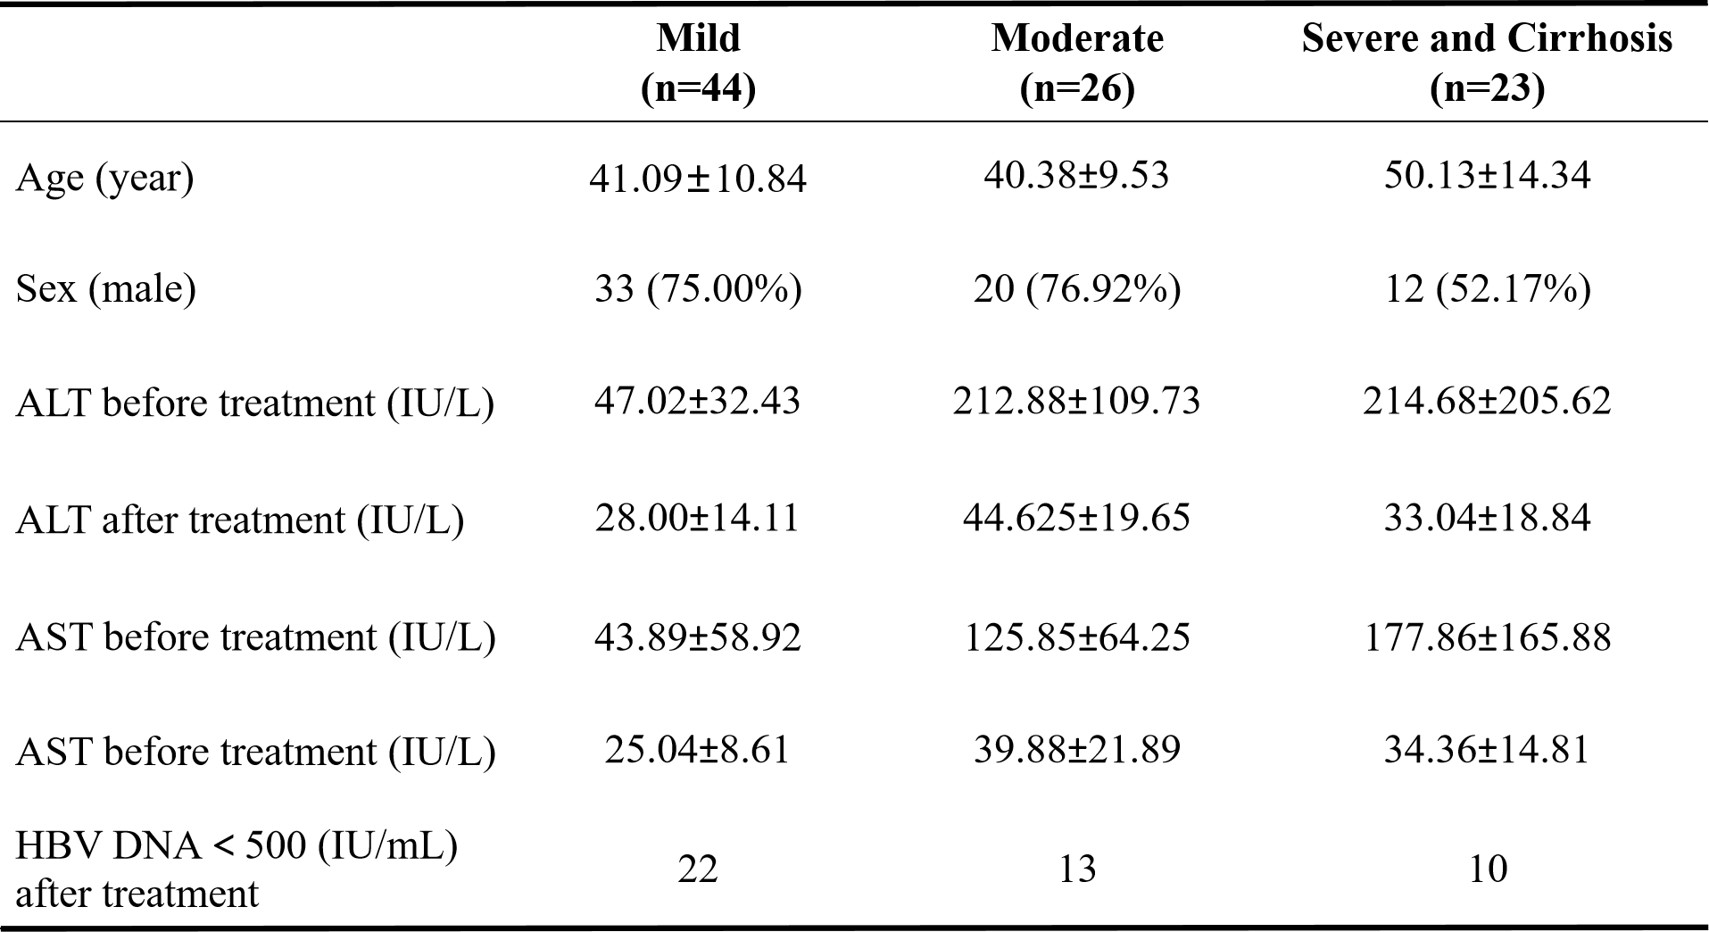
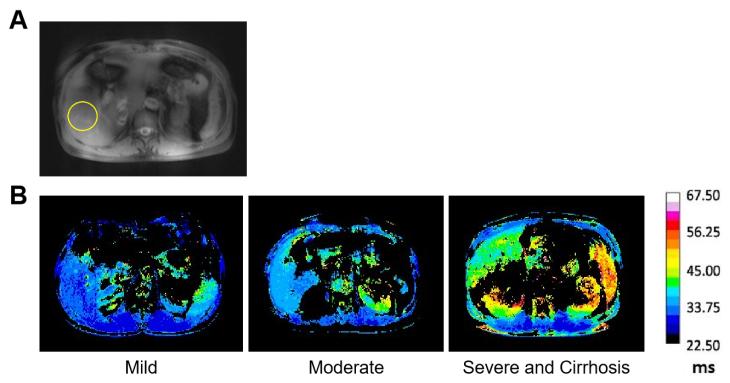
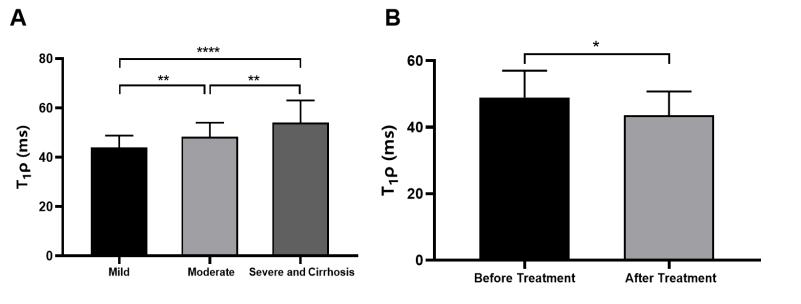
Figure 1 summarizes the clinical characteristics of the three groups. Examples of the T1ρ maps from the subjects selected in different groups are shown in Figure 2. The average T1ρ relaxation time of the liver in the Mild, Moderate, Severes or Cirrhosis were 41.89±4.88 ms, 48.21±5.78 ms, 53.99±9.05 ms, respectively. (Mild vs Moderate : P<0.01, Mild vs Severes or Cirrhosis: P<0.0001, Moderate vs Severes or Cirrhosis: P<0.0001) (Figure 3A). Linear correlations were observed between the T1ρ relaxation time of the liver and the alanine aminotransferase (ALT), aspartate aminotransferase (AST) (R2=0.18, P<0.0001; R2=0.21, P<0.01) in patients with chronic hepatitis B (Figure 4A-B). After one year pegylated interferon treatment, the levels of serum AST and ALT were remarkably decreased (P<0.0001, P<0.0001), forty-five (48.39%, 45/93) patients became HBV-DNA negative (<10 IU/mL). For the 26 patients who underwent two MRI scans, the T1ρ relaxation time before treatment was 48.99±8.05 ms, which was significantly reduced to 42.86±6.32 ms after treatment (P<0.0001) (Figure 3B).DISCUSSION
The feasibility and sensitivity of T1ρ MRI for noninvasive delineation of the different stages of chronic hepatitis B or cirrhosis and monitor the effect of treatment. The T1ρ relaxation time further increases with the aggravation of the disease in chronic hepatitis B patients, which was consistent with pathological biopsy. Laboratory test indicators ALT and AST levels are also positively correlated with T1ρ relaxation time before receiving interferon treatment. The T1ρ can be measured as the decay of the transverse magnetization in the presence of a spin-lock radiofrequency field, it reflected the change of collagen content9. Therefore, we suspect that the degree of liver fibrosis gradually aggravates with the progress of chronic hepatitis B and eventually develops into cirrhosis10. The T1ρ relaxation time can reflect the severity of liver fibrosis. For patients with chronic hepatitis B and liver cirrhosis, interferon treatment has achieved good results. At the same time, the T1ρ relaxation time decreased significantly, which may be caused by the reversal of liver fibrosis, so T1ρ MRI can monitor the therapeutic effect of drugs. It is hoped that in the future, The T1ρ magnetic resonance can be used to objectively and quantitatively measure the liver, so as to non-invasively and accurately classify of chronic hepatitis B and find early liver cirrhosis.CONCLUSION
Our results showed that T1ρ relaxation times can be used to display the patients with chronic hepatitis B or liver cirrhosis at different stage and quantitatively reflect the therapeutic effects. Noninvasive T1ρ MRI is a potential tool for evaluating physiological and pathological changes of liver related to the chronic hepatitis and liver cirrhosis caused by HBV infection.Acknowledgements
No acknowledgement found.References
1. Tang LSY, Covert E, Wilson E, et al. Chronic Hepatitis B Infection: A Review. JAMA 2018;319(17):1802-1813.
2. Seto WK, Lo YR, Pawlotsky JM, et al. Chronic hepatitis B virus infection. Lancet 2018;392(10161):2313-2324.
3. Fanning GC, Zoulim F, Hou J, et al. Therapeutic strategies for hepatitis B virus infection: towards a cure. Nat Rev Drug Discov 2019;18(11):827-844.
4. Colloredo G, Guido M, Sonzogni A, et al. Impact of liver biopsy size on histological evaluation of chronic viral hepatitis: the smaller the sample, the milder the disease. J Hepatol 2003;39(2):239-244.
5. Arroyo V, Moreau R, Kamath PS, et al. Acute-on-chronic liver failure in cirrhosis. Nat Rev Dis Primers 2016;2:16041.
6. Bernal W, Jalan R, Quaglia A, et al. Simpson K, Wendon J, Burroughs A: Acute-on-chronic liver failure. Lancet 2015;386(10003):1576-1587.
7. Xie S, Li Q, Cheng Y, et al. Impact of Liver Fibrosis and Fatty Liver on T1rho Measurements: A Prospective Study. Korean J Radiol 2017;18(6):898-905.
8. Zhao F, Wang YX, Yuan J, et al. MR T1rho as an imaging biomarker for monitoring liver injury progression and regression: an experimental study in rats with carbon tetrachloride intoxication. Eur Radiol 2012;22(8):1709-1716.
9. Li X , Ma C B , Link T M , et al. In vivo T(1rho) and T(2) mapping of articular cartilage in osteoarthritis of the knee using 3 T MRI. Osteoarthritis & Cartilage 2007; 15(7):789-797.
10. Calvaruso V, Craxi A. Regression of fibrosis after HBV antiviral therapy. Is cirrhosis reversible? Liver Int 2014;34(Suppl 1):85-90.
Figures
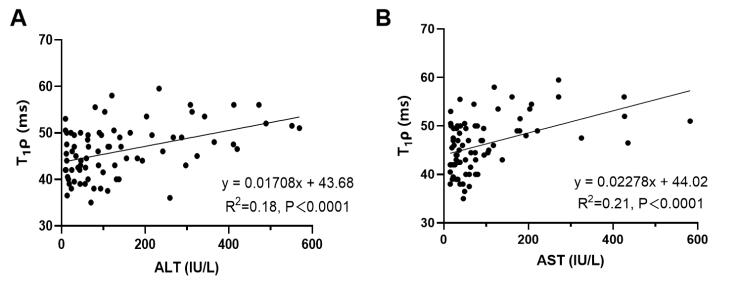
The linear relationship with the liver and ALT/AST of the patients with chronic hepatitis. A) The linear relationship with the ALT levels of the liver. B) The linear relationship with the AST of the liver.
alanine aminotransferase (ALT), aspartate aminotransferase (AST)