4657
Can extracellular volume fraction assess liver fibrosis? A preliminary Gd-EOB-DTPA-enhanced MRI study1Department of Magnetic Resonance, LanZhou University Second Hospital, Lanzhou, China, 2Philips Healthcare, Xi’an, China
Synopsis
This study evaluates the feasibility of extracellular volume fraction (ECV) in judging liver fibrosis, analyzes the interaction between ECV and liver function.The method is to calculate ECV in different degrees of liver function and compare the correlation between ECV and serum albumin. Our research shows that ECV20min had no significant difference among Child-Pugh A, Child-Pugh B and Child-Pugh C, there was a weak correlation with serum albumin. Therefore, we consider that ECV of hepatobiliary phase will not be affected by liver function when Gd-EOB-DTPA is used to evaluate liver fibrosis, it may be a reliable tool in assessing liver fibrosis.
Introduction
Any chronic liver injury may lead to liver fibrosis accompanied by the expansion of the extracellular space, distorting normal liver architecture and impairing hepatic function, Correct diagnosis of fibrosis plays an important role in the estimation of prognosis and the direct treatment of patients. The Child-Pugh classification has been the most widely used methods to estimate total liver function in the clinic1. The extracellular volume fraction (ECV) of MRI based Gadolinium ethoxybenzyl diethylenetriamine penta-acetic acid (Gd-EOB-DTPA) technique has recently come into use to assess liver fibrosis and cirrhosis2,3. Previous studies3,4 focus on the severity of chronic liver disease to estimate staging and the curative effect. However, there are few studies estimate liver function using ECV of hepatobiliary phase (ECV20min) of Gd-EOB-DTPA enhanced MRI, to further confirm whether the ECV20min is affected by liver function in the evaluation of patients of of liver fibrosis. The value of ECV of liver hepatobiliary phase in assessing liver function of liver fibrosis remains unclear. Therefore, the purpose of this study was to investigate whether the ECV20min would be affected by liver function in the evaluation of patients with liver fibrosis.Methods
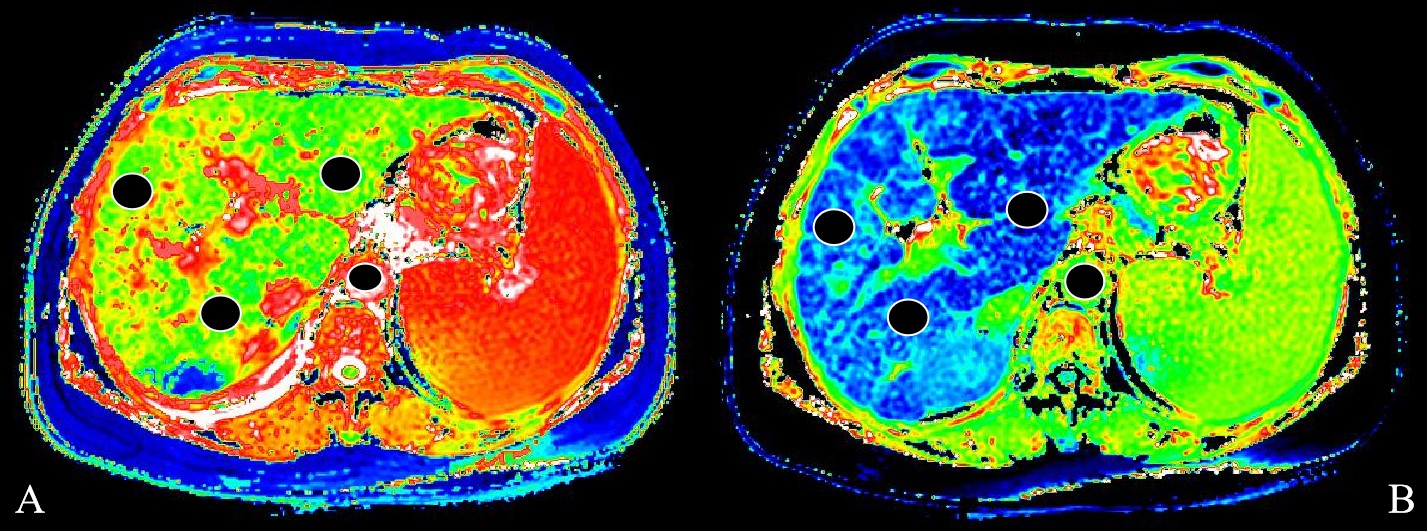
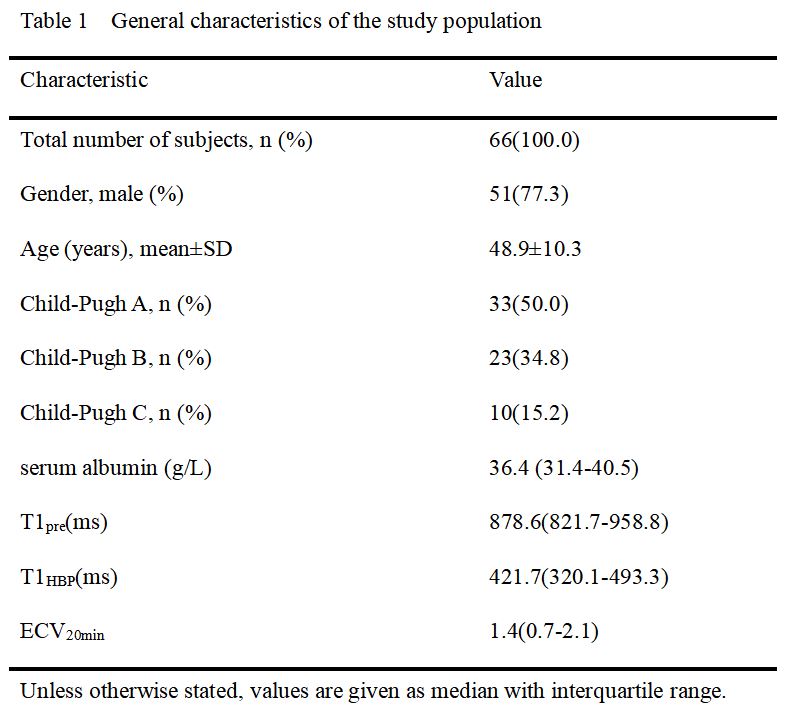
Sixty-six patients with Gd-EOB-DTPA enhancement examination were acquired from a 3T scanner (Ingenia CX, Philips Healthcare, the Netherlands) by using a 16-channel phase array body coil. They were divided into three groups, among which 33 cases were in Child-Pugh A (LCA) group, 23 cases were in Child-Pugh B (LCB) group and 10 cases were in Child-Pugh C (LCC) group (Table 1). Modified Look Locker Inversion Recovery (MOLLI) sequence was used to perform T1 mapping scan at the proximal hepatis hilar level before enhancement and hepatobiliary phase at 20 min after contrast agent administration. The sequence parameters were: TR/TE 500/50ms, flip angle 20 degree, slice thickness 8.0 mm, FOV 400×305mm, matrix 200×246. Moreover, the serum albumin all the patients were acquired through blood biochemistry test. All the obtained images were measured by Philips IntelliSpace Portal workstation to extract T1 relaxation times of liver parenchyma and aorta before enhancement and hepatobiliary phase (T1pre/T1HBP, T1pre-aorta/T1HBP-aorta). The user defined three ROIs were manually drawn on T1 mapping images independently by two experienced radiologists (5- and 7-years’ experience in liver MRI diagnosis respectively) who were blinded to any clinical information (Figure 1). The intraclass correlation coefficient was then calculated. In addition, the ECV20min was calculated using the following equation: ECV20min=(1/T1HBP-1/T1pre)/(1/T1HBP-aorta-1/T1pre-aorta) × (1-hematocrit). One Way ANOVA was applied to compare the related parameters among different liver function groups. Spearman correlation coefficient was used to analyze the correlation among T1pre, T1HBP and ECV20min with serum albumin.Results
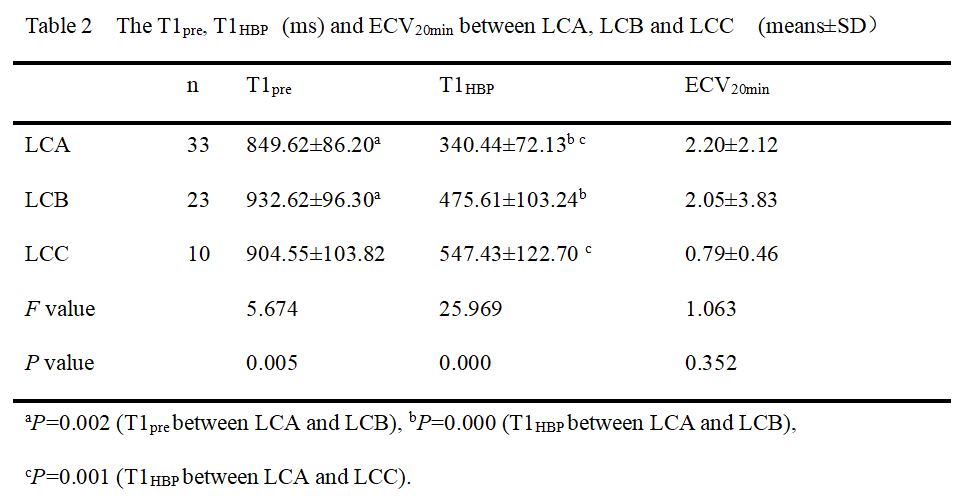
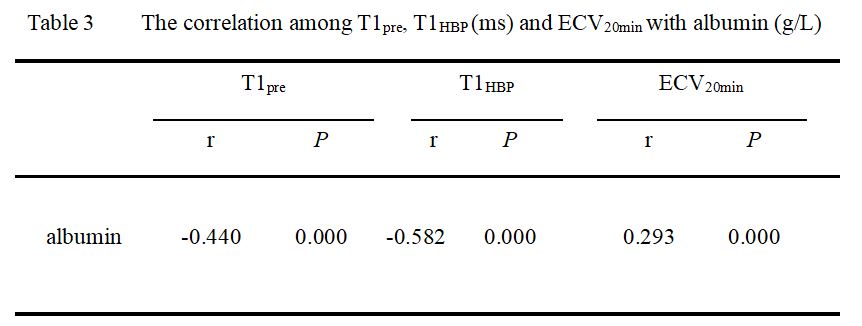
As can be seen in Table 2, T1pre value was significantly higher in LCB compared with LCA (P<0.05); T1HBP value was significantly lower in LCA compared with LCB and LCC (both Ps<0.05); ECV20min showed no significant difference among LCA, LCB and LCC groups (P>0.05). T1pre and T1HBP were negatively correlated with serum albumin (r=-0.440, P=0.000, r= -0.582, P=0.000). ECV20min was positively correlated with serum albumin (r=0.293, P=0.000) (see Table 3).Discussion
With T1pre and T1HBP increased in the progress of liver cirrhosis, our study obtained the same results with previous research4. However, with the decreased ECV20min, our research showed the inconsistent results with previous research which reported equilibrium ECV increase with the worsening liver cirrhosis in both animals and patients3,5-6. The main reason of this phenomenon was the differences of contrast agent used. In the hepatobiliary phase, extracellular concentrations were very low, whereas the contrast agent is mainly accumulated intracellularly due to the property of Gd-EOB-DTPA to be taken up by the amount of functioning organic-anion-transport proteins (OATP). With the development and progression of liver fibrosis, extracellular matrix deposits increase and ECV are expanded compared with the normal surrounding liver parenchyma. For patients with poor liver function of liver fibrosis, the increase of extracellular contrast agents shortened T1 relaxation time and increased ECV, while the decrease of normal liver cellular uptake of contrast agents prolonged T1 relaxation time and decreased ECV. Our study showed that ECV20min had no significant difference among LCA, LCB and LCC, there was a weak correlation with serum albumin which was a marker of synthetic liver function in clinical practice. Therefore, this means ECV of hepatobiliary phase will not be affected by liver function when Gd-EOB-DTPA is used to evaluate liver fibrosis. This study provides a more solid foundation evidence for the evaluation of liver fibrosis by Gd-EOB-DTPA in the future.Conclusion
The ECV is a physiologically intrinsic nature which is calculated by the T1 differences before and after the enhancement of liver using the double compartment mode. Compared with the T1 or T2 mapping, ECV is independent of external field strength and widely used to diagnosis and grading liver fibrosis. Although ECV20min has no significant difference among LCA, LCB and LCC groups, and had a weak correlation with serum albumin. This study demonstrates the feasibility of Gd-EOB-DTPA derived ECV of hepatobiliary phase can be used to evaluate liver fibrosis.Acknowledgements
No acknowledgement found.References
1. Tsoris A, Marlar CA. Use Of The Child Pugh Score In Liver Disease. In: StatPearls. Treasure Island (FL): StatPearls Publishing; March 22, 2021.
2. Catucci D, Obmann VC, Berzigotti A, et al. Noninvasive assessment of clinically significant portal hypertension using ΔT1 of the liver and spleen and ECV of the spleen on routine Gd-EOB-DTPA liver MRI. Eur J Radiol. 2021; 144: 109958.
3. Kupczyk PA, Mesropyan N, Isaak A, et al. Quantitative MRI of the liver: Evaluation of extracellular volume fraction and other quantitative parameters in comparison to MR elastography for the assessment of hepatopathy. Magn Reson Imaging. 2021; 77:7-13.
4. Hoffman DH, Ayoola A, Nickel D, Han F, Chandarana H, Shanbhogue KP. T1 mapping, T2 mapping and MR elastography of the liver for detection and staging of liver fibrosis. Abdom Radiol (NY). 2020; 45(3):692-700.
5. Luetkens JA, Klein S, Träber F, et al. Quantification of Liver Fibrosis at T1 and T2 Mapping with Extracellular Volume Fraction MRI: Preclinical Results. Radiology. 2018;288(3):748-754.
6. Yoon JH, Lee JM, Klotz E, et al. Estimation of hepatic extracellular volume fraction using multiphasic liver computed tomography for hepatic fibrosis grading. Invest Radiol. 2015;50(4):290-296.
Figures