4656
Quantitative T1 and R2* mapping in the evaluation of renal function for diabetic nephropathy patients1Affiliated Hospital of Nantong University, Nantong, China, 2MR Research, GE Healthcare, Beijing, China
Synopsis
Renal T1 and R2* mapping were performed on 55 diabetic nephropathy (DN) patients , 20 healthy volunteers(HVs)and 10 diabetes mellitus (DM) patients to explore the clinical potential in assessing renal function. While comparable T1 and R2* values of renal cortex were found between HVs and DM patients, DN patients showed significantly increased T1 and R2* values of renal cortex relative to HVs and DM patients. Both T1 and R2*metrics were also significantly correlated with renal function. Therefore, quantitative T1 and R2* mapping might be considered effective measures in evaluating renal function for DN patients.
Introduction
Diabetic nephropathy (DN) is the most serious microvascular complication of diabetes, and one main cause of death in diabetic patients1. Early diagnosis, intervention and treatment can improve or delay the functional impairment of diabetic nephropathy. At present, the diagnosis of diabetic nephropathy mainly relies on urinary albumin and the estimated glomerular filtration rate (eGFR). However, these clinical methods, being susceptible to fever, infection and short-term severe exercise, lacks of sufficient sensitivity and specificity in diagnosing early diabetic nephropathy2.T1 mapping, as a quantitative MRI technique to measure T1 relaxation property of tissue, has been reported in evaluating the renal function of acute renal failure, chronic kidney disease3 and transplanted kidney4. Meanwhile, Renal r2* mapping, as an effective method evaluating the oxygenation levels in renal tissue, has been applied to assess severity degree of hypoxia in renal tissue5. With these advantages, we assumed that both T1 and R2* mapping might have the potential in renal function assessment for DN patients.
Therefore, this study aimed to explore the clinical potential of combined T1 and R2* mapping in assessing renal function for DN patients.
Methods and materials
Subjects55 DN patients (mean age: 54±12 years), 20 healthy volunteers (HVs, mean age: 50±14 years) and 10 diabetes mellitus (DM, mean age: 60±8 years) were recruited in this study. According to eGFR for renal function measurement, 55 DN cases were divided into mild renal impairment group (20, eGFR≥60 mL/min/1.73 m2) and moderate to severe renal impairment (35, eGFR<60 mL/min/1.73 m2). All patients had informed consent and underwent MRI examinations.
Clinical parameters were also obtained such as 24-hour urinary protein (24hUpro), the serum creatinine (Scr), hemoglobin (Hb), estimated glomerular filtration (eGFR) and hematocrit, Body Mass Index (BMI), fasting blood-glucose (FBG) and Serum uric acid (SUA).
MRI experiment
All MRI experiments were performed on an 3.0T MR scanner (Discovery MR750, GE Healthcare, Milwaukee, WI) with a 16-channel phased array coil employed.
A respiration-triggered single-point saturation-recovery FIESTA (SMART) T1 imaging6 with 9 inversion recovery times (TI)s ranging from 100–20000ms was used for native T1 measurement. Multi-echo gradient-echo based sequence was performed for R2* mapping measurement. Both T1 and R2* mapping were measured in coronal view to fully cover both left and right kidneys and adrenal gland. Detailed scan parameters were shown in Table1.
Data analysis
T1 and R2* mapping were post-processed for each subject, based on the signal recovery with increased TIs7 and mono-exponential decay at increased TEs, using vendor-provided software on GE ADW 4.6 workstation (Fig.1).A senior radiologist was employed to manually draw three regions of interest (ROI)s on the upper, middle and lower parts of each of two renal cortices, respectively, for each subject. T1 and R2* values of total six ROIs were averaged for each subject for statistical analysis.
All statistical analyses were performed in Prism 8.0.2 and SPSS25.0 software. One-way analysis of variance (ANOVA) was used to assess the group difference in T1 or R2* among DM, HV and two DN groups. Post-hoc least-significant difference (LSD) method was further used for pairwise comparison. Pearson or Spearman correlation coefficient was used to analyze the relationship between T1 or R2* and each of clinical parameters. Receiver operating curve(ROC)was applied to evaluate the efficacy of diagnosing DN from HVs and DM. p < 0.05 was considered statistic significance.
Result
The demographics of DM, HVs and DN group are shown in Table 2.Using One-way ANOVA, different T1 or R2* of renal cortex were found among HVs, DM and two sub-groups of DN (F(2, 82)=34.87, P<0.001, F (3, 85) =12, P<0.001). With further post-hoc t-tests, uncomparable T1 and R2* were found between HVs and DM, significantly different T1 and R2 * were revealed between HVs and each of DN sub-groups. (P<0.001;Fig.2 A&B).
In addition, with the aggravation of renal function injury, cortical renal T1 of DN increased gradually. (P<0.001; Fig.2 A&B).
For DN, T1 was positively correlated with 24hUpro and Scr, and negatively correlated with Hb, eGFR and hematocrit (all p<0.01).
Using ROC analysis, cortical T1 and R2* showed robust efficacy of diagnosing DN from HVs and DM with high area-under-the-curves (AUC)s of 0.924 and 0.803, respectively (Fig.2C). The corresponding sensitivity, specificity, and cut-off values were of 0.91, 0.89, 1667.62ms and 0.727, 0.736, 15.44Hz.
Discussion and Conclusion
T1 of renal cortex increased gradually with the aggravation of renal function injury. Significant correlations between T1 and clinical parameters were also found, similar to previous study8. One possible reason for T1 increase is that renal interstitium with impaired renal function may have inflammatory cell infiltration, necrosis, abnormal accumulation of water inside and outside cells or other pathological changes. Cortical R2* in DN patients was notably higher than control group, reflecting reduced oxygenation level of renal tissue at hypoxia state. A possible reason is that microvascular changes in diabetic nephropathy restrict the oxygen transport in renal tissues, resulting in low oxygen utilization efficiency9. In addition, T1 and R2* are validated with robust diagnosis of diabetic nephropathy with high AUC.In conclusion, combined quantitative T1 and R2* mapping might be considered effective in evaluating renal function for DN patients.
Acknowledgements
No acknowledgement found.References
- Sulaiman MK. Diabetic nephropathy: recent advances in pathophysiology and challenges in dietary management. Diabetol Metab Syndr, 2019, 11: 117.
- Celine QK, Tess DK, Kimberley AV, et al. An autopsy study suggests that diabetic nephropathy is underdiagnosed[J]. Kidney Int, 2016, 90(1):149-156.
- Hueper K.,Peperhove M.,Rong S.,et al.T1-mapping for assessment of ischemia-induced acute kidney injury and prediction of chronic kidney disease in mice[J].European Radiology,2014,24(9).
- Huang Y, Sadowski EA, Artz NS, Seo S, DjamaliA, Grist TM, Fain SB: Measurement and comparison of T1 relaxation times in nativeand transplanted kidney cortex and medulla.J Magn Reson Imaging 2011; 33: 1241–1247.
- Glockner JF, Lerman LO, McKusick MA,et al. Blood oxygen level-dependent magnetic resonance imaging identifies cortical hypoxia in severe renovascular disease.[J]. Hypertension: An Official Journal of the American Heart Association,2011,58(6).
- Stainsby JA, Slavin GS. Comparing the accuracy and precision of SMART1Map, SASHA and MOLLI. J Cardiovasc Magn Reson. 2014. 16(1): P11.
- Slavin GS, Hood MN, Ho VB, Stainsby JA. Breath-held myocardial T1 mapping using multiple single-point saturation recovery. In Proceedings of the 20th Annual Meeting of ISMRM, Melbourne, Australia, 2012. p. 1244.
- Gillis Keith A et al. Non-Contrast Renal Magnetic Resonance Imaging to Assess Perfusion and Corticomedullary Differentiation in Health and Chronic Kidney Disease.[J]. Nephron, 2016, 133(3) : 183-92.
- LI LP, HALTER S, PRASAD PV. Blood oxygen level-dependent MR imaging of the kidneys.[J]. Magnetic resonance imaging clinics of North America,2008,16(4):613-625; viii-0
Figures
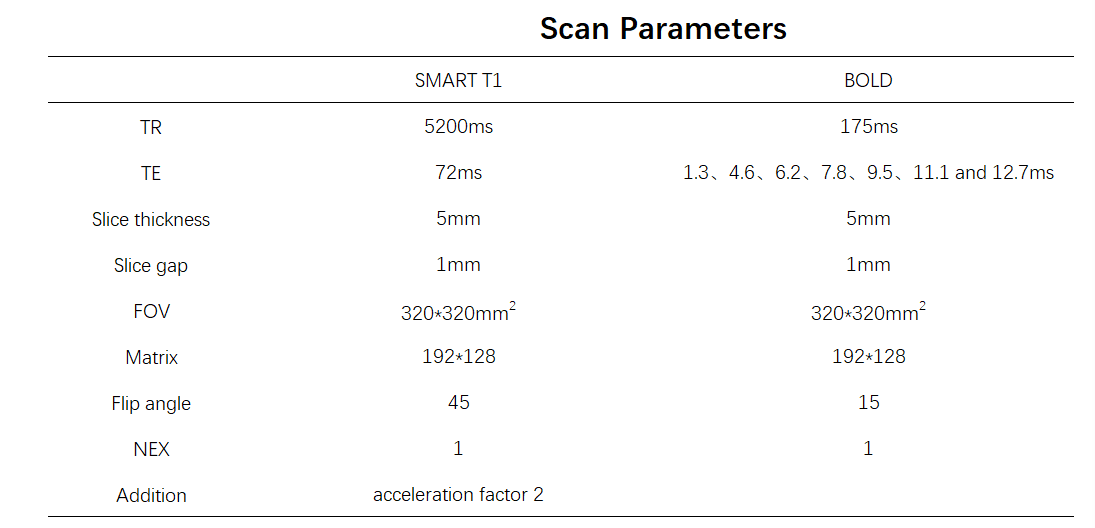
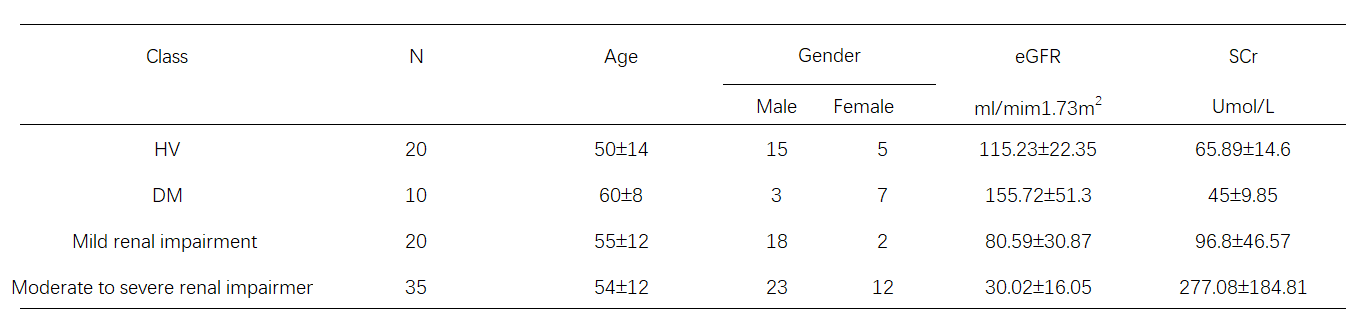
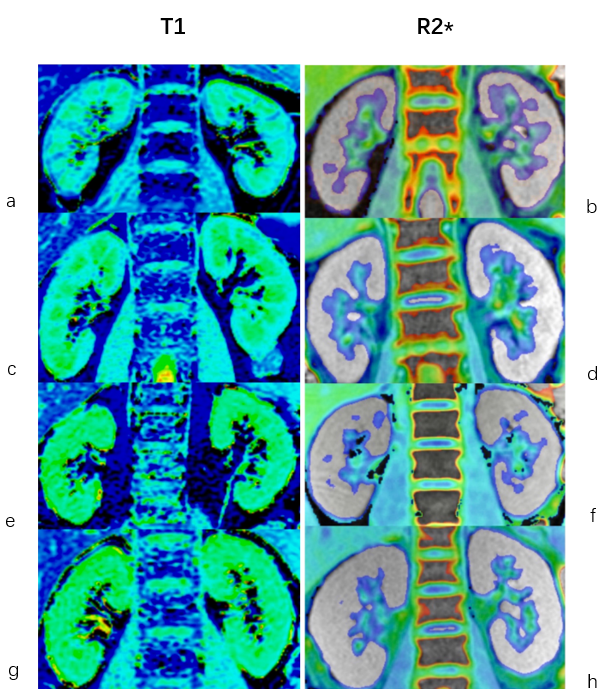
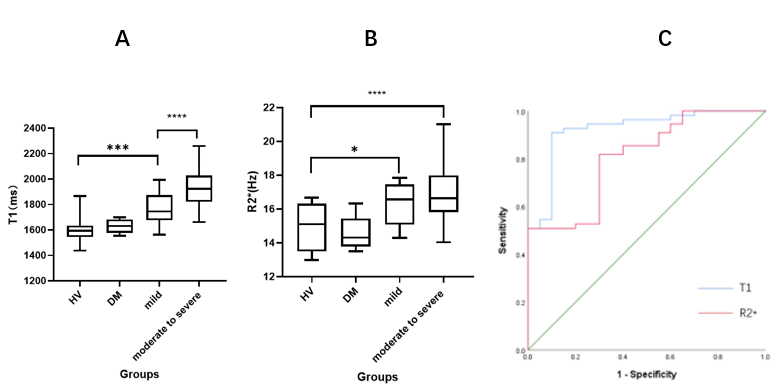
Fig.2 A: In boxplot analysis, the T1 values of renal cortex in HVs, DM and mild and moderate to severe DN groups were shown. Significantly different T1 values were shown between HVs and mild group, between mild and moderate to severe group .
B:In boxplot analysis, significantly different R2* values were shown between HVs and two DN groups.
C:ROC analysis shows robust performance of cortical T1 and R2 * in diagnosing DN from HVs and DM with AUCs of 0.924 and 0.803. The sensitivity, specificity and cut-off values were of 0.91, 0.89, 1667.62ms and 0.727, 0.736, 15.44Hz., respectively.
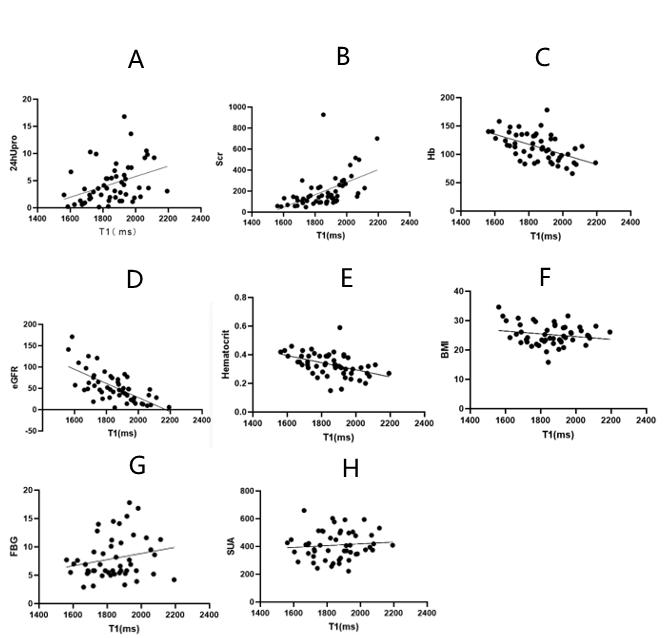
Fig.3 A-B: T1 value was positively correlated with 24hUpro and Scr(P<0.01).
C-E:T1 value was negatively correlated with Hb, eGFR and hematocrit(P<0.01).
E-G:No correlation was found between T1 value and BMI, FBG and SUA(P>0.05).