4655
Staging liver fibrosis through a machine learning model built from radiomics features of T2WI images1Shanghai Public Health Clinical Center, Fudan University, shanghai, China, 2Shanghai United Imaging Research Institute of Intelligent Imaging, shanghai, China, 3Philips Healthcare, shanghai, China
Synopsis
To further develop and validate a radiomics-based model from liver T2WI images for staging liver fibrosis.
Introduction
Liver fibrosis is mainly caused by hepatitis virus, alcohol, drugs and poisons, autoimmune liver disease and other chronic factors that stimulate the liver. Advanced liver fibrosis results in cirrhosis, portal hypertension and even liver failure1,2. Liver fibrosis may be potentially modified by treatment. Hence, early diagnosis, staging and therapy to decrease or halt fibrosis progression or reverse the fibrosis are urgently needed for chronic liver disease. Recently, several studies based on radiologic analysis of computed tomography (CT), magnetic resonance imaging (MRI) and ultrasound (US) have been widely proposed for the detection, evaluation and surveillance of liver fibrosis. Radiomics aims to quantify phenotypic characteristics on medical imaging by using automated algorithms, which can perform diagnostic or predictive tasks. Our research aims to develop and validate radiomics-based machine learning techniques for staging liver fibrosis by using T2WI images.Methods
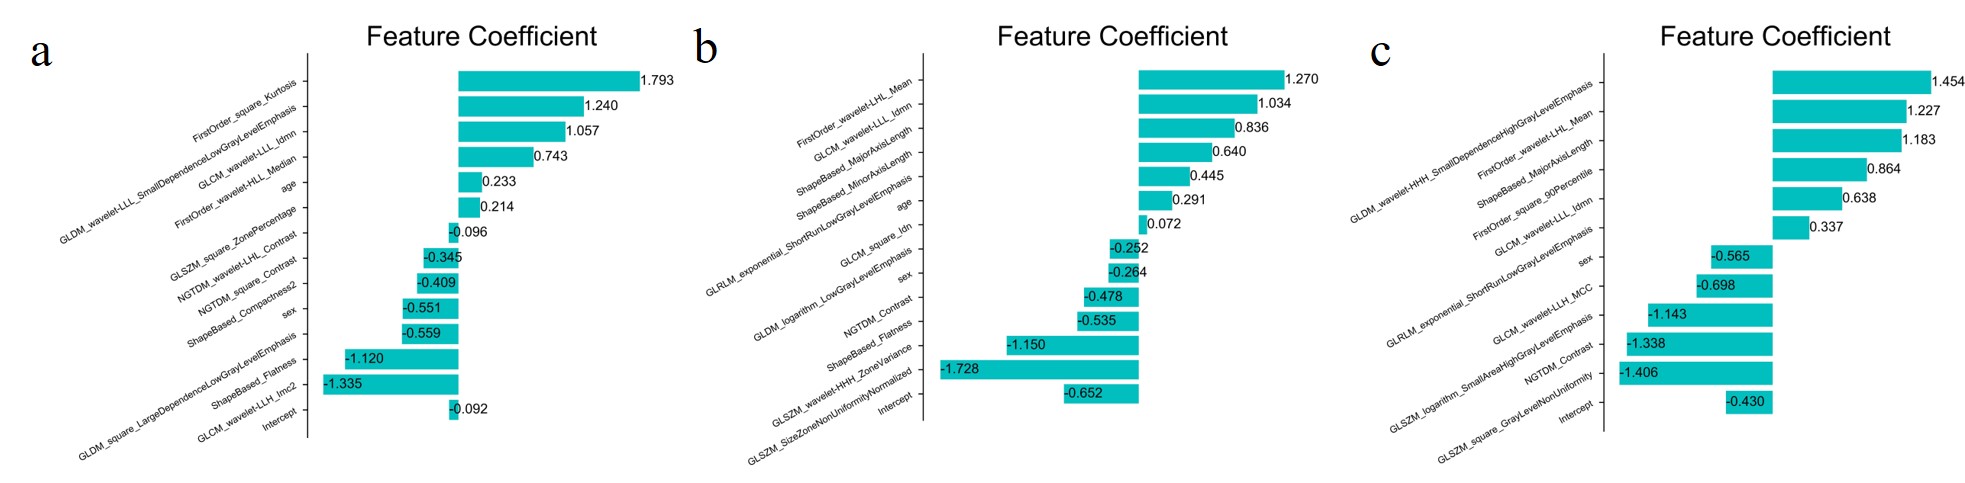
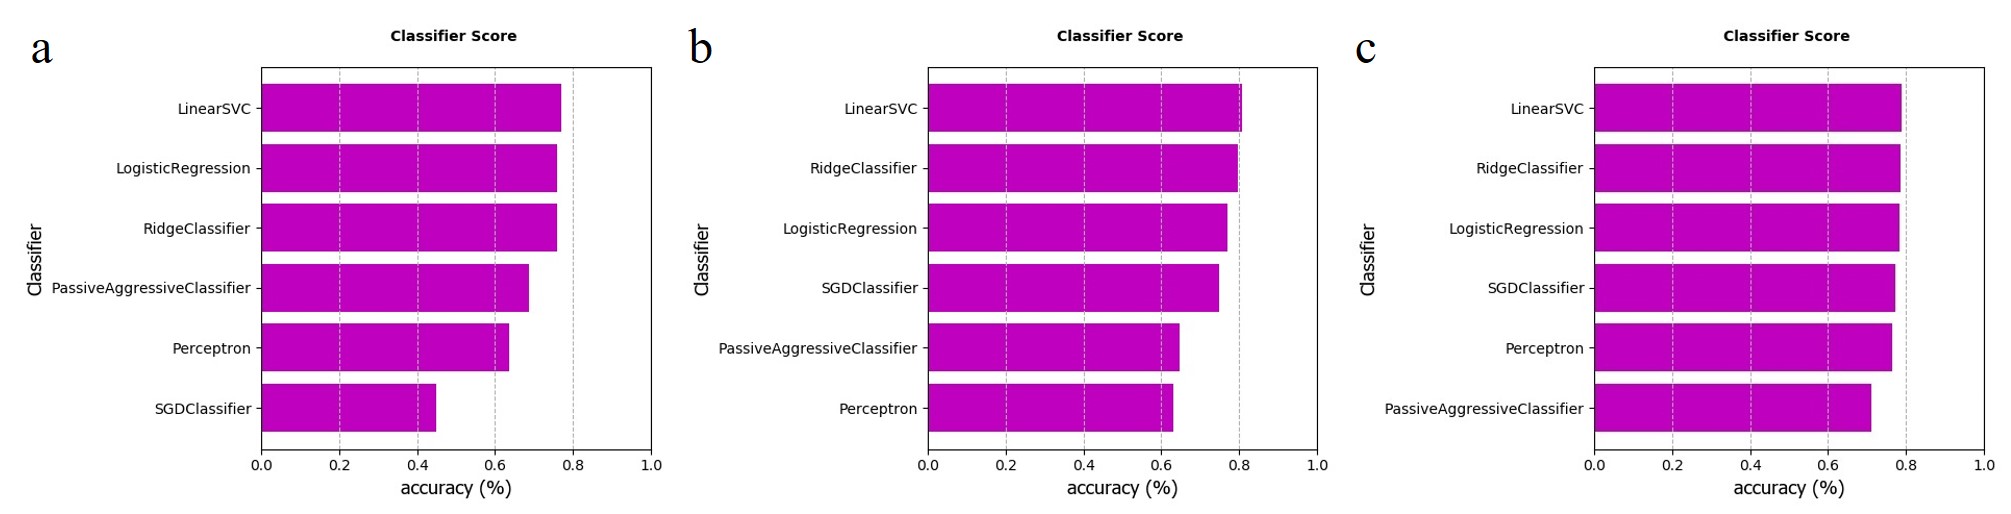
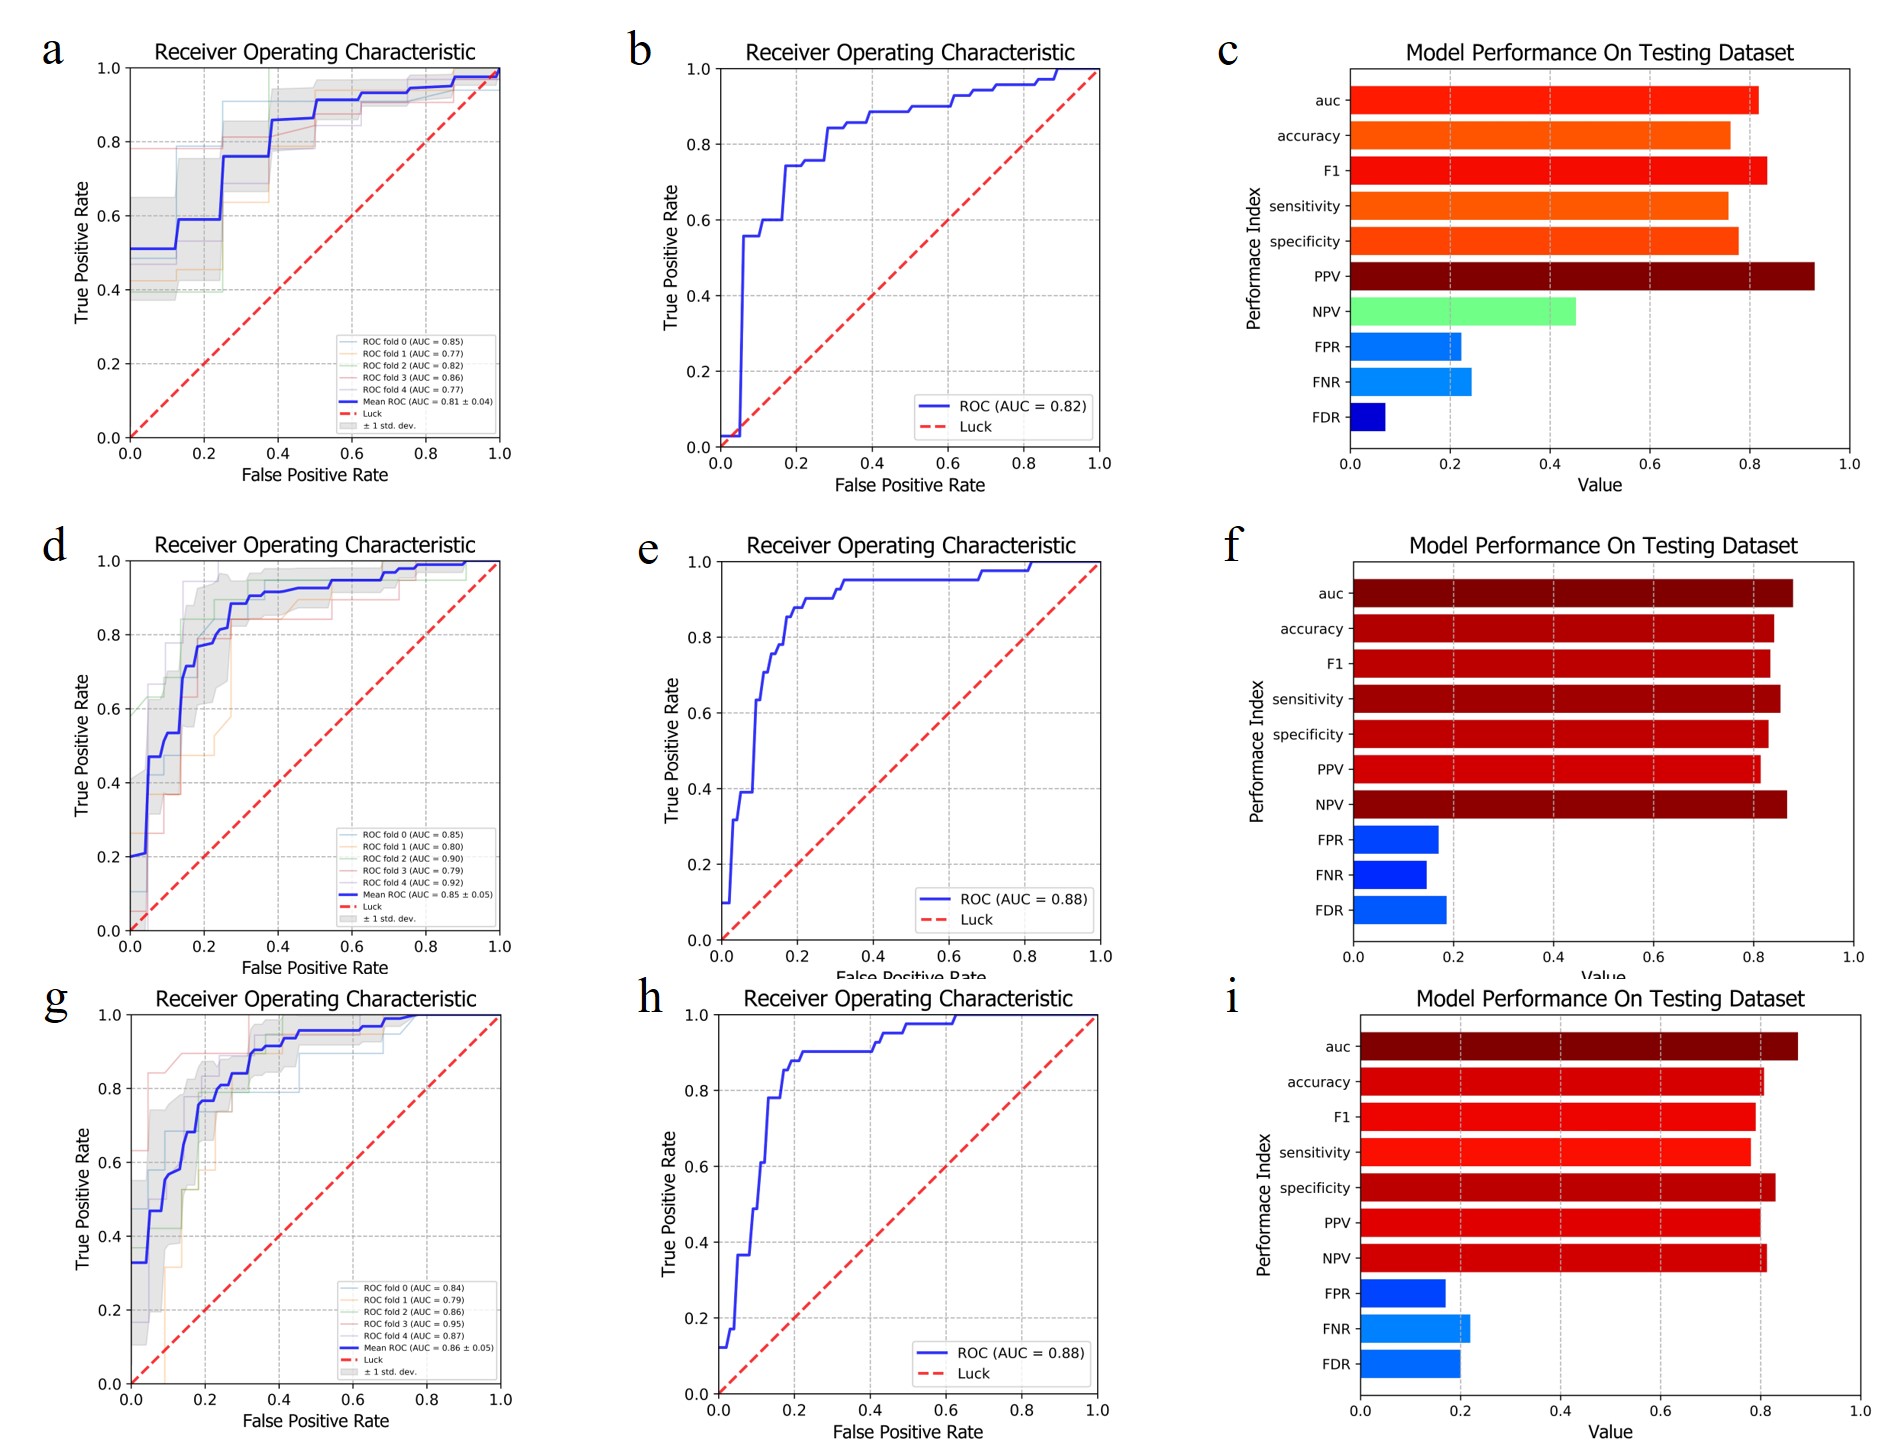
291 patients (58, 53, 45, and 135 patients with fibrosis stages of S1, S2, S3, and S4, respectively) with liver disease who underwent abdomen MRI and confirmed of liver fibrosis within 3 months with hepatectomy or biopsy between January 2017 and June 2019 in Shanghai Public Health Clinical Center were enrolled in this retrospective study. For each patient, 1688 radiomic features were extracted from T2WI images. Features with predictive values were retained using Spearman correlation analysis and LASSO (least absolute shrinkage and selection operator). Three diagnostic models were built using Linear SVC Classifier with the selected radiomics features to predict significant fibrosis (≥S2), advanced fibrosis (≥S3), and cirrhosis (S4), respectively. Finally, we validated the model performance on independent test datasets.Results
The AUC of the test datasets for diagnosing significant fibrosis (≥S2), advanced fibrosis (≥S3), and cirrhosis (S4) is 0.82, 0.88, and 0.88, respectively. In the test set to differentiate significant fibrosis, The corresponding accuracy, F1, sensitivity, specificity, PPV, NPV, FPR, FNR and FDR of the model are 0.76, 0.83, 0.76, 0.78, 0.93, 0.45, 0.22, 0.24 and 0.07. At the stage of advanced fibrosis, the performance in test set was accuracy of 0.88, F1 of 0.83, sensitivity of 0.85, specificity of 0.83, PPV of 0.81, NPV of 0.87, FPR of 0.17, FNR of 0.15 and FDR of 0.19. According to the statistical analysis of cirrhosis, the classifier achieved accuracy of 0.81, F1 of 0.79, sensitivity of 0.78, specificity of 0.83, PPV of 0.80, NPV of 0.81, FPR of 0.17, FNR of 0.22 and FDR of 0.20 in test set.Discussion
The typical patterns of liver fibrosis include fine reticular and coarse linear patterns, with the fibrotic bands outlining foci of regenerative nodules. Radiologic images play a crucial role in the assessment of liver fibrosis. Studies have shown that the MR images had an advantage over CT images in classification of liver fibrosis. The fibrotic bands of tissue frequently show linear and reticular hyperintense signals on T2WI or low intensity tramline or rings at portal phase on dynamic contrast-enhanced imaging, possibly due to intrahepatic inflammatory exudate, altered hemodynamics or abnormal lymphatic formation and reflux3,4. Radiomics has the potential to expand the capabilities of liver radiology beyond the scope of traditional visual image assessment, which allows for a comprehensive analysis of morphologic and textural change in the liver. It has been previously reported that texture analysis of MR images produced misclassification rates of 28.46%, 35.77% and 20.33% for fibrosis staging in T2WI, T1WI and Gd-EOB-DTPA-enhanced hepatocyte-phase imaging, respectively5. In he’s study6, a support vector machine learning model incorporating clinical and T2-weighted radiomics features have fair-to-good diagnostic performance for categorically classifying liver stiffness. Rather than using a contrast agent, we applied a radiomics-based machine model of T2WI images in the interest of simplicity and safety. In our study, the model diagnosed significant fibrosis (≥S2), advanced fibrosis (≥S3), and cirrhosis (S4) with AUCs of 0.82, 0.88, and 0.88, respectively. These diagnostic performances are comparable to several previous studies investigating the possibilities of deep learning to determine liver fibrosis stage.Conclusion
Radiomics analysis of T2WI image is a new non-invasive method that allows for accurate diagnosis of the liver fibrosis stages.Acknowledgements
The study was supported by the grants from Shanghai Hospital Development Center (No. SHDC12019128); Shanghai public health clinical center (KY-GW-2021-11).References
1.Bataller R, Brenner DA. Liver fibrosis. J Clin Invest 2005;115:209-18.
2.Shan L, Liu Z, Ci L, Shuai C, Lv X, Li J. Research progress on the anti-hepatic fibrosis action and mechanism of natural products. Int Immunopharmacol 2019;75:105765.
3.Chundru S, Kalb B, Arif-Tiwari H, Sharma P, Costello J, Martin DR. MRI of diffuse liver disease: characteristics of acute and chronic diseases. Diagn Interv Radiol 2014;20:200-8.
4.Shu J, Zhao JN, Han FG, Tang GC, Chen X. Chronic hepatitis B: correlation of abnormal features on T2-weighted imaging and dynamic contrast-enhanced imaging with hepatic histopathology. Radiol Med 2017;122:807-813.
5. Wu Z, Matsui O, Kitao A, Kozaka K, Koda W, Kobayashi S, et al. Hepatitis C related chronic liver cirrhosis: feasibility of texture analysis of MR images for classification of fibrosis stage and necroinflammatory activity grade. PLoS One 2015;10:e0118297.
6. He L, Li H, Dudley JA, Maloney TC, Brady SL, Somasundaram E, et al. Machine Learning Prediction of Liver Stiffness Using Clinical and T2-Weighted MRI Radiomic Data. AJR Am J Roentgenol 2019;213:592-601.
Figures