4652
Whole-brain mouse fMRI combined with cortex-wide patterned optogenetic stimulation1Center for Neuroscience Imaging Research, Institute for Basic Science (IBS), Suwon, Korea, Republic of, 2Department of Biomedical Engineering, Sungkyunkwan University, Suwon, Korea, Republic of, 3Department of Intelligent Precision Healthcare Convergence, Sungkyunkwan University, Suwon, Korea, Republic of, 4School of Biological Sciences, Seoul National University, Seoul, Korea, Republic of
Synopsis
Cortex-wide, spatial-patterned optogenetic mouse fMRI with online stimulation planning in situ.
Introduction
Functional magnetic resonance imaging (fMRI) in animals has contributed to discovering neurophysiological bases of whole-brain activity, combined with a variety of invasive methods. Particularly, optogenetic fMRI1 has been a powerful method for in vivo mapping of functional connections by controlling neural activity with cell-type specificity, which is extremely useful in the cortex where numerous types of neurons are intermingled2. In optogenetic fMRI studies, light stimulation is conveyed through a fiber optic implanted at the target area3. Although inevitable for deep brain stimulation, it limits the experimental flexibility as the location to be stimulated is predetermined during surgical implantation. Here, we introduce a hybrid system integrating spatial-patterned, cortex-wide optogenetic stimulation4 with 9.4T mouse fMRI, enabling online stimulation planning based on optical or MR images in situ. We demonstrate the capability of our system in planning arbitrarily shaped optical stimulation based on the brain atlas, intrinsic optical imaging, and retrograde ChR2 virus with fluorescent indicators.Methods
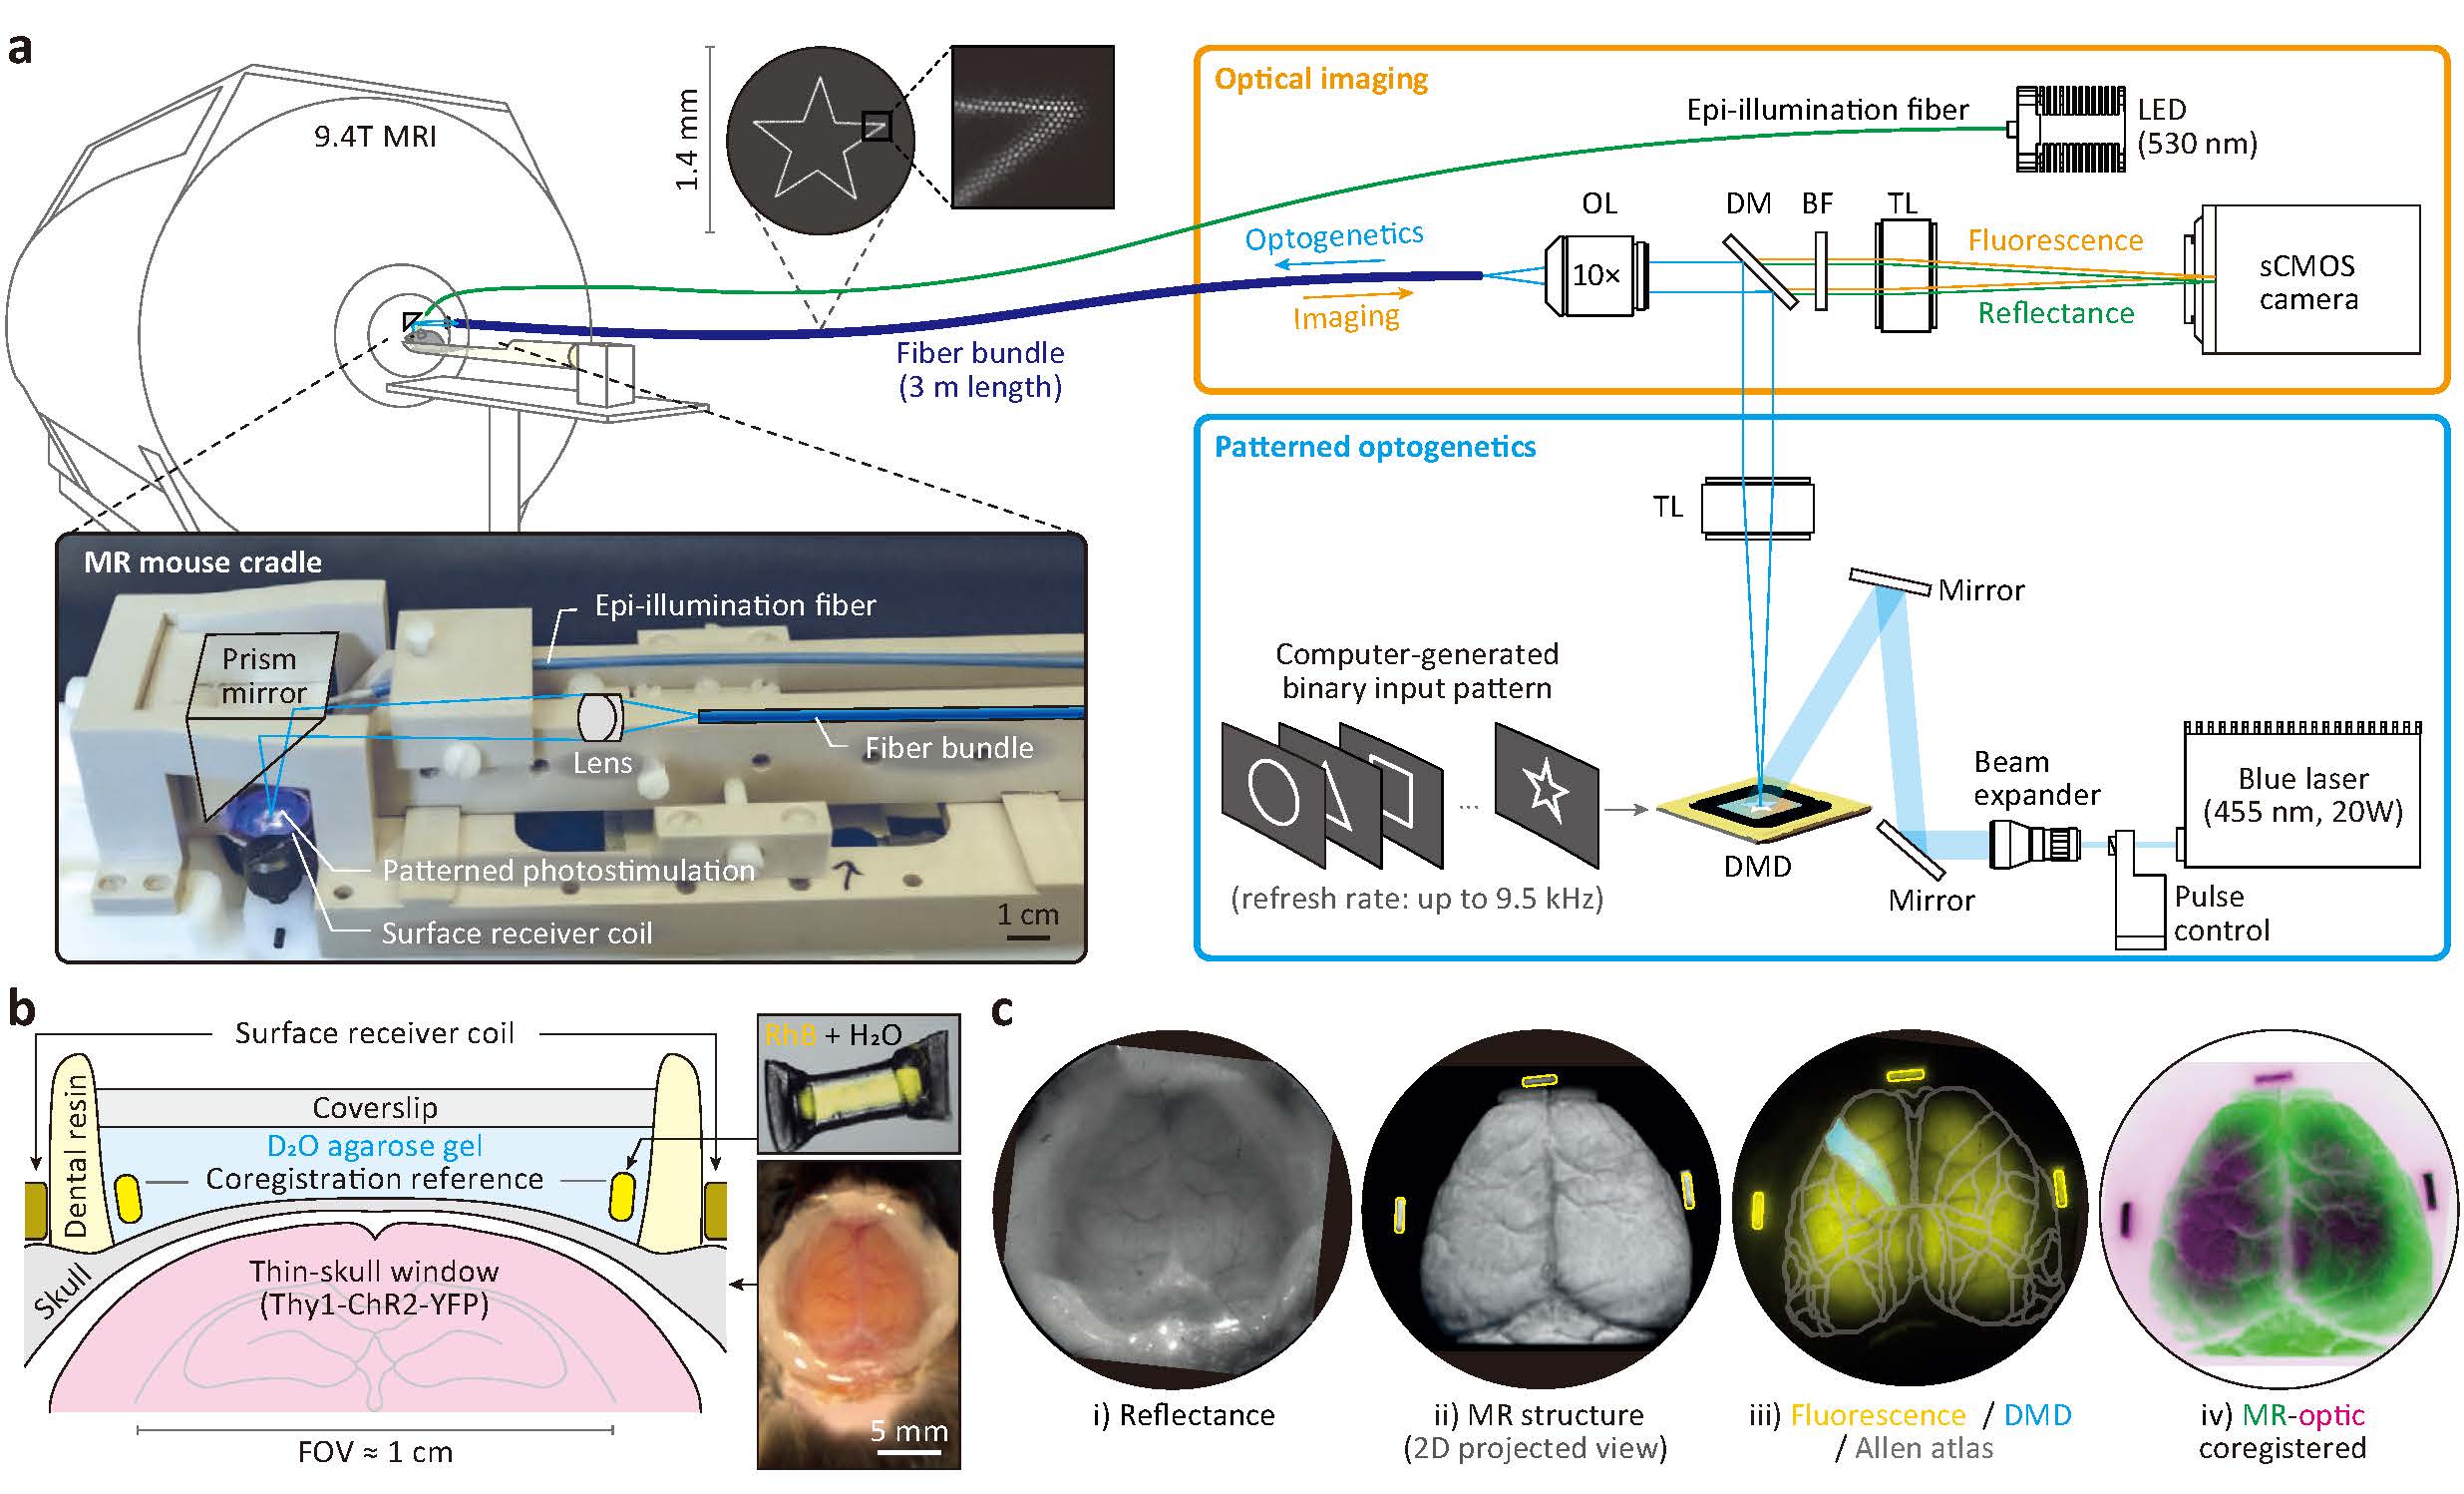
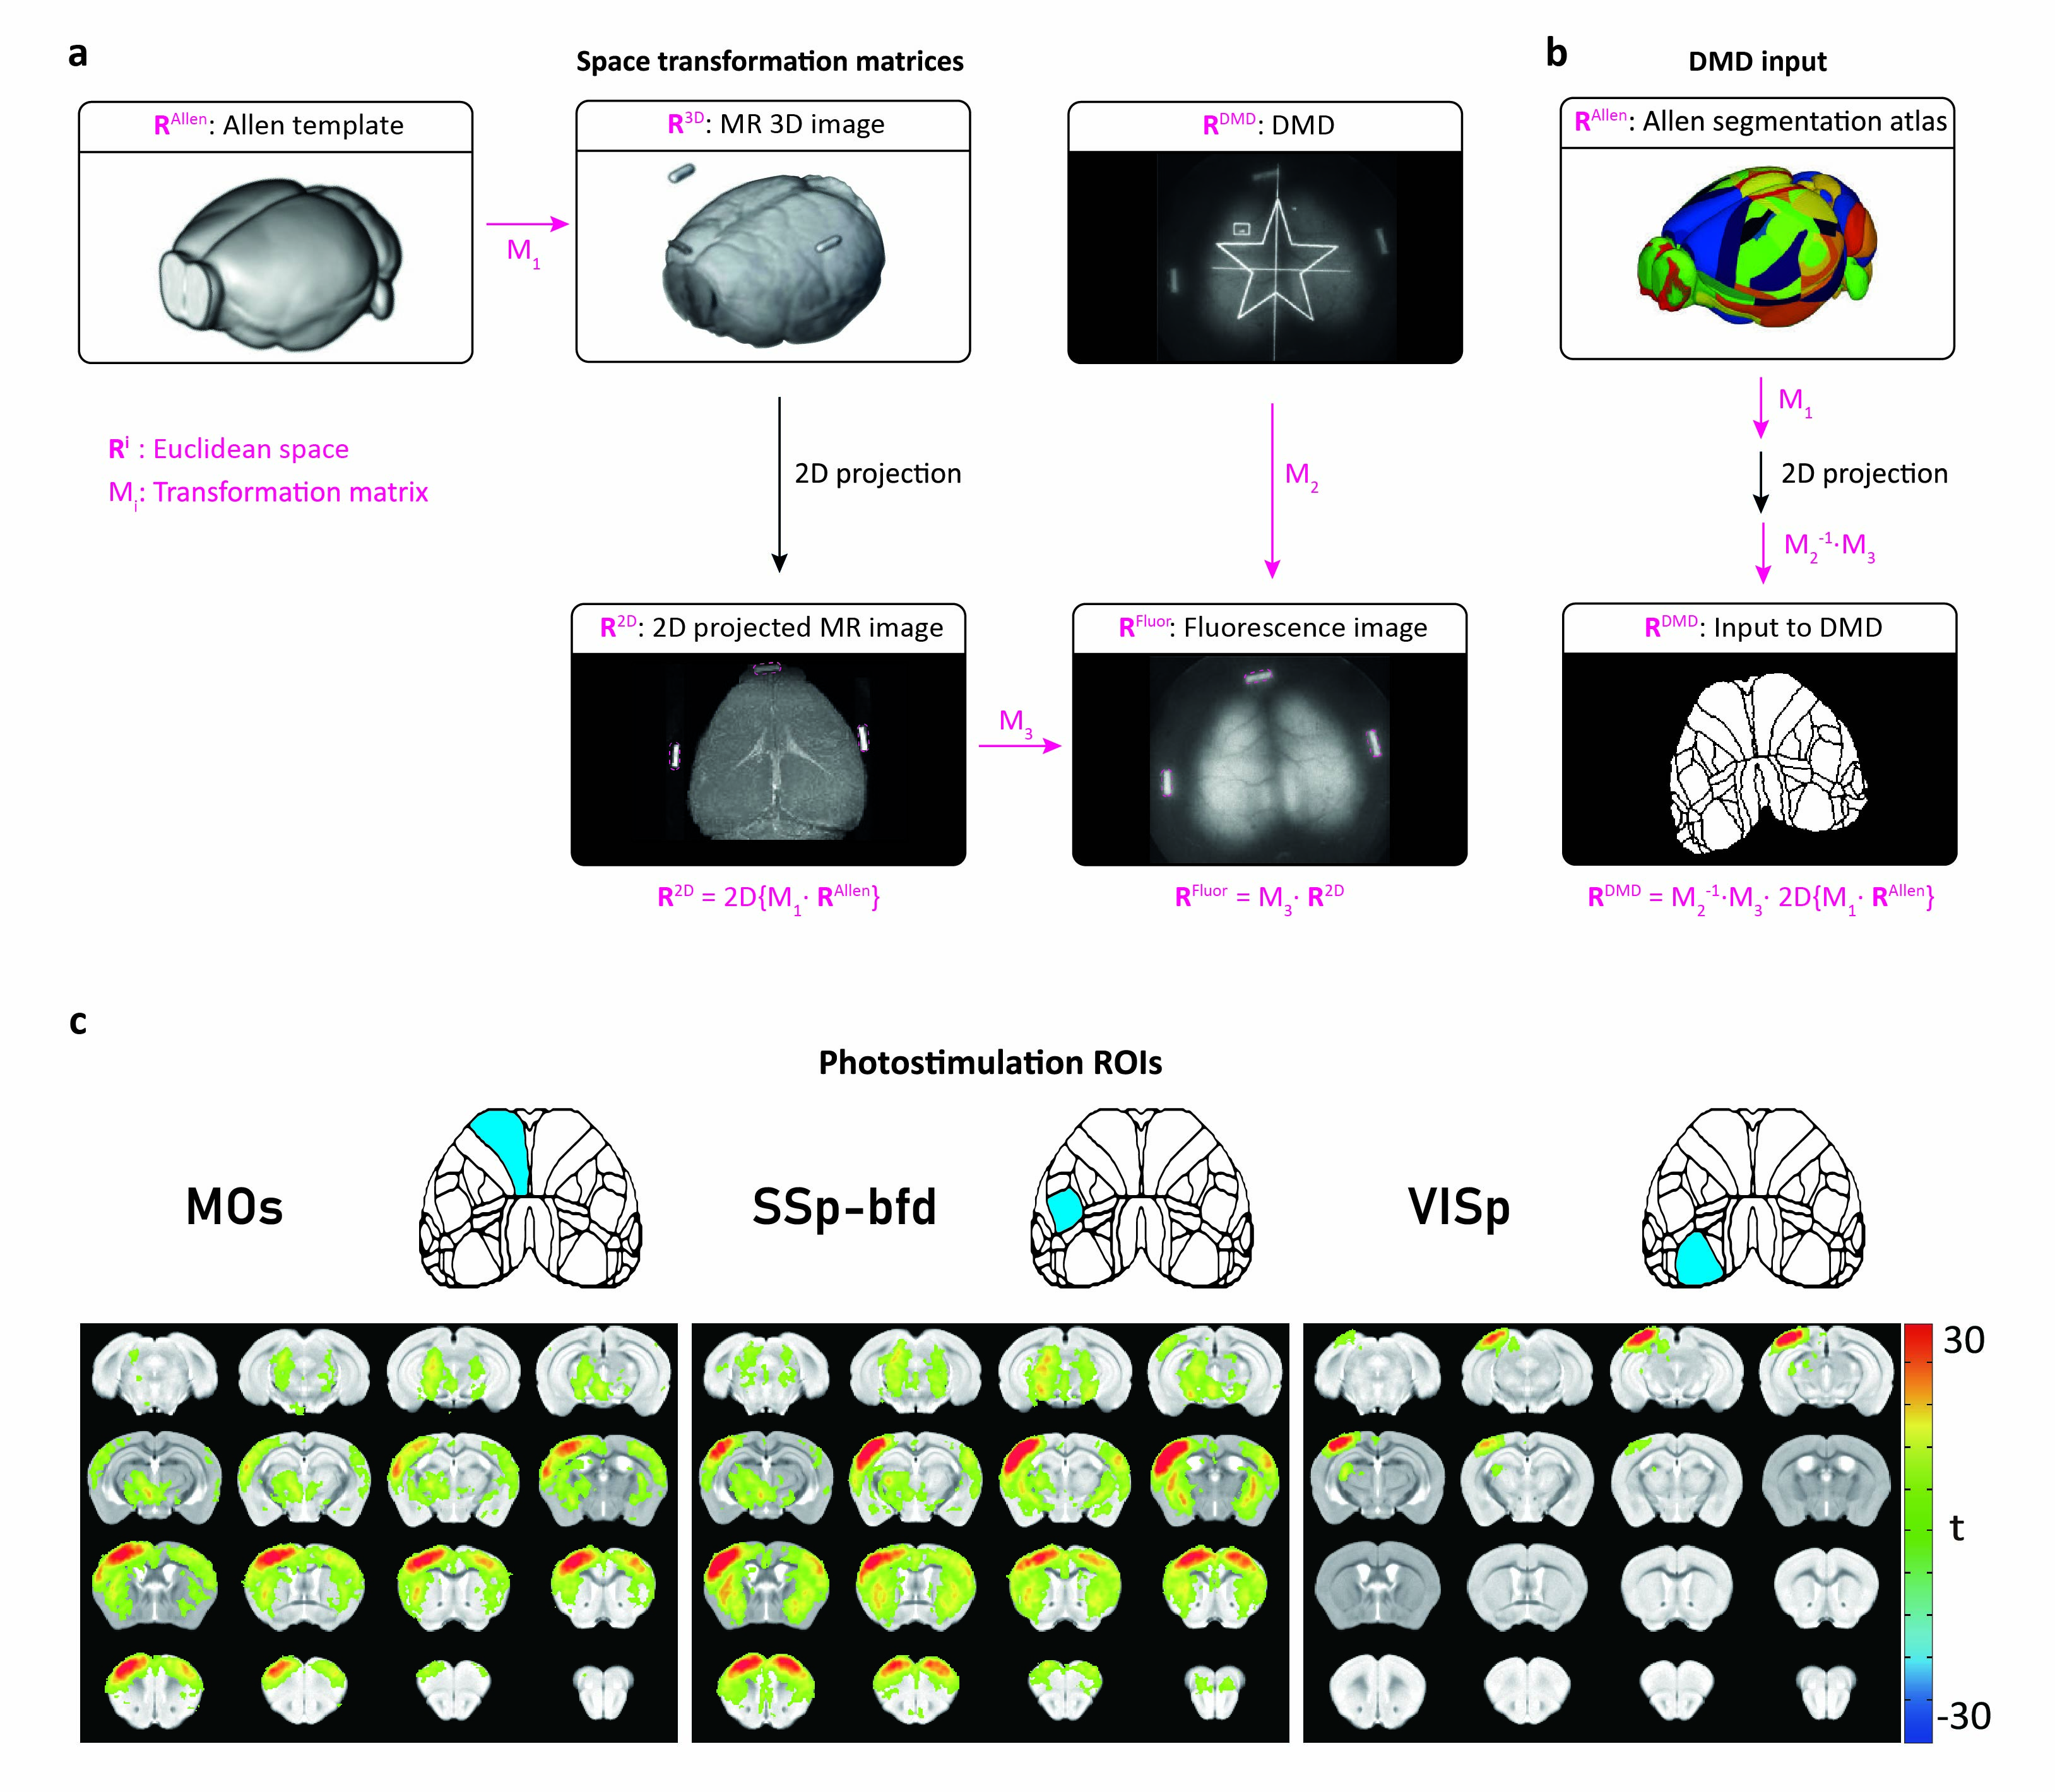
We integrated 9.4T whole-brain mouse fMRI with cortical wide-field imaging5 and patterned optogenetics4 (Fig. 1a). To relay the light fields for optogenetics and imaging bidirectionally, a fiber bundle (comprised of 100,000 optical fibers) bridges between the external optic setup and MRI. Patterned optogenetic stimulation was implemented using a digital micromirror device (DMD) composed of 2560x1600 pixels, which controls individual pixels to be on or off. As only “on” pixels reflect the incident beam into the fiber bundle, we were able to deliver patterned optogenetic stimulus (455 nm) in any arbitrary shape onto the mouse cortex within the MR bore. We also incorporated a wide-field imaging system allowing cortical surface imaging in either reflectance or fluorescence mode for superficial intrinsic optical signals or the expression of genetically encoded fluorescent indicators. The excitation light for imaging was delivered via an auxiliary illumination fiber coupled to a light-emitting diode (530 nm). Each optical mount, made of MR-compatible plastic, was designed to have translational or rotational adjustments for fine-tuning the image focus and magnification. To obtain whole-brain fMRI with optogenetic stimulation and optical imaging, we prepared the thinned-skull cranial window as shown in Fig. 1b. We used optically transparent D2O-based agarose gel devoid of MRI signals to reduce the magnetic susceptibility artifacts. Three or four phantoms made of a small polyethylene tube encasing H2O-based fluorescent rhodamine B solution were positioned at the circumference of the thinned-skull window for coregistration between optical and MR images (Fig. 1c and Fig. 2a). The coregistration accuracy was assessed by the overlapping of the pial vascular structure. Mouse fMRI was obtained with 2D (FOV: 16 (right-left) × 8 (dorsal-ventral) × 9 (anterior-posterior) mm3, voxel size: 0.167 × 0.167 × 0.5 mm3, TR: 1 s) or 3D (FOV: 16 (right-left) × 8 (dorsal-ventral) × 12 (anterior-posterior) mm3, voxel size: 0.2 mm isotropic, volume TR: 2 s) gradient-echo EPI. We intravenously administered monocrystalline iron oxide nanoparticles (MIONs) to obtain CBV (cerebral blood volume)-weighted fMRI, which provides higher spatial specificity and contrast-to-noise ratio than conventional BOLD fMRI6.Results
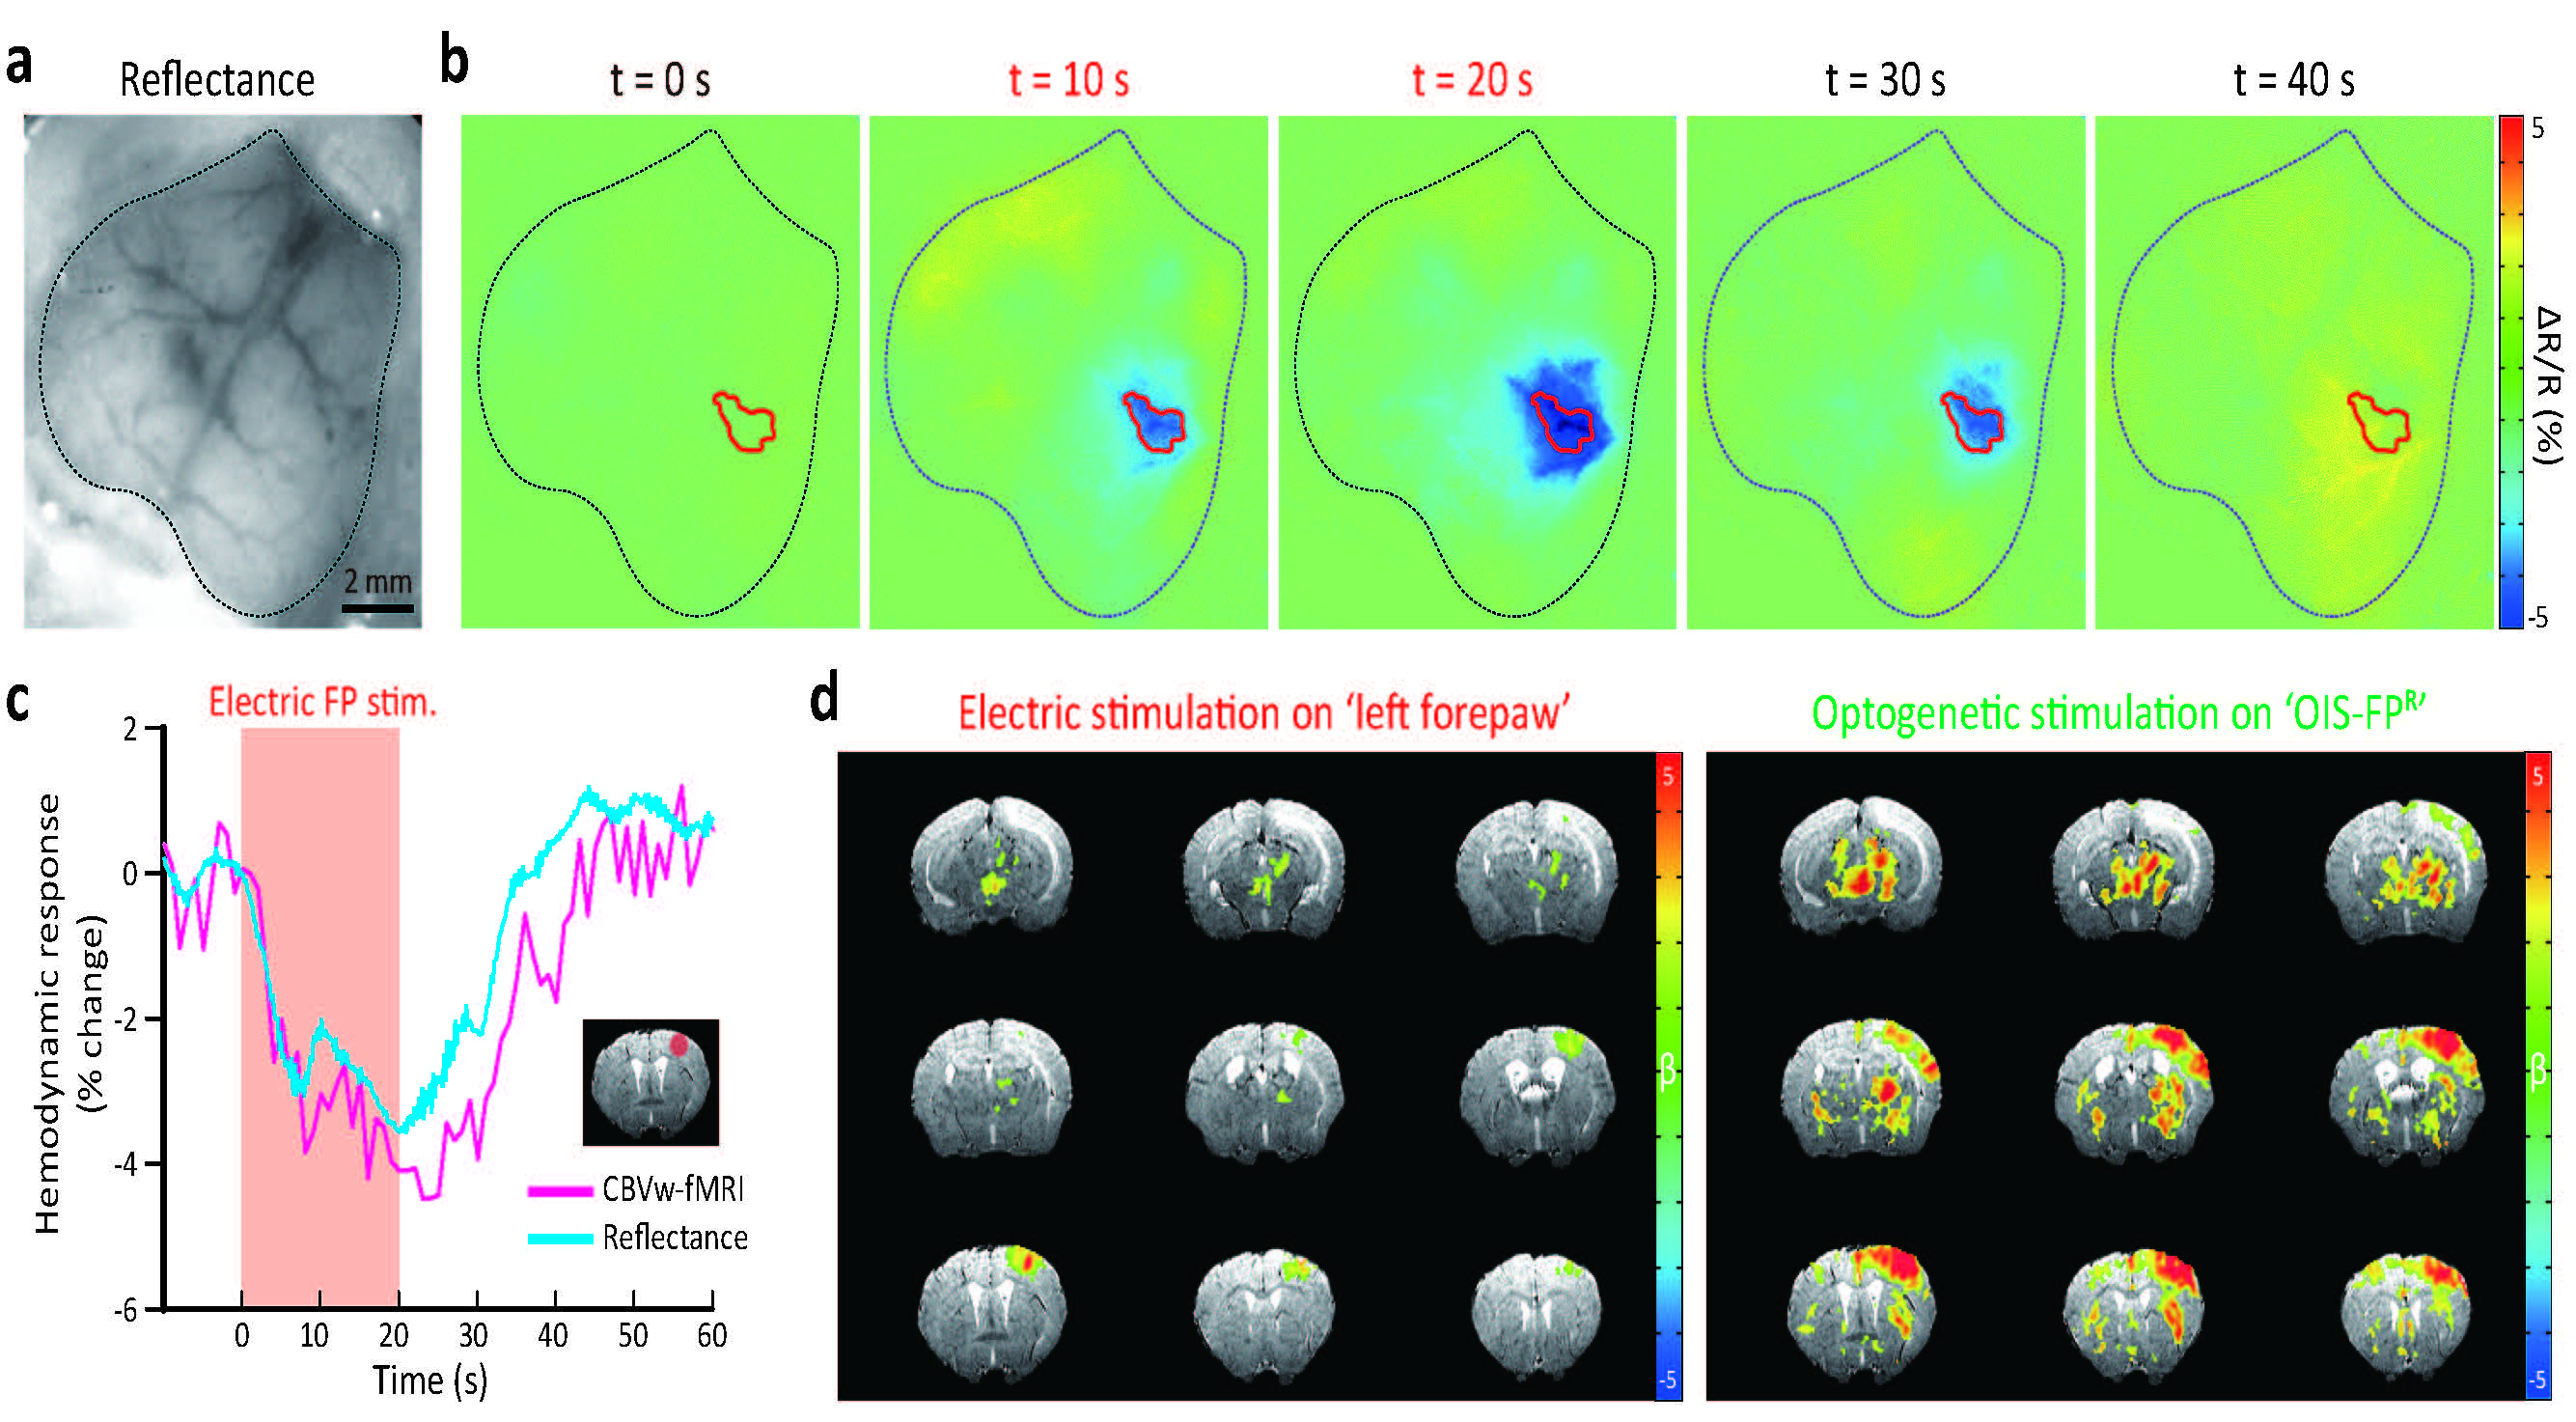
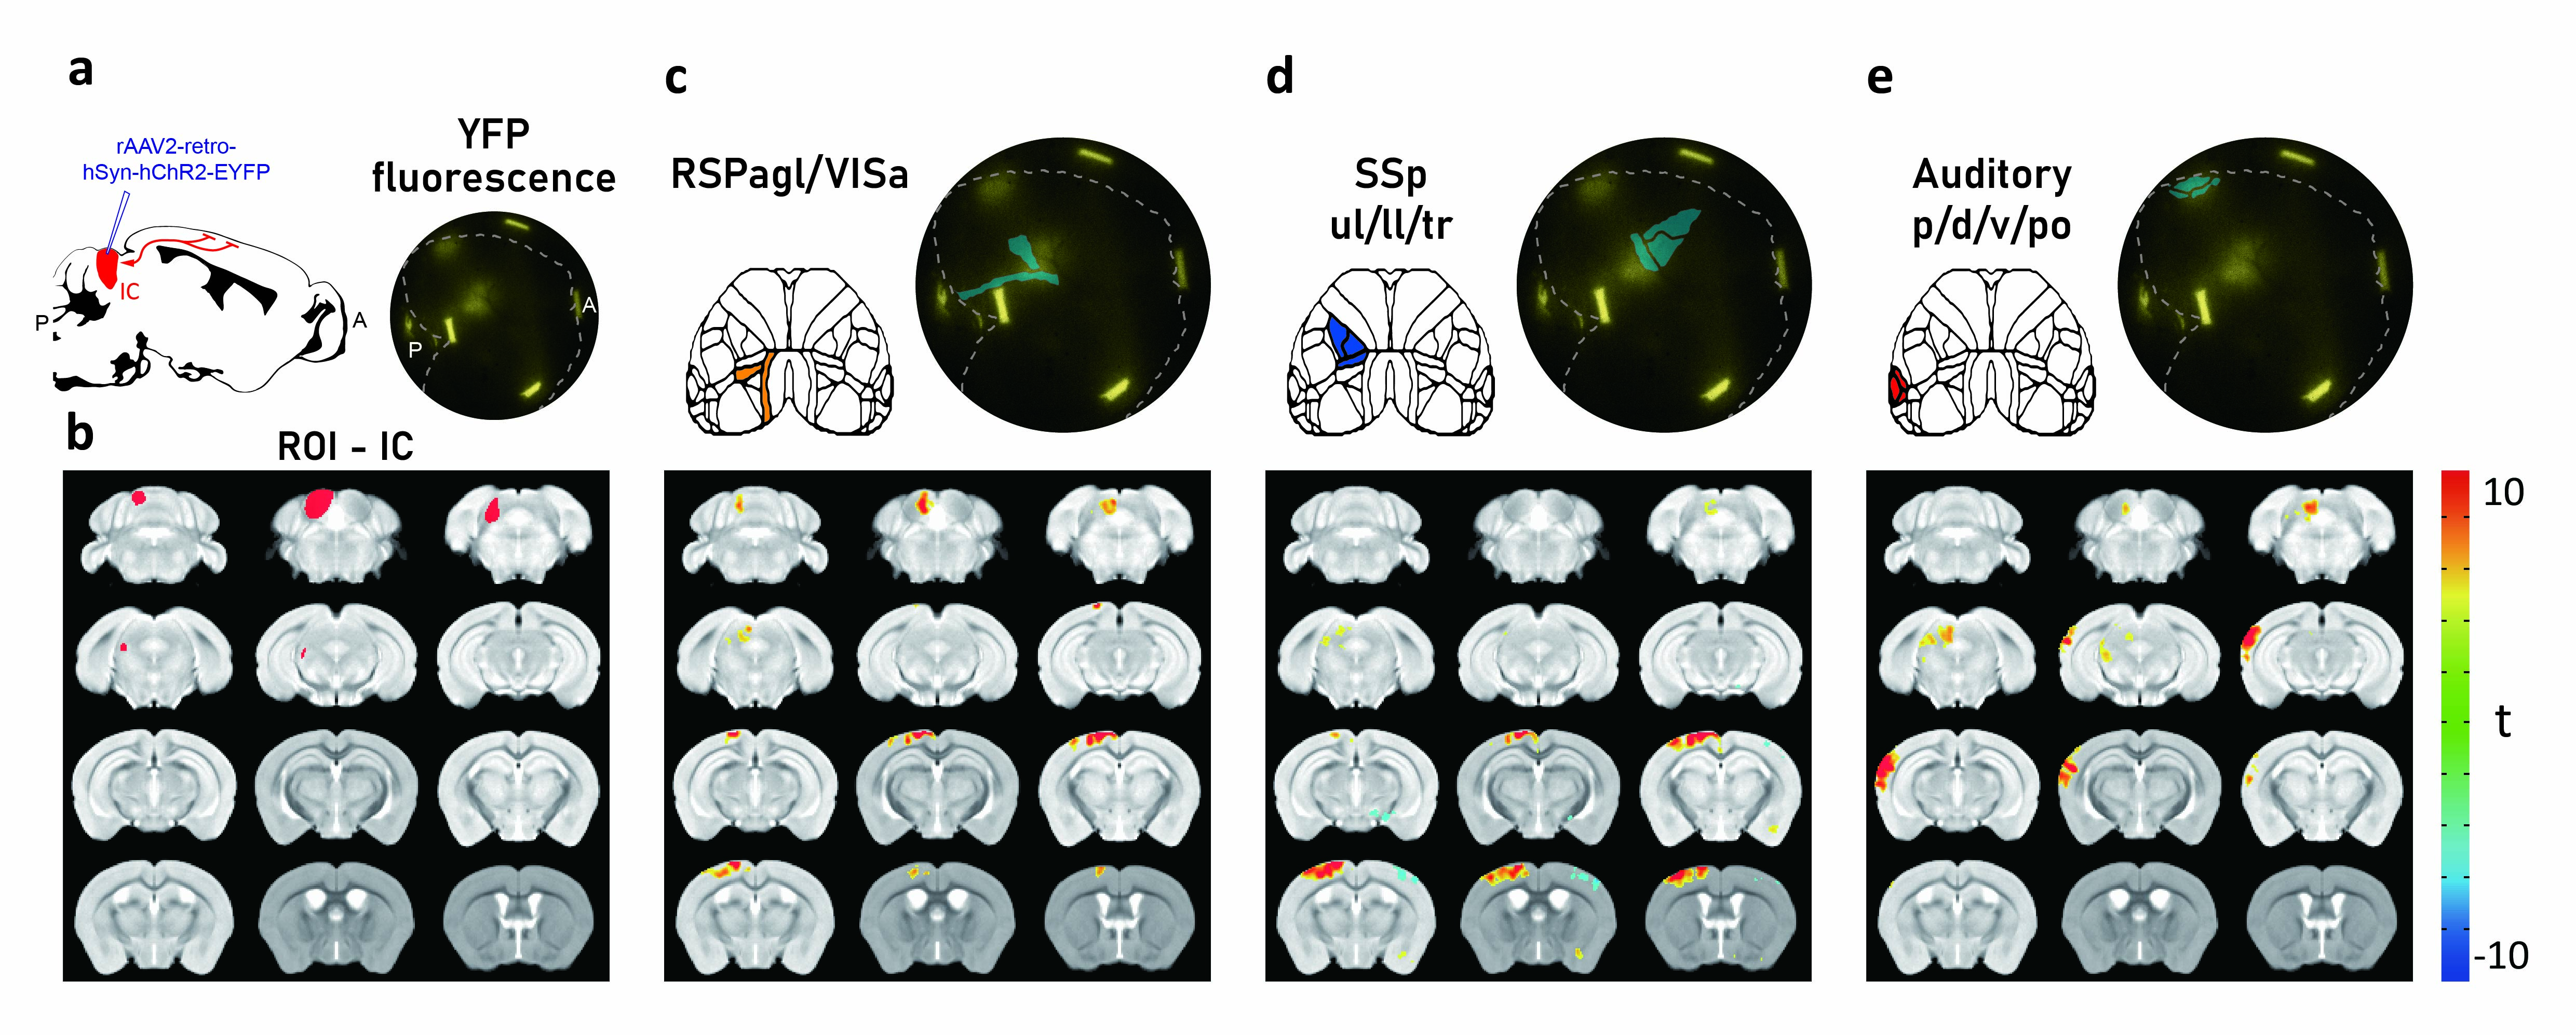
The stimulation sites can be decided by utilizing various types of images either from the optical setup or MRI. To demonstrate this capability, we first created an atlas-based stimulation map by coregistration of our customized mouse brain atlas (based on Allen brain atlas) onto the subject’s fluorescence image (Fig. 2a, b). Note that this procedure, typically done in ~30 min, can be conducted before every experiment to generate patterned optogenetic inputs for individual mice. This stimulation map was used to measure region-specific functional connection in Thy1-ChR2-EYFP mice (channelrhodopsin expression specifically in excitatory neurons). Fig. 2c shows fMRI activation maps evoked by 3 representative ROIs (N=6 animals). Each stimulus induced an increase of CBV in the functionally connected regions. The target region can also be planned by localizing sensory input-induced activation. Simultaneous optical intrinsic signal imaging (OISI; 530 nm for CBV-weighted imaging) and fMRI identified the peak response region in the cortex by forepaw stimulation (Fig. 3a-c). Optogenetic stimulation on the peak region induced responses in the somatosensory network, comparable to forepaw stimulation (Fig. 3d). However, the amplitude of the response to optogenetic stimulation is much higher than the forepaw response, demonstrating the effectiveness of patterned optogenetic stimulation to detect the cortical functional network. A fluorescent tracer can be utilized to confine the target neurons in a circuit-specific manner. A retrograde AAV-ChR2 virus (rAAV2-retro-hSyn-hChR2-EYFP) was injected into the left inferior colliculus (IC), which transfects cortical neurons projecting to IC. We confirmed YFP fluorescence expressed in the auditory/retrosplenial/visual/somatosensory areas (Fig. 4; YFP fluorescence) by overlaying the atlas. Three stimulus patterns planned from the YFP image evoked activation in IC but not much in other projection sites (Fig. 4).Discussion & Conclusion
In summary, we developed a hybrid system combining whole-brain fMRI and cortex-wide optics that provide high flexibility in planning subject-specific patterned optogenetic stimulation. Note that our optic module can be easily assembled with commercially available parts and integrated with existing preclinical MR systems. Thus, we expect that this setup can be readily adopted in various fMRI studies that require i) cell-type-specific stimulation on multiple sites for mapping functional cortico-cortical or subcortical networks or ii) in situ subject-specific stimulation localization based on anatomical or functional imaging.Acknowledgements
This research was supported by the Institute of Basic Science (IBS-R015-D1) and the Basic Science Research Program through the National Research Foundation of Korea (NRF), funded by the Ministry of Education (2019R1C1C1011180, 2019M3A9E2061789, 2019M3E5D2A01058329, 2020M3C1B8016137, and 2020R1A5A1018081).References
1. Lee, J.H. et al. Global and local fMRI signals driven by neurons defined optogenetically by type and wiring. Nature. 2010;465:788.
2. Molyneaux, B.J., Arlotta, P., Menezes, J.R. & Macklis, J.D. Neuronal subtype specification in the cerebral cortex. Nat Rev Neurosci. 2007;8:427-437.
3. Moon, H.S. et al. Contribution of Excitatory and Inhibitory Neuronal Activity to BOLD fMRI. Cereb Cortex. 2021;31:4053-4067.
4. Leifer, A.M., Fang-Yen, C., Gershow, M., Alkema, M.J. & Samuel, A.D. Optogenetic manipulation of neural activity in freely moving Caenorhabditis elegans. Nat Methods. 2011;8:147-152.
5. Lake, E.M.R. et al. Simultaneous cortex-wide fluorescence Ca(2+) imaging and whole-brain fMRI. Nat Methods. 2020;17:1262-1271.
6. Zhao, F., Wang, P., Hendrich, K., Ugurbil, K. & Kim, S.-G. Cortical layer-dependent BOLD and CBV responses measured by spin-echo and gradient-echo fMRI: insights into hemodynamic regulation. Neuroimage. 2006;30:1149-1160.
Figures