4648
Influence of gadoxetate disodium to the liver fat fraction quantified with Dixon sequences in rabbits1Department of Radiology, Xi’an GaoXin Hospital, Xi’an Jiao Tong University, Xi’an, China
Synopsis
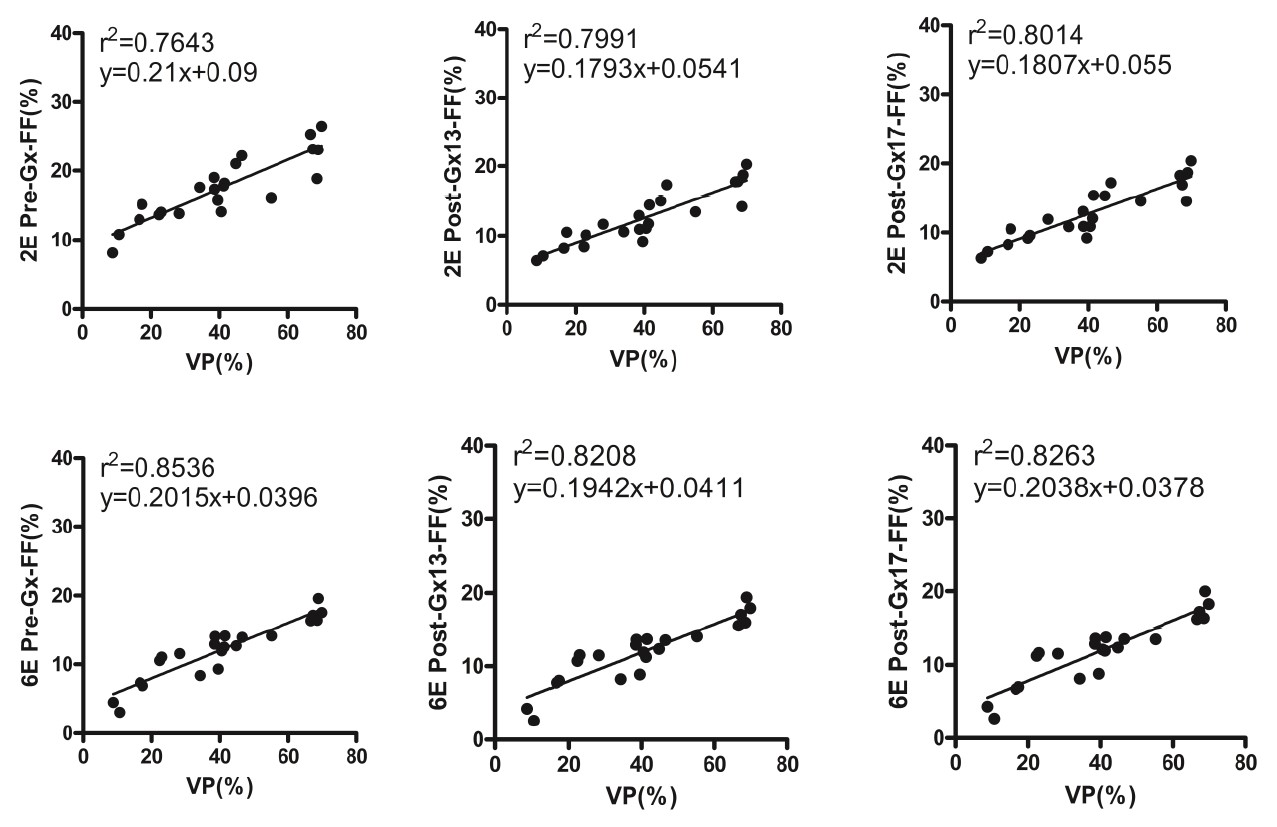
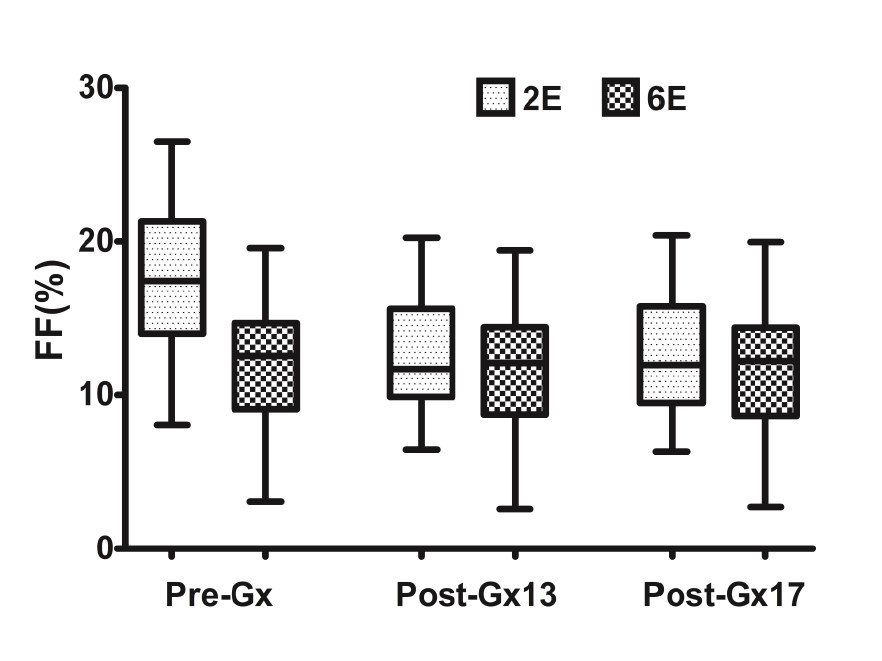
A study was carried out on the effect of Gadoxetate disodium (Gx) on the accuracy of liver fat content determined by 2-echos and 6-echos VIBE Dixon in rabbits with nonalcoholic fatty liver disease in hepatobiliary specific phase. Proton density fat-fraction (PDFF) before and 13min. and 17min. after Gx enhancement had strong correlation with that of histopathology (r22E= 0.7643-0.8014 vs. r26E= 0.8208-0.8536). PDFF measured by 6E-VIBE Dixon was stable and reliable, especially for that before Gx enhancement(r26E= 0.8536). PDFF measured by 2E-VIBE Dixon fluctuated to some extent, however, it could be effectively corrected in the specific hepatobiliary phase after Gx enhancement.
Introduction
Nonalcoholic fatty liver disease (NAFLD) refers to the excessive accumulation of triglycerides in liver cells without other causes (such as drinking). The course of NAFLD can develop from nonalcoholic steatohepatitis, liver fibrosis, cirrhosis to liver cancer [1]. Liver biopsy is the gold standard for the diagnosis and staging of NAFLD, but it is difficult to be used for health screening or longitudinal monitoring of treatment effect due to its invasive operation [2, 3].MR can obtain the information about liver fat content noninvasively [4]. Magnetic resonance spectroscopy (MRS) can obtain the hepatic proton density fat fraction (PDFF) based on the peak value of proton resonance frequency [5]. Although MRS-PDFF has high accuracy and repeatability, it has high requirements for equipment, long acquisition time, complex post-processing program, and therefore is difficult to be widely used [6-8]. Dixon technique can realize the separation of water and fat by using the phase difference of water and fat caused by different echo time, thus observing the fat quantitatively [9]. Dixon can complete hepatic PDFF examination with a single breath-hold, which can overcome the errors caused by T1 bias and T2* attenuation etc. to a great extent [10-12]. Meta analysis shows that there is a good linear relationship between MRI-PDFF(such as Dixon method) and MRS-PDFF, which can be used as an accurate and noninvasive method to evaluate fat contents of liver [13].
Gadoxetate disodium (Gx) is a hepatocyte-specific contrast medium with the peak of Gx uptaken by hepatocytes in 20-40 minutes after intravenous injection [14-16]. Gx is secreted into the biliary system 5 minutes after enhancement, and excreted into the gallbladder in 13 minutes. The effect of Gx enhancement on MRI-PDFF of liver remains to be studied [17, 18]. This study aims to observe the accuracy and stability of PDFF in NAFLD rabbit model quantified with VIBE Dixon at different time points in hepatobiliary specific phase after GX enhancement.
Methods
This study was approved by the institutional animal care and use committee. Forty two healthy male New Zealand White Rabbits(6-8 months age) each weighing 2.2-2.5kg were divided into normal diet control group (n= 10) and high-fat diet NAFLD group (n= 32). Control group was fed with standard diet, and NAFLD group was fed with high-fat diet (88% standard diet + 10% lard + 2% cholesterol) [19]. All examinations was performed at 4 weeks, 8 weeks, 12 weeks and 16 weeks (each n = 8) respectively after such diet.Using 3.0T MR 2E-VIBE Dixon (FA= 10°) and 6E-VIBE Dixon (FA= 5°) techniques, images were collected before Gx (0.025 mmol/ kg) enhancement (Pre-Gx), at 13 minutes (Post-Gx13) and 17 minutes (Post-Gx17) after Gx enhancement, in order to measure the hepatic PDFF.
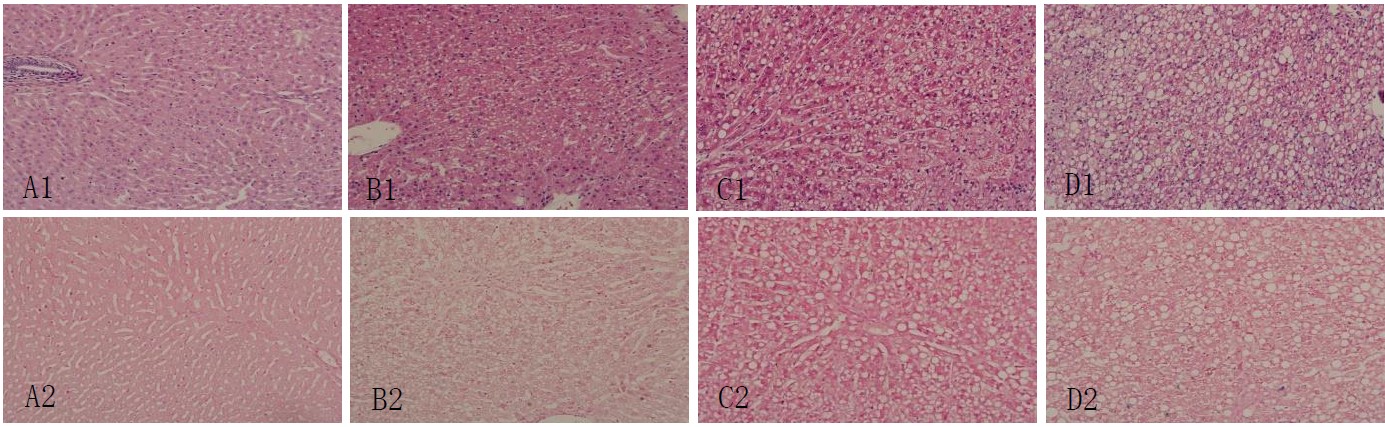
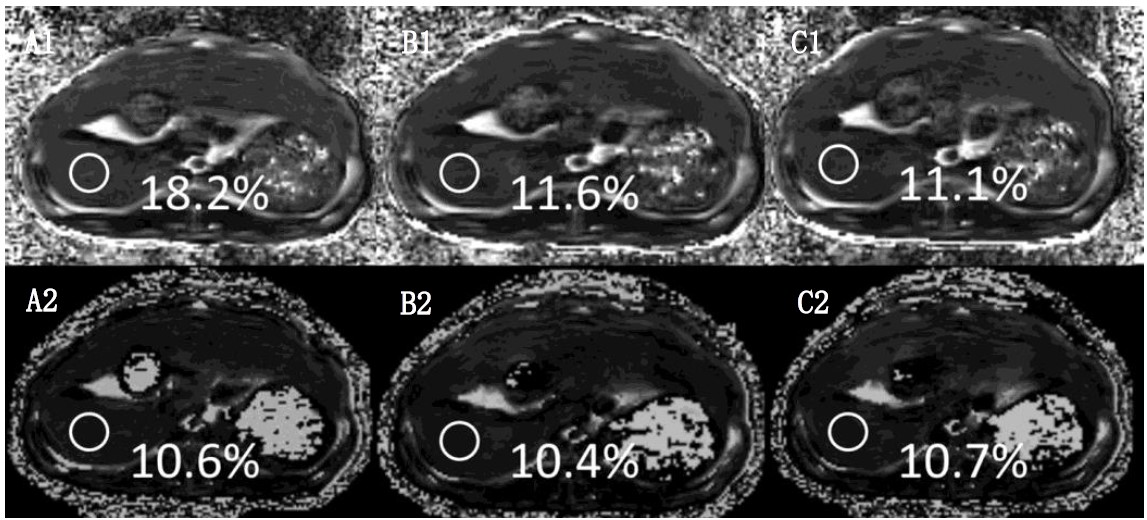
At the bottom of the gallbladder, three circular ROI with an area of 0.3 cm2 were selected in the left lateral lobe, left medial lobe and right lobe of the liver to avoid the main blood vessels and artifacts. The average of the three ROI values was taken as the liver data of the rabbit for subsequent analysis. Histopathological examination was performed to calculate the Vacuole percentage (VP) of fat vacuole area to total area in the microscopic field, and then compared with that of PDFF.
Results
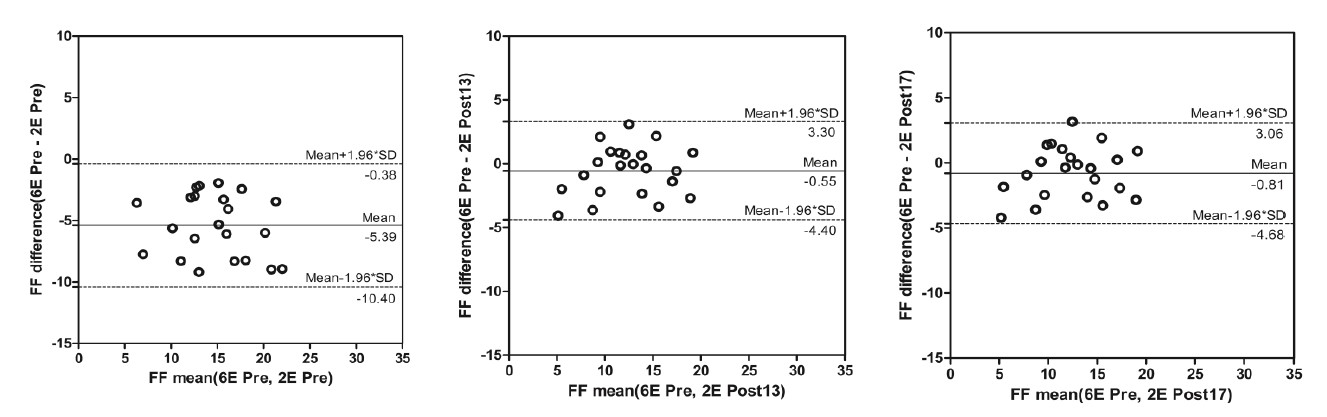
Experiment was completed with 33 rabbits, 12 of which had normal liver, and 22 of which established NAFLD model successfully; Prussian blue staining showed no obvious iron deposition in 33 rabbits (Figure 1). PDFF measured by Dixon imaging in Pre-Gx, Post-Gx13 and Post-Gx17 (Figure 2) had strong correlation with VP (r22E= 0.7643-0.8014 vs. r26E= 0.8208-0.8536), especially for the result of 6E-VIBE Dixon-Pre-Gx (Figure 3).PDFF measured by 2E-VIBE Dixon fluctuated greatly (Figure 4), and PDFF after enhancement was significantly lower than that before enhancement (P< .001). PDFF measured by 2E-VIBE Dixon had the best consistency with 6E-VIBE Dixon-Pre-Gx (Figure 5), but there was no significant difference between Post-Gx13 and Post-Gx17 (P=.123).
After the enhancement of 2E-VIBE Dixon, the signal intensity of water image increased significantly (P < 0.001), while there was no significant difference between Post-Gx13-W and Post-Gx17-W (P= 0.073); moreover, there was no significant difference in signal intensity of fat image before and after enhancement (P= 0.754).
Conclusion
The correction effect of the contrast medium Gx on T1 value was stable in hepatobiliary specific phase, and thus Dixon technology can be used to obtain reliable PDFF.Acknowledgements
NOReferences
References
1.Younossi ZM, Koenig AB, Abdelatif D, Fazel Y, Henry L, Wymer M. Global epidemiology of nonalcoholic fatty liver disease-Meta-analytic assessment of prevalence, incidence, and outcomes. Hepatology 2016; 64(1):73-84. doi:10.1002/hep.28431
2. Marcellin P, Kutala BK. Liver diseases: A major, neglected global public health problem requiring urgent actions and large-scale screening. Liver Int 2018; 38 Suppl 1:2-6. doi:10.1111/liv.13682
3. Younossi ZM. Non-alcoholic fatty liver disease - A global public health perspective. J Hepatol 2019; 70(3):531- 544. doi:10.1016/j.jhep.2018.10.033
4.Longo R , Pollesello P , Ricci C , et al . Proton MR spectroscopy in quantitative in vivo determination of fat content in human liver steatosis . J Magn Reson Imaging 1995 ; 5(3): 281-285. doi: 10.1002/jmri.1880050311.
5.Reeder SB, Cruite I, Hamilton G, Sirlin CB. Quantitative Assessment of Liver Fat with Magnetic Resonance Imaging and Spectroscopy. J Magn Reson Imaging 2011; 34(4):729-749.doi:10.1002/jmri.22775
6.Wáng YXJ, Wang X, Wu P, et al. Topics on quantitative liver magnetic resonance imaging. Quant Imaging Med Surg. 2019 Nov;9(11):1840-1890. doi: 10.21037/qims.2019.09.18.
7. Idilman IS, Keskin O, Celik A, et al. A comparison of liver fat content as determined by magnetic resonance imaging-proton density fat fraction and MRS versus liver histology in non-alcoholic fatty liver disease. Acta Radiol 2016; 57(3):271-278. doi:10.1177/0284185115580488
8. Dixon WT. Simple proton spectroscopic imaging. Radiology. 1984;153(1):189–194. doi:10.1148/radiology. 153.1.6089263
9.Kukuk GM, Hittatiya K, Sprinkart AM, et al. Comparison between modified Dixon MRI techniques, MR spectroscopic relaxometry, and different histologic quantification methods in the assessment of hepatic steatosis. Eur Radiol 2015; 25(10):2869-2879.doi:10.1007/s00330-015-3703-6
10.Liu CY, McKenzie CA, Yu H, Brittain JH, Reeder SB. Fat quantification with IDEAL gradient echo imaging: correction of bias from T(1) and noise. Magn Reson Med. 2007;58(2):354‐364. doi:10.1002/mrm.21301
11.Yu H, McKenzie CA, Shimakawa A, et al. Multiecho reconstruction for simultaneous water-fat decomposition and T2* estimation. J Magn Reson Imaging. 2007;26(4):1153–1161. doi:10.1002/jmri.21090
12.Yokoo T, Serai SD, Pirasteh A, et al. Linearity, Bias, and Precision of Hepatic Proton Density Fat Fraction Measurements by Using MR Imaging: A Meta-Analysis. Radiology 2018; 286(2):486-498. doi:10.1148/radiol.2017170550
13.Hamm B, Staks T, Mühler A, et al. Phase I clinical evaluation of Gd-EOB-DTPA as a hepatobiliary MR contrast agent: safety, pharmacokinetics, and MR imaging. Radiology. 1995;195(3):785–792. doi:10.1148/radiology. 195. 3.7754011
14.Reimer P, Rummeny EJ, Shamsi K, et al. Phase II clinical evaluation of Gd-EOB-DTPA: dose, safety aspects, and pulse sequence. Radiology. 1996;199(1):177–183. doi:10.1148/radiology.199.1.8633143
15.Ringe KI, Husarik DB, Gupta RT, Boll DT, Merkle EM. Hepatobiliary transit times of gadoxetate disodium (Primovist®) for protocol optimization of comprehensive MR imaging of the biliary system--what is normal? Eur J Radiol. 2011;79(2):201–205. doi:10.1016/j.ejrad.2010.03.008
16.Hayashi T, Fukuzawa K, Kondo H, et al. Influence of Gd-EOB-DTPA on proton density fat fraction using the six-echoDixon method in 3 Tesla magnetic resonance imaging. Radiol Phys Technol 2017; 10(4):483-488.doi:10.1007/s12194-017-0420-7
17.Hernando D, Wells SA, Vigen KK, Reeder SB. Effect of hepatocyte-specific gadolinium-based contrast agents on hepatic fat-fraction and R2(⁎). Magn Reson Imaging. 2015;33(1):43–50. doi:10.1016/j.mri.2014.10.001
18. Fu JF, Fang YL, Liang L, Wang CL, Hong F, Dong GP. A rabbit model of pediatric nonalcoholic steatohepatitis: the role of adiponectin. World J Gastroenterol 2009; 15(8):912-918.doi: 10.3748/wjg.15.912
19.Brunt EM, Janney CG, Di Bisceglie AM, Neuschwander-Tetri BA, Bacon BR. Nonalcoholic steatohepatitis: a proposal for grading and staging the histological lesions. Am J Gastroenterol. 1999;94(9):2467-2474. doi:10.1111/ j.1572-0241.1999.01377.x
20.Deugnier Y, Turlin B. Pathology of hepatic iron overload. World J Gastroenterol. 2007;13(35):4755-4760. doi:10.3748/wjg.v13.i35.4755
21.Haimerl M, Probst U, Poelsterl S, et al. Evaluation of two-point Dixon water-fat separation for liver specific contrast-enhanced assessment of liver maximum capacity. Sci Rep. 2018;8(1):13863. doi:10.1038/s41598-018- 32207-6
22.Caravan P, Ellison JJ, McMurry TJ, Lauffer RB. Gadolinium(III) Chelates as MRI contrast agents: structure, dynamics, and applications. Chem Rev 1999; 99(9):2293-352. doi: 10.1021/cr980440x.
23.Park CC, Hamilton G, Desai A, et al. Effect of intravenous gadoxetate disodium and flip angle on hepatic proton density fat fraction estimation with six-echo, gradient-recalled-echo, magnitude-based MR imaging at 3T. Abdom Radiol (NY). 2017;42(4):1189–1198. doi:10.1007/s00261-016-0992-4
24. Wang X, Colgan TJ, Hinshaw LA, et al. T1 -corrected quantitative chemical shift-encoded MRI. Magn Reson Med 2020;83(6):2051-2063. doi: 10.1002/mrm.28062
25.Henninger B, Kremser C, Rauch S et al.Evaluation of liver fat in the presence of iron with MRI using T2* correction: a clinical approach. Eur Radiol 2013;23(6):1643–1649. doi: 10.1007/s00330-012-2745-2
26. Nelson JE, Klintworth H, Kowdley KV. Iron metabolism in Nonalcoholic Fatty Liver Disease. Curr Gastroenterol Rep. 2012;14(1):8-16. doi: 10.1007/s11894-011-0234-4
27.Haimerl M, Verloh N, Zeman F, et al. Gd-EOB-DTPA-enhanced MRI for evaluation of liver function: comparison between signal-intensity-based indices and T1 relaxometry. Sci Rep. 2017;7:43347. doi:10.1038/ srep43347
28.Yoo H, Lee JM, Yoon JH, et al. T2* Mapping from Multi-Echo Dixon sequence on Gadoxetic acid-enhanced magnetic resonance imaging for the hepatic fat quantification: can it be used for hepatic function assessment? Korean J Radiol. 2017;18(4):682‐690. doi:10.3348/kjr.2017.18.4.682
Figures