4642
Detection of cranial nerve degeneration in a transgenic Parkinson’s disease model marmoset using multi-contrast mechanism MRI1Tokyo Metropolitan University, Tokyo, Japan, 2RIKEN Center for Brain Science, Saitama, Japan, 3The Jikei University, School of Medicine, Tokyo, Japan
Synopsis
In this study, we evaluated the characteristics of the brain in a genetically modified marmoset model of Parkinson’s disease. Various contrast mechanism images were acquired using magnetic resonance imaging (MRI), and the whole brain underwent explorative investigation with each contrast. This study was evaluated for Parkinson’s disease marmoset by anatomical MRI, neural fiber tractography and awakening state functional MRI. Malti-contrast MRI showed diseases characteristics in the thalamus, the nigral striatum, motor circuit and anymore. The findings suggest that the marmoset is useful as a model animal to study human diseases.
Introduction
Parkinson’s disease (PD) is an intractable neurodegenerative disease, and there has been increasing interest in the methods for its diagnosis and treatment. The disease is predominantly characterized by extrapyramidal symptoms and movement disorders. It is difficult to detect PD at an early stage and distinguish it from other diseases in differential diagnosis, such as dementia. Thus far, we have succeeded in developing a gene-modified PD model using the common marmoset by mutated α-synuclein transgenics (1). Using this animal, we have pursued identifying imaging findings that can detect PD at a very early stage. Using magnetic resonance imaging (MRI), it is possible to obtain the anatomical, functional, and neural fiber information concerning brain tissue. By acquiring images of various contrasts and performing brain MRI evaluation, we comprehensively evaluated the characteristics of gene-modified PD model animals.Methods
The experiments were conducted using the common marmoset (Callithrix jacchus), a nonhuman primate. During MRI, the animals were managed by inducing gas anesthesia using a mixture of 1.8–2.5% isoflurane and 0.3 L/min oxygen (not anesthetized in fMRI). Furthermore, the heart rate, respiratory rate, SPO2, and rectal temperature of the animals were monitored and controlled during the scans. The PD model group that had undergone gene modification and was developed in this laboratory (n=2, mean age = 6.6 years) and the healthy control group that had undergone the natural development process (n = 10, mean age = 6.1 years) were compared. MRI was performed using a 9.4-T MRI scanner (Biospec 94/30 MRI; Bruker BioSpin, Ettlingen, Germany) where the T1-weighted images (WI), T2WI, DWI (b-value 1000 and 3000 s/mm2), magnetization transfer ratio (MTR), and awakening-state functional MRI (As-fMRI) were acquired. We used T1WI and T2WI images as T1/T2 to produce an image that emphasized the myelin sheath (2). The MTR image was calculated using an image that was taken to which an MT pulse was not applied (3). For DWI, values of diffusion metrics were calculated using tensor (4) and NODDI analysis (5). These anatomical and diffusion images were evaluated for observations of degeneration in different brain regions using MATLAB 2018a and SPM12. Using respective images from the healthy group and PD model group calculations, we carried out comparisons between the two groups with a voxel-based meta-analysis (VBA). We also visualized the nigrostriatal pathway specific to PD using DWI with the ROIs in the substantia nigra and striatum. For as-fMRI, brain activity was calculated using a correlation coefficient matrix between whole brain regions. The whole brain matrix was evaluated by focusing on motor circuits such as the thalamus and striatum. This study was approved by the local Animal Experiment Committee and was conducted in accordance with the Guidelines for Conducting Animal Experiments of the RIKEN CBS.Results
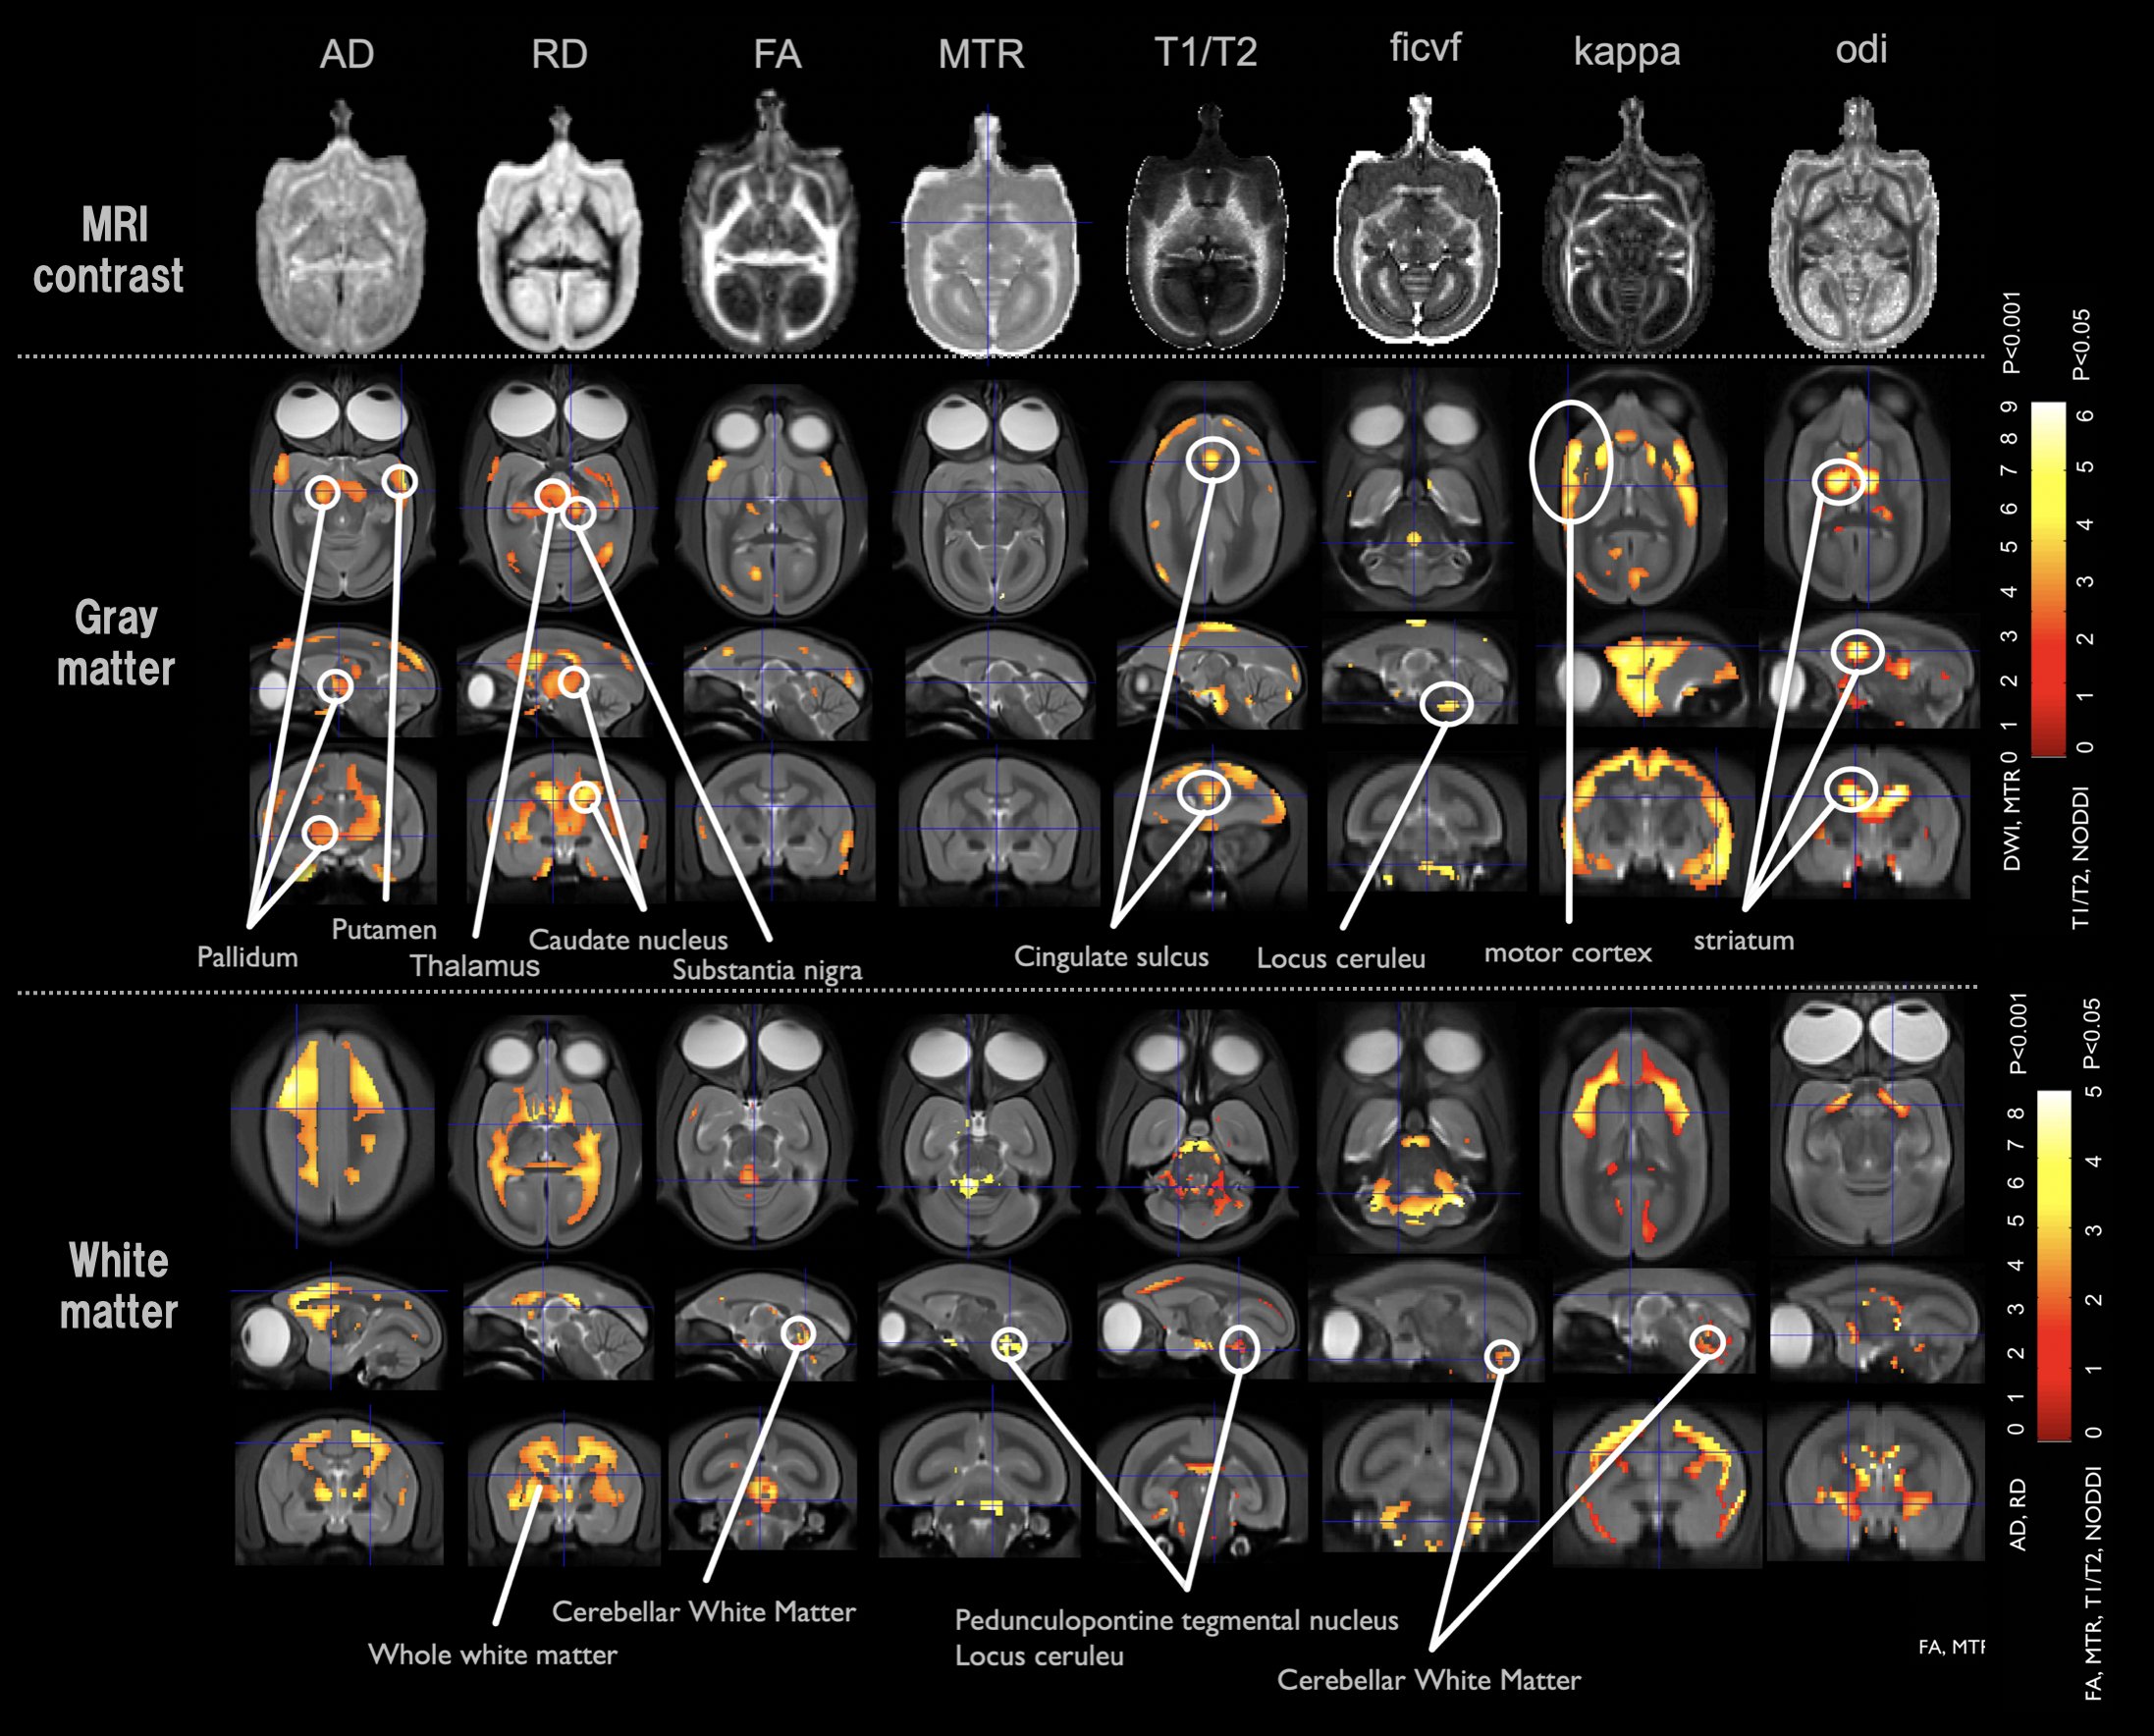
We performed comparisons between the PD model and healthy control groups. In the VBA (Figure 1), we detected significant changes in the thalamus in the T1/T2 image. In the diffusion image, there was a significant difference in the RD and odi values of the two groups. In terms of the brain area, there were large changes in the thalamus and striatum. In the MTR image, we detected changes in areas including the nigral striatum and superior colliculus. The neural fiber visualization revealed drastic reduction of fiber numbers projecting to the striatum from the substantia nigra in PD model marmosets (Figure 2). In the as-fMRI, the connectivity of the direct and indirect pathways followed by the nigrostriatal pathway also showed a similar alteration in PD patients, with reduced activity in the direct pathway and increased activity in the indirect pathway, in addition to reduced activity of the nigrostriatal pathway (Figure 3).Discussion
Compared to clinical studies previously conducted in humans, degeneration was observed in several areas (6, 7). There have been reports (8) that describe changes in the nigral striatum, superior colliculi, and thalamus, and it was suggested that the gene-modified marmoset model in this study may have exhibited similar neurodegeneration (9). Furthermore, we have been able to observe changes in the microstructure of the brain using NODDI VBA. In an as-fMRI study, the same results as in a previous human’s study (10) were obtained regarding changes in the connectivity of the striatum-thalamus and putamen-subthalamic nucleus. In addition, the striatal-thalamus and substantia nigrastriatum-striatum were found to show the difference between the two groups in the input/output relationship in the motor loop model. Further studies will clarify the detailed pathological changes of neuronal networks in PD, by using this transgenic PD marmoset model. Therefore, marmosets that have undergone genetic modification in this study can be used as a model animal for the study of human diseases and to develop a method for the very early diagnosis of the disease and development of treatments.Conclusion
We explored the differences in anatomical, functional, and neural fiber information using multicontrast mechanism MRI between PD and control groups with common marmosets. MRI result changes between those groups were observed in some brain regions, which were pointed out in a previous clinical study. This study can be a step to explain the cause of PD.Acknowledgements
This work was supported by the program for Brain Mapping by Integrated Neurotechnologies for Disease Studies (Brain/MINDS) from the Japan Agency for Medical Research and Development (AMED) (Grant Number JP21dm0207001), JSPS KAKENHI (Grant Number JP20H03630), and by “MRI platform” as a program of Project for Promoting public Utilization of Advanced Research Infrastructure of the Ministry of Education, Culture, Sports, Science and Technology (MEXT), Japan.
References
(1) Sasaki et al., Nature 2009.
(2) Ganzetti M, et al., Front Hum Neurosci. 2014.
(3) Engelbrecht V. et al.,Am J Neuroradiology. 1998.
(4) Basser PJ, et al., Biophysical journal. 1994.
(5) Zhang H., et al., Neuroimage. 2012
(6) Nan-Kuei Chen et al., Brain Connectivity. 2018.
(7) Anil Y et al., Academic Radiology. 2007.
(8) Hikishima, K., et al., NEUROSCIENCE. 2015.
(9) Padovani A et al., J Neurol Neurosurg Psychiatry. 2006.
(10) Zhan Wang. et al., Neurological Sciences. 2016.
Figures

Voxel Based multi parametric
meta-Analysis (relaxation, MTR, Tensor and NODDI)
The results of the VBA analysis of diffusion tensor (AD, RD, FA), NODDI (icvf, odi, kappa), MTR, and T1/T2 images are shown. These were then divided into the cortex and white matter before subjecting each to VBA analysis. Comparisons were made between the control group (n = 10) and Parkinson's disease model group (n = 2) using SPM12 with each metrics images. The results of the analysis and statistical figures have been shown.
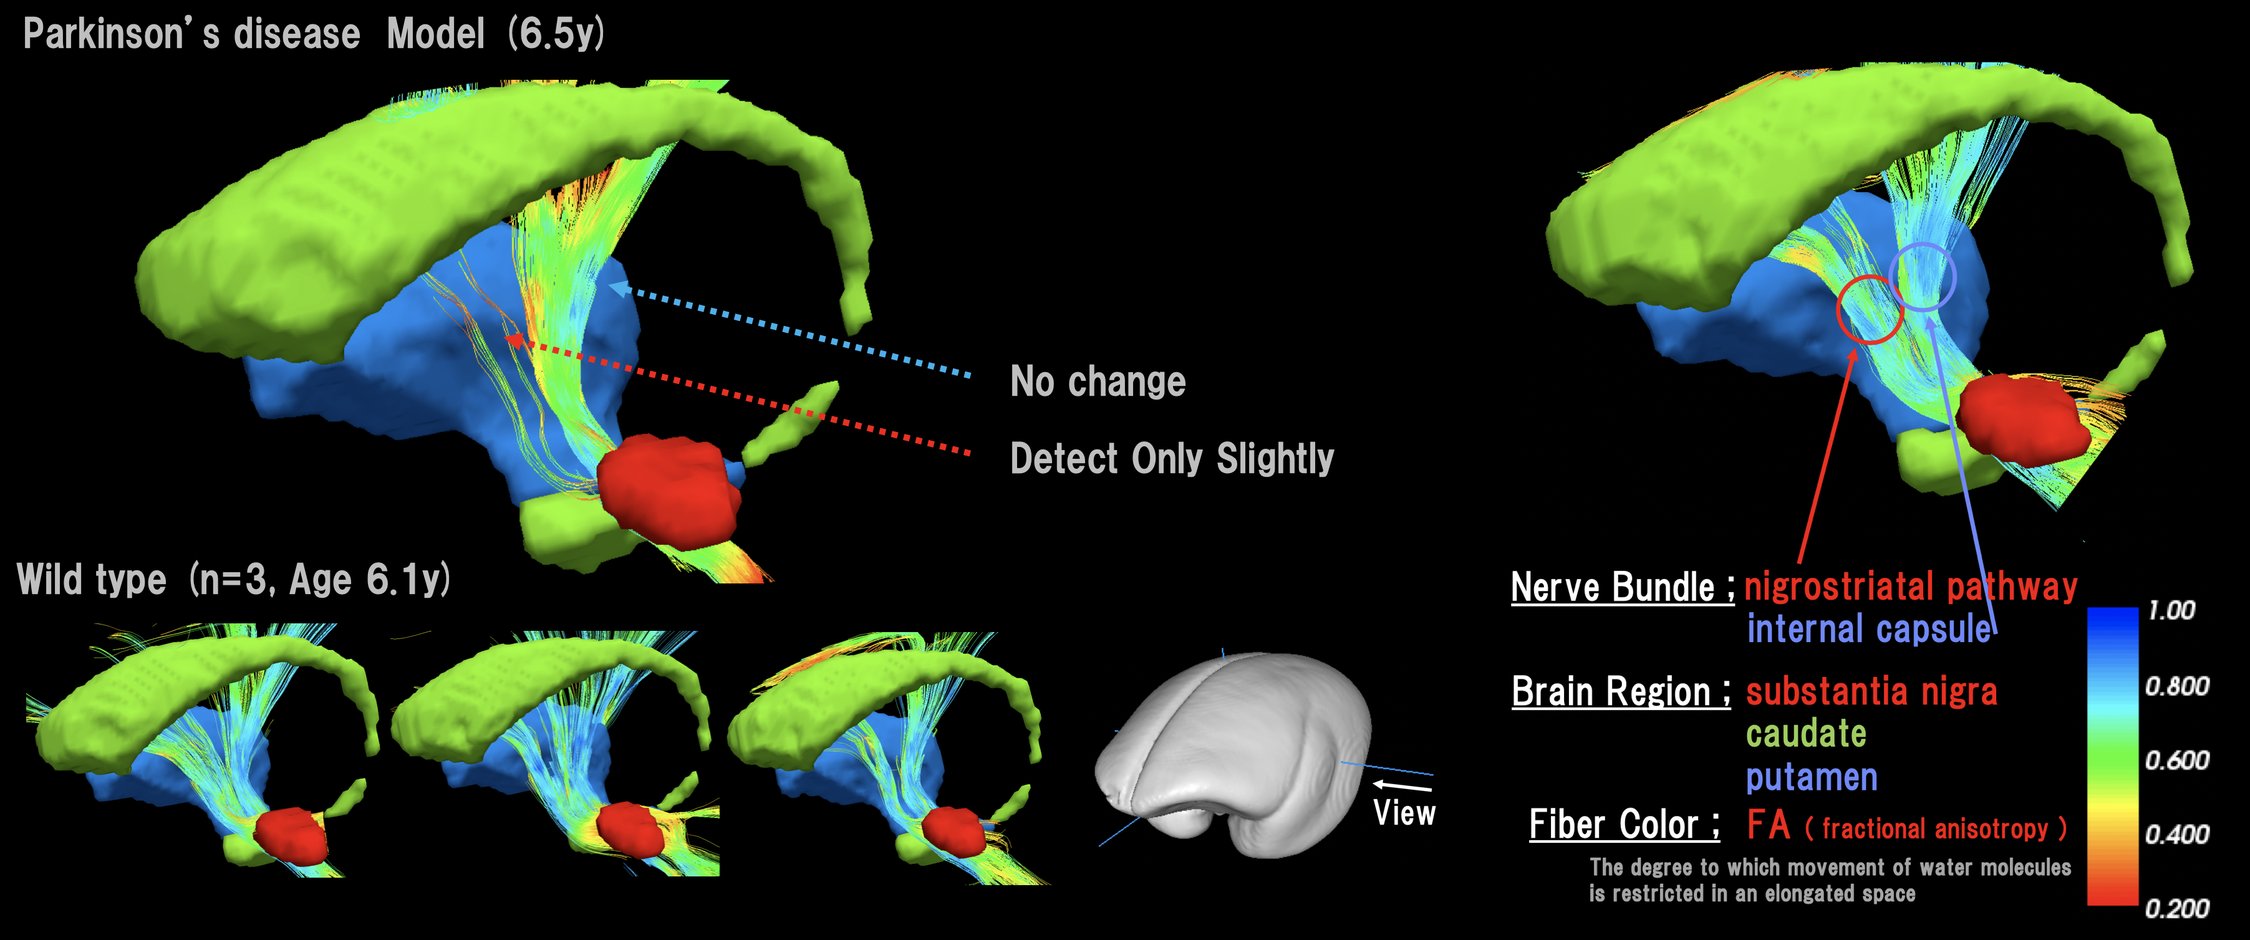
Diffusion Neural Fiber Tracking focused on Nigrostrial Pathway
This figure was visualized the nigrostrial pathway specific to PD using DWI by using the ROIs in the substantianigra and striatum. The displayed brain region is red: substantia nigra, green: caudate, brue: putamen. The diffusion neural fiber is colored to reflect the FA value of the voxel.
Awakening state functional MRI for whole brain and focused on motor circuit
This figure shown resting-state functional MRI and compared PD-related circuit connectivity in PD model marmoset with age-matched wild-type marmosets (upper left). Only moter-related circuits were sampled from the correlation coefficient matrix of the whole brain. As the next step, the difference matrix between the control and PD model marmoset was subtracted (left bottom). The right figure shows data obtained by extracting the PD-related circuit from The left bottom matrix data.