4641
Quantifications of Relative Cerebral Blood Volume and MRS metabolites in Aging Collapsin Response Mediator Protein 1 Gene Knockout Mice1Department of Biomedical Engineering and Environmental Sciences, National Tsing Hua University, Hsinchu, Taiwan, Hsinchu, Taiwan, 2Institute of biomedical engineering and nanomedicine, National Health Research Institutes, Miaoli, Taiwan, Miaoli, Taiwan, 3Graduate Institute of Life Sciences, National Defense Medical Center, Taipei City 114, Taiwan, Taipei, Taiwan, 4Department of Bioscience Technology, Chung Yuan Christian University, Taoyuan City 320, Taiwan, Taoyuan, Taiwan
Synopsis
Aging and collapsin response mediator protein 1 (CRMP-1) gene knockout (KO) mice may exhibit neural disorganization in hippocampus and demonstrate memory and spatial learning dysfunction. The purpose of this study was to quantify relative cerebral blood volume (rCBV) and MRS metabolites in hippocampus in wild type and aging CRMP-1 KO mice. There was no significant difference of rCBV value between the two groups. In comparison with wild type (WT) mice, KO mice possessed significant lower Glx/t-Cr level in hippocampus, illustrating the altered neural transmission function in aging CRMP-1 KO mice.
Introduction
Collapsin response mediator protein 1 (CRMP-1) gene involves in the neurite outgrowth of hippocampus and may be related to the pathological mechanism of psychotic disorder (1,2). Aging and CRMP-1 gene deficient mice may result in neural disorganization in the hippocampus and demonstrate memory and spatial learning dysfunction (1,3,4).Studies have shown that neurogenesis and several central nervous system diseases may influence the biomechanics of angiogenesis (5-7). A relative cerebral blood volume (rCBV), computed by perfusion MRI to quantify the amount of blood volume within the tissue (8), was served as an index to correlate with progression of psychosis (9). However, the impact of CRMP-1 gene knockout (KO) on rCBV is not clear.
From an insight of bio-metabolism, diseases related to central nervous system may alter the biomechanics of neurons and display abnormal metabolite concentrations (10,11). Magnetic resonance spectroscopy (MRS), which can noninvasively quantify concentrations of various metabolites, has been used to assess neurological disorders (10). The glutamine/glutamate (Glx), one of the MRS metabolites, plays an important role in the process of neurotransmission. Several psychotic diseases demonstrated abnormal Glx concentrations (11-13). Nevertheless, potential changes of Glx in mice with CRMP-1 KO has not been reported.
In this study, we quantified rCBV and MRS metabolites in hippocampus. The purpose of this study was to explore the changes of rCBV and metabolites in aging CRMP-1 KO mice.
Methods
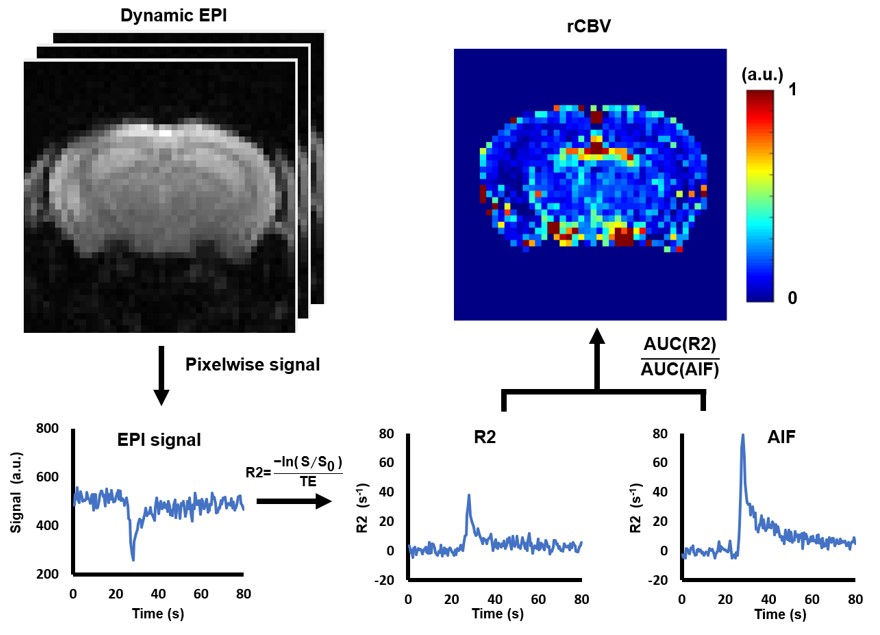
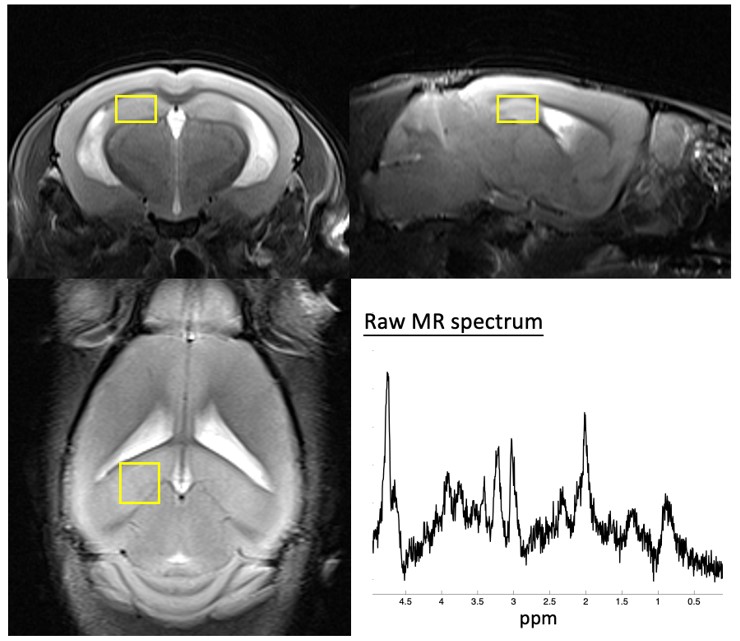
Twenty-six 15-month-old C57BL/6 mice (wild type (WT)=14, KO=12) were recruited in this study. The CRMP-1 gene was knockout based on the methods described previously (1). Perfusion images were acquired by echo-planar imaging in a 7-Tesla MR scanner (ClinScan, Bruker) in a transverse view of mouse brain at bregma=-2.7 mm with TR/TE=500/18 ms, FOV=24x24 mm2, matrix size=96x96, slice thickness=0.6 mm, temporal resolution=0.5 s, and total scanning time=120 s. Gadolinium (0.1 mmol/kg) was intravenously injected via tail vein at t=20s. T2WI was acquired for determining the region-of-interests (ROI) of the left and right hippocampus (TR/TE=2600/42 ms, FOV=20x20 mm2, matrix size=256x256, slice thickness=0.6 mm). For MRS acquisition, metabolite signals in left dorsal hippocampus was obtained through single-voxel-spectroscopy with a spin echo localization method (TR/TE=2000/10 ms, bandwidth=3000 Hz, voxel size=1.5x1.5x1 mm3, number of averages=512). Shimming was performed over a 2x2x1.5 mm3 volume containing the target voxel based on water suppression signal.Figure 1 demonstrates the flowchart of rCBV calculation. Dynamic EPI signals were converted to the change of T2* relaxation rate, R2*, as follows (8):
$$ R2^{*}=\frac{-ln(s/s_{0})}{TE} $$
where S is the signal intensity at each time frame, and S0 is the baseline signal averaged by the 5th ~14th frame of the EPI images without Gd-enhancement. The pixel with appropriate arterial input function (AIF) was selected semi-automatically according to the R2 curve. The rCBV maps were obtained by pixelwise calculation of the ratio of area-under-curve between ΔR2 and AIF. The ROIs of the left and right hippocampus determined in T2WI were overlaid on the rCBV maps and mean rCBV values in hippocampus were computed. Student t test was performed when appropriate and p<0.05 was considered statistically significant.
MRS data were processed using jMRUI software (Figure 2). The MRS metabolites, N-acetyl aspartate (NAA), Glx, total creatine (t-Cr), total choline (t-Cho), and myo-inositol (MI) were quantified by using AMARES algorithm (14).
Results
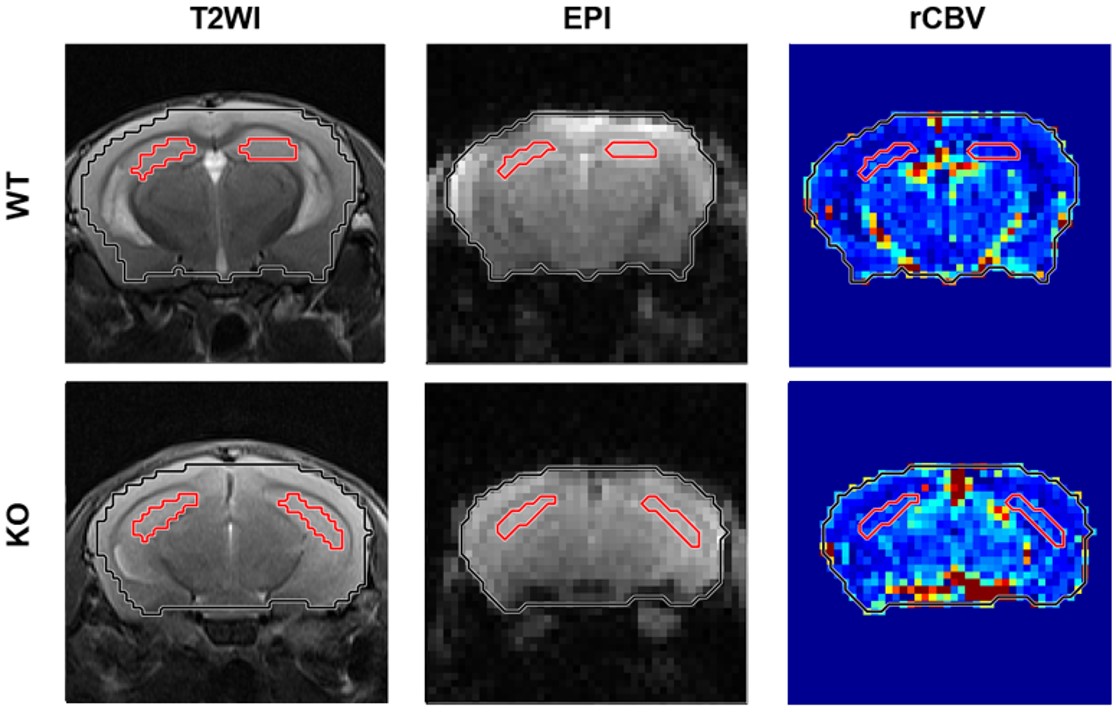
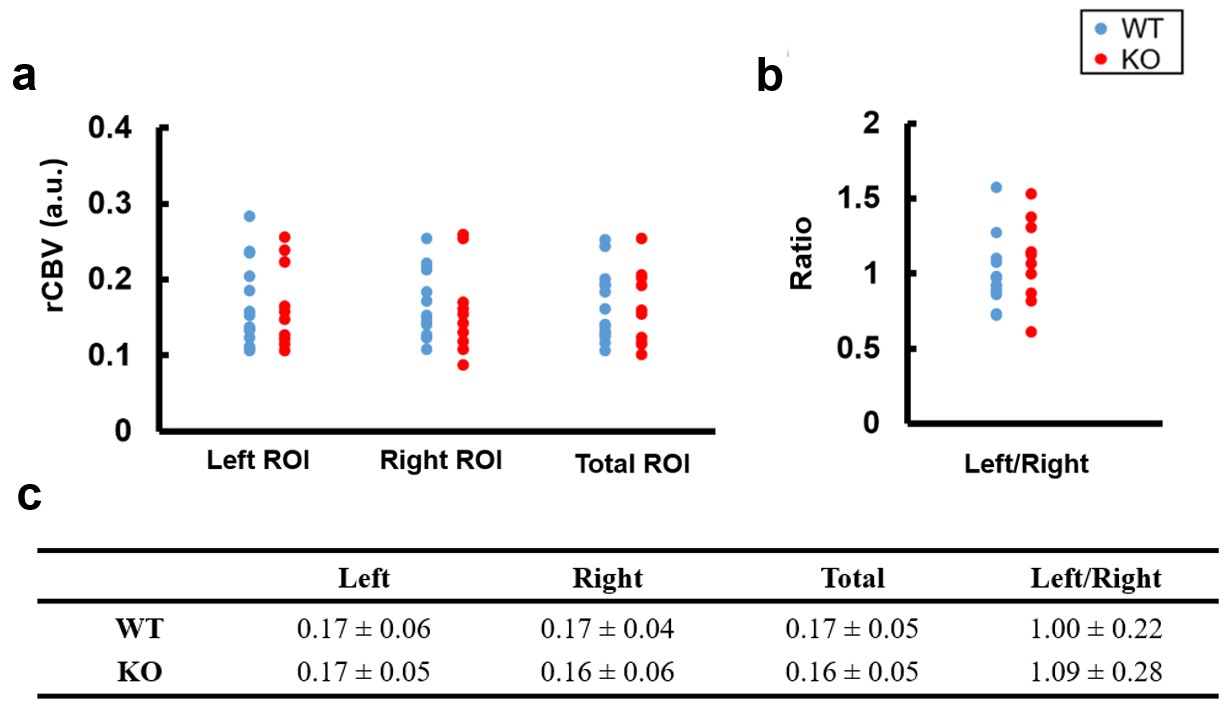
Figure 3 displays the determined hippocampus ROIs overlaid with T2WI, EPI, and rCBV maps in a WT and KO mouse.Figure 4 shows the mean rCBV of the left, right, and total (left + right) hippocampus and the rCBV ratio of left to right hippocampus in WT and KO groups. There is no significant difference of rCBV in left, right, and total hippocampus between WT and KO groups (all p>0.05).
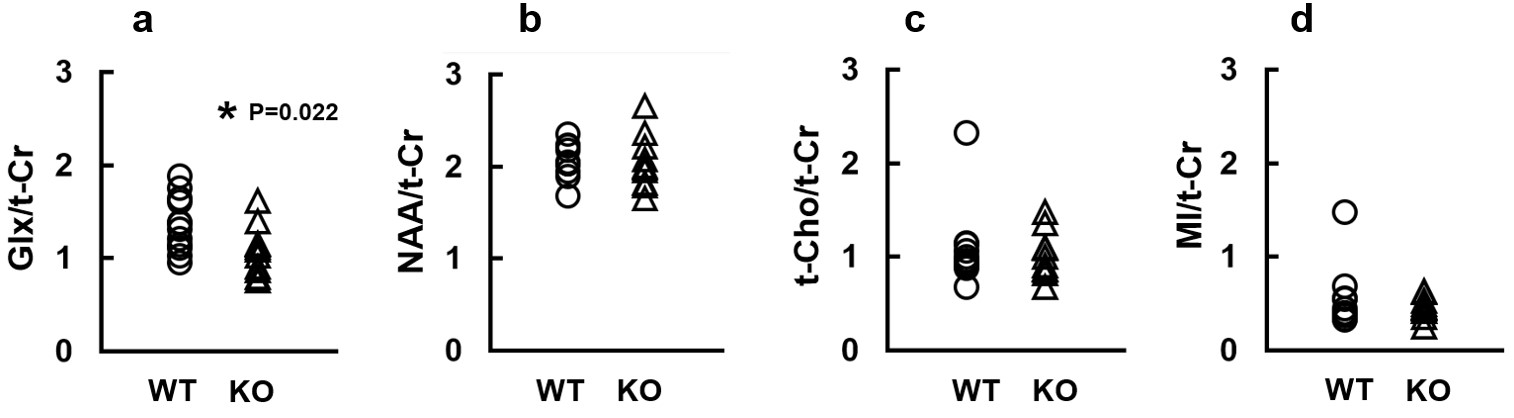
Figure 5 demonstrates various MRS metabolite concentrations normalized to t-Cr in WT and KO groups. The KO group exhibited significantly lower Glx/t-Cr level than WT group (1.08±0.26 vs. 1.37±0.29, p=0.022). The were no significant differences of NAA/t-Cr, Cho/t-Cr and MI/t-Cr levels between the two groups (all p>0.05).
Discussion
In this study, there is no difference in rCBV of hippocampus between WT and KO groups, describing that KO group was with preserved blood volume and might possess unchanged or imperceptible abnormal angiogenesis in hippocampus.Glx is a primary neurotransmitter and precursor in the neurons (13). A study reported that neurodegenerative disease, such as tauopathy, exhibited decreased Glu/t-Cr in hippocampus (15). In this study, the decreased Glx/t-Cr in hippocampus of KO group might potentially link the deficient CRMP-1 gene and impaired neural transmission function in aging CRMP-1 KO mice.
In conclusion, the deficient CRMP-1 gene of an aging mouse model exhibited unchanged rCBV and significantly decreased Glx/t-Cr in the hippocampus region which illustrated the altered neural transmission function.
Acknowledgements
No acknowledgement found.References
1. Su, Kang-Yi, et al. "Mice deficient in collapsin response mediator protein-1 exhibit impaired long-term potentiation and impaired spatial learning and memory." Journal of Neuroscience 27.10 (2007): 2513-2524.
2. Bader, Verian, et al. "Proteomic, genomic and translational approaches identify CRMP1 for a role in schizophrenia and its underlying traits." Human molecular genetics 21.20 (2012): 4406-4418.
3. Cho, K. H., B. H. Lei, and J. H. Chen. "A DTI study of diffusion anisotropy on CRMP-1 knockout mice."
4. Weiss, Craig, Arati Shroff, and John F. Disterhoft. "Spatial learning and memory in aging C57BL/6 mice." Neuroscience Research Communications 23.2 (1998): 77-92.
5. Teng, Hua, et al. "Coupling of angiogenesis and neurogenesis in cultured endothelial cells and neural progenitor cells after stroke." Journal of Cerebral Blood Flow & Metabolism 28.4 (2008): 764-771.
6. Vallon, Mario, et al. "Developmental and pathological angiogenesis in the central nervous system." Cellular and molecular life sciences 71.18 (2014): 3489-3506.
7. Brown, William R., and Clara R. Thore. "Cerebral microvascular pathology in ageing and neurodegeneration." Neuropathology and applied neurobiology 37.1 (2011): 56-74.
8. Shin, Ji Hoon, et al. "Using relative cerebral blood flow and volume to evaluate the histopathologic grade of cerebral gliomas: preliminary results." American Journal of Roentgenology 179.3 (2002): 783-789.
9. Schobel, Scott A., et al. "Differential targeting of the CA1 subfield of the hippocampal formation by schizophrenia and related psychotic disorders." Archives of general psychiatry 66.9 (2009): 938-946.
10. Chang, Linda, et al. "Magnetic resonance spectroscopy to assess neuroinflammation and neuropathic pain." Journal of Neuroimmune Pharmacology 8.3 (2013): 576-593.
11. Kraguljac, Nina V., et al. "Increased hippocampal glutamate and volumetric deficits in unmedicated patients with schizophrenia." JAMA psychiatry 70.12 (2013): 1294-1302.
12. Kegeles, Lawrence S., et al. "Hippocampal pathology in schizophrenia: magnetic resonance imaging and spectroscopy studies." Psychiatry Research: Neuroimaging 98.3 (2000): 163-175.
13. Liemburg, Edith, et al. "Prefrontal NAA and Glx levels in different stages of psychotic disorders: A 3T 1 H-MRS study." Scientific reports 6.1 (2016): 1-8.
14. Kanowski, Martin, et al. "Quantitation of simulated short echo time 1H human brain spectra by LCModel and AMARES." Magnetic Resonance in Medicine: An Official Journal of the International Society for Magnetic Resonance in Medicine 51.5 (2004): 904-912.
15. Crescenzi, Rachelle, et al. "In vivo measurement of glutamate loss is associated with synapse loss in a mouse model of tauopathy." Neuroimage 101 (2014): 185-192.
Figures